SOUTHWEST MISSOURI SNOWSTORM OF 18-19 JANUARY 1995
Daniel Riddle, John Gordon, Steve Lindenberg, Steve Shumway, and Mike Sutton
NWSO Springfield, Missouri
1. Introduction
On 18-19 January 1995, an area of low pressure developed over eastern Texas and intensified as it moved northeast to southern Illinois. This storm produced a band of heavy snow from portions of northeast Oklahoma to northwest Illinois bringing transportation to a halt for two days. In Springfield, Missouri 14.4 inches fell, making it the heaviest 24 hour snowfall since 1980. The cost of clearing the main streets in Springfield alone was estimated at $50,000.
What made this storm unusual was the occurrence of thundersnow in many locations across southwest Missouri at height of the storm. This paper will examine how the models performed, and how the 300 mb jet and isentropic lift aided in the development of heavy snow across southwest Missouri. In addition, this paper will look into reasons why thundersnow developed by examining Conditional Symmetric Instability (CSI) and frontogenetic forcing.
2. Synopsis
At 1200 UTC 17 January 1995, a strong 500 mb shortwave was diving south through the central Rockies. During the next 24 hours, the shortwave continued to deepen. By 1200 UTC 18 January, the shortwave was over southeast Oklahoma with the associated surface low in southeast Texas. Precipitation developing ahead of the system over Arkansas and eastern Oklahoma was initially in the form of rain due to unseasonably warm January temperatures.
Light rain mixed with sleet began falling at the National Weather Service Office in Springfield, Missouri (NWSO SGF) at 1557 UTC 18 January. A changeover to snow was observed at 2200 UTC, and the snow quickly became heavy. At 0000 UTC 19 January, a 500 mb low was forming near the Arkansas and Oklahoma border close to Fort Smith with the accompanying surface low in southeast Arkansas. The area of heavy snow expanded across southwest Missouri during the evening as the 500 mb low continued to deepen rapidly over northwest Arkansas. By 0900 UTC, the 500 mb low was beginning to close off over northwest Arkansas. At 1200 UTC, a closed 500 mb low was located along the Missouri and Arkansas border, just south of SGF, while the accompanying surface low had moved to southern Illinois. The snow ended across southwest Missouri during the midday and early afternoon.
KSGF WSR-88D radar showed distinct higher dBz bands moving north and northwest around the 500 mb low center between 0000 and 0800 UTC. Thundersnow with snowfall rates of 1 to 2 inches per hour was being reported in many locations from Joplin to Lebanon as these bands moved through.
The axis of heavy snowfall was from southwest to central Missouri, with the heaviest falling in a narrow band from near SGF to Lake of the Ozarks (AIZ). The highest snow total reported in southwest Missouri was in Ash Grove, 10 nm northwest of SGF, where a cooperative observer reported 22 inches.
3. Model Data
A) Model performance
PCGRIDD data from the Eta-X and NGM showed that both models advertised this system well in advance. The relative humidity and vertical velocity time and height cross-sections two days prior to the storm indicated plenty of deep moisture and a tremendous amount of vertical lift from the evening of 18 January through the morning of 19 January.
The Eta-X and AVN were the weakest and fastest while the NGM was the strongest and slowest. The NGM was the model of choice for this event as abundant moisture and warm temperatures with this system favored a stronger and deeper storm than either the Eta-X or AVN. It turned out that the NGM did a very good job, but was still a little too far east and not intense enough with the 500 mb low center and surface low.
B) Magic Chart
The Magic Chart (Sangster and Jagler, 1985) was developed as a guide to help forecasters estimate snowfall potential using 12 hr 700 mb net vertical displacement (NVD) from the trajectory model. Forecast values of NVD correspond to the amount of snow possible. For example, NVD of +60 mb corresponds to 6 inches of snow. In addition, two other requirements must be met. The 12 hour forecast of 850 mb temperature must be below zero, preferably -2 to -5 C for heavy snow, and the 1000-500 mb mean relative humidity (MRH) must exceed 90 percent. NGM data was used as it was determined earlier to be the model of choice.
NVD was forecast to be +100 mb in the SGF area, 850 temperatures were forecast to be near -1 or -2 C, MRH values were above 90 percent. The Magic Chart forecasted the potential for 8 to 10 inches of snow over southwest Missouri and, if it not for the thundersnow, would have worked out well.
C) Vertical Motion
Large values of vertical motion are one of the most important variables in the atmosphere as it shows where precipitation will occur and where cyclones develop (Djuric, 1994). The storm on 18-19 January had some of the strongest and most vigorous vertical motions seen over the Ozarks in several years. A feature with this system which acted as a enhance lift was strong upper level divergence associated with the polar jet. The NGM was best at initializing the jet structure with this system.
The 300 mb analysis for 0000 UTC 18 January showed a rapidly deepening trough over the western Plains with a polar upper level jet streak of 100 kts along the base of the trough over New Mexico. Height falls of 80 to 110 m were common over the central and eastern plains. This polar jet streak would accelerate northeast through time and be a crucial forcing mechanism for southwest Missouri.
The NGM forecast for 0600 UTC 19 January predicted that southwest Missouri would be in the right rear entrance region of the polar jet. The forecast was accurate as the 300 mb analysis for 0000 UTC 19 January had a 90 kt jet core over Iowa. As a result, very strong upper level divergence was located over southwest Missouri underneath this right rear jet (Fig. 1). The NGM identified the slope and intensity of the ascending branch of the transverse ageostrophic circulation, thereby indicating deep-tropospheric motions aloft over southwest Missouri (Uccelini, 1988).
Fig. 2 shows the vertical velocity cross section for SGF using data from the 1200 UTC 18  January NGM model run. At 700 mb, vertical velocities over southwest Missouri were forecast to be 13 to 16 microbars per second at 0000 UTC 19 January, corresponding to the start of the heavy snow.
 FIG. 1. Upper level divergence (10-5 /sec) FIG. 2. Vertical Velocity (b/sec)
NGM forecast valid 0000 UTC 19 Jan 1995. cross-section for 37N/93W.
Another way to examine vertical motion is by Q-vectors. From the w Q equation, we can see that the convergence of Q-vectors implies upward vertical motion (w) (Djuric, 1994). The troposphere can be divided into two overlapping layers, 850-500 mb and 700-300 mb. The authors set out to determine how deep the vertical motion was and to see if thundersnow was a possibility. The 700-300 mb Q-vector layer was chosen for this. Fig. 3 shows strong Q-vector convergence over northwest Arkansas and southwest Missouri at 1200 UTC 19 January, just north of where the upper low was forming. By 1800 UTC, the Q-vector convergence maximum shifted to southwest and central Missouri. Such strong vertical motions and large scale forcing associated with this storm led to the formation of heavy snow bands.

FIG. 3. 700-300 mb Q-vector convergence valid 1200 UTC 19 January 1995.
D) Warm Advection
Warm air advection at or near 850 mb was another main ingredient for significant snowfall. The 0000 UTC 19 January 850 mb analysis showed a tight thermal boundary near the developing storm over northwest Arkansas with a 30 kt wind pumping +8C air at Little Rock into southern Missouri. Areas that received the heaviest snowfall in southwest Missouri on 18-19 January had the strongest warm advection at 850 mb.
4. Isentropic Lift
A good correlation exists between isentropic mixing ratios and the maximum amount of snowfall during the ensuing 12 hours (Garcia, 1994). Garcia detailed one technique using isentropic analysis that can be used to forecast the amount of snow.
This technique was used on this storm to see how well it worked in forecasting the heavy snow in southwest Missouri 12 to 24 hours ahead of time.
To run an isentropic cross-section, an isentropic surface had to be chosen. According to Garcia, the best isentropic surface to pick is one which best intersects the 700-750 mb layer over the area of concern, which in this case was southwest Missouri. The 700-750 mb layer was chosen for two reasons: (1) the NGM and Eta-X models use these levels to depict vertical velocities and surface to 500 mb relative humidities, and
(2) the 700-750 mb layer is the optimum elevation for use by the "engine" of the winter storm. The isentropic surface 294K was chosen as the "best fit" over southwest Missouri.
In isentropic analysis, air moving from higher pressure surfaces to lower pressure surfaces implies upward vertical motion. Optimum isentropic lift usually occurs when air flows perpendicular to the constant pressure surfaces. (Moore, 1989)
An effective mixing ratio value for the 12 hour period can be calculated by averaging the mixing ratio over the area of concern and the highest mixing ratio that could be advected into this area. This average mixing ratio value will provide the basis for the maximum snowfall forecast. Multiplying the average wind speed by the time period of 12 hours will give the approximate distance to the point where the highest mixing ratio can be obtained.
Taking the average mixing ratio value and using the following table will give an estimate of snowfall for a 12 hour period:
SNOWFALL SCALE (12 HOUR PERIOD)
1-2 g/kg = 2-4 inches of snow
2-3 g/kg = 4-6 inches of snow
3-4 g/kg = 6-8 inches of snow
4-5 g/kg = 8-10 inches of snow
5-6 g/kg = 10-12 inches of snow
6-7 g/kg = 12-14 inches of snow
TABLE 1
Snowfall scale from Garcia (1994)
Heavy snow began in southwest Missouri around 0000 UTC 19 January. The goal was to see how well Garcia's method worked in forecasting the amount of the snow in the ensuing 12 hours (0000 to 1200 UTC time frame). A 24 hour forecast using 0000 UTC 18 January NGM data and a 12 hour forecast using 1200 UTC 18 January was used in the analysis. The 294K isentropic surface was used.
0000 UTC 18 January NGM model run (24 Hour Forecast)
Fig. 4 shows that mixing ratios over southwest Missouri were forecast to be around 3.5 g/kg at 0000 UTC 19 January. Southeast flow from regions of higher pressure to lower pressure was perpendicular to the constant pressure surfaces implying significant vertical lift. The average wind speed was determined to be 15 kts. To estimate the distance from the area of concern to the maximum values of mixing ratios, multiply the average wind by 12 hrs. This value of 180 nm puts the maximum mixing ratios of 7.5 g/kg in eastern Arkansas. Taking the average of the mixing ratios (3.5 and 7.5 g/kg) gives an effective mixing ratio of 5.5 g/kg. According to Table 1, this yields 10 to 12 inches of snow .
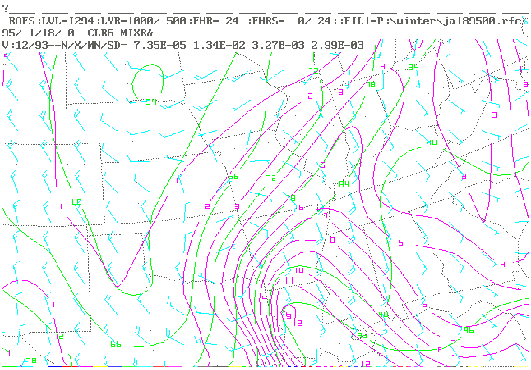
FIG. 4. Isentropic surface 294K analysis valid 0000 UTC 19 January 1995.
Mixing ratios in g/kg, wind speed in kts, and pressure surfaces in mb.
1200 UTC 18 January NGM model run (12 Hour Forecast)
Fig. 5 that shows mixing ratios over southwest Missouri were forecast to be around 4.0 g/kg at 0000 UTC 19 January. Southeast flow perpendicular to the constant pressure surface still indicated good upward vertical motion, as air flowed from higher pressure to lower pressure. The air flow continued to transport Gulf moisture into southwest Missouri. As in the previous case, the average wind speed was determined to be 15 kts and the estimated distance from the area of concern was 180 nm. This time the maximum mixing ratio was 7.0 g/kg. Taking the average of the mixing ratios (4.0 and 7.0 g/kg), also gives an effective mixing ratio of 5.5 g/kg. According to Table 1, this means that 10 to 12 inches of snow is possible.

FIG. 5. Isentropic surface 294K analysis valid 1200 UTC 19 January 1995
Mixing ratios in g/kg, wind speeds in kts, and pressure surfaces in mb.
Garcia's method and the Magic Chart worked well in predicting general snow amounts, while PCGRIDDs data showed the amount of vertical motion needed to produce heavy snow. However, why did thunderstorms form? It is believed the presence of Conditional Symmetric Instability and frontogenetic forcing aided in the development of thunderstorms over southwest Missouri.
5. Conditional Symmetric Instability (CSI)
Conditional Symmetric Instability (CSI) refers to the situation where a displaced parcel of air is stable when subjected to a horizontal or vertical displacement, but unstable if lifted in a diagonal, or slantwise manner. Air parcles displaced along certain diagonal trajectories may obtain positive buoyancy due to a combination of gravitational and centrifugal forces (Bradshaw, 1994). Thus, thunderstorms that occur in areas of CSI are often referred to as slantwise convection. Detailed information regarding the theory behind CSI is beyond the scope of this paper and the interested reader is referred to the works cited. However, past studies (Bennetts and Sharp, 1982 and Lussky, 1989) indicated CSI-enhanced precipitation often occurs in narrow bands, on the order of 10-100 nm wide, that are oriented parallel to the wind. Snowfall rates of 2 to 3 inches per hour may occur in CSI precipitation areas, with thunder and lightning observed in many cases.
To examine for CSI, the ambient environment must be deemed suitable for CSI. Snook (1992) listed the following factors as important conditions necessary for CSI:
1. Low static stability,
2. Wind increasing with height,
3. Wind veering with height, and
4. Layer near saturation and well mixed.
Moore and Lambert (1993) offer a theoretical value of 80 percent for the relative humidity in the area of CSI.
The 0000 UTC (Fig. 6) and 1200 UTC (Fig. 7) 19 January upper air sounding from Monett, Missouri (UMN) were analyzed with gridded data to determine if the CSI conditions had been met. Stability indices for surface based parcels were very high, +13 at 0000 UTC and +21 at 1200 UTC. It appears, however, that parcels lifted above 700 mb possessed higher potential static instability. As for the wind direction and speed, the criteria above were met. Wind speeds and directions veered above 700 mb on the 0000 UTC sounding, implying that an elevated layer of CSI was present. The 1200 UTC sounding also had wind speeds increasing with heights. However, the increase started from the surface and while veering was noted in the lower levels, a slight backing was indicated above 500 mb. By 1200 UTC, the thundersnow reports had ceased and the heavy snow had moved to the northeast of the area. Finally, the 0000 UTC sounding was near saturation, with dew point depressions less than 3C from the surface to 600 mb, and less than 10C through 400 mb. By 1200 UTC, however, the system had moved to the northeast and significant drying of the atmosphere occurred over southwest Missouri.

FIG. 6. UMN sounding for 0000 UTC 19 January 1995.

FIG. 7. UMN sounding for 1200 UTC 19 January 1995.
Eta-X, NGM, and AVN gridded sets were analyzed to determine the presence of CSI. Cross-sections were taken perpendicular to the thermal wind for the forecast periods corresponding to 0000 UTC, 0600 UTC, and 1200 UTC 19 January. AVN gridded data was not available for 0600 UTC. The same cross-section was used throughout the analysis for two reasons: proximity to thundersnow reports, and the similarity of 0000 UTC 19 January Eta-X, NGM, and AVN thickness analyses.
With the cross-sections determined, Angular Momentum (Mg) and Equivalent Potential Temperature (e) surfaces were constructed via PCGRIDDS. Mg = vg + fx, where vg is the component of geostrophic wind normal to the cross-section, x is the distance from the end of the cross-section, and f is the coriolis parameter. CSI exists in those saturated regions where the slope of Mg is equal or less than that of e (Bradshaw, 1994). Investigation of the Eta-X data set from 0000 UTC on 19 January indicated weak to neutral CSI between 700 and 500 mb over southwest Missouri, near 37.5N and 93W. A layer in which potential temperatures decreased with height was noted between 400 and 500 mb, indicating that advection had transported warm, moist air into the region above the frontal boundary. This created a layer of convective instability. Investigation of the 0000 UTC NGM and AVN data sets produced similar results. The forecast for 0600 UTC using NGM and Eta-X data revealed similar features, albeit somewhat weaker, as the area of thundersnow was shifting northeast into central Missouri by midnight.
The gridded data sets for the 48 hours prior to 0000 UTC 19 January were also investigated using the same cross-sections to determine if the models had forecast CSI in advance. Each of the models exhibited CSI as long as 48 hours before the system moved through southwest Missouri.
6. Frontogenetic Forcing
Another factor that can enhance vertical velocities is frontogenetic forcing. Frontogenetic forcing and CSI often work together to enhance the vertical motion field. Frontogenesis often forms in a thermally direct circulation. The thermally direct circulation is usually slanted toward cold air with upward vertical motion on the warm side and downward vertical motion on the cold side (Moore and Blakley, 1988). The gridded data sets were investigated for frontogenesis in the area of concern to look for the possible presence of a thermally direct circulation.
At 0000 UTC 19 January, strong frontogenetic forcing was indicated over northwestern and north central Arkansas and southern Missouri at 850 mb, over southwestern Missouri at 700 mb and over eastern Kansas at 500 mb. From this, one can imply a thermally direct circulation rising from near the surface on the warm side over northern Arkansas and south central Missouri, traveling west-northwest to near 500 mb on the cold side over eastern Kansas. This slanted path likely resulted in enhanced semi-vertical motion in the area of CSI, and while it may not have initiated convection, it may have acted to enhance its persistence and intensity. Fig. 8 shows an area of maximum frontogenesis at 700 mb over southwest Missouri. Values of 6 X 10 -10 K m-1 s-1 were noted in the same location as where CSI was observed.
Thus, frongenetical forcing and CSI worked together in this storm to enhance vertical motion over southwest Missouri.

FIG. 8. 700 mb frontogenetic Forcing(x 10-10 K m-1 s-1) for 0000 UTC 19 January.
From data analysis, one can infer that initially the environment was less stable above 700 mb. As the evening progressed and the system intensified, the easterly winds around 850 mb were forced up and over the cooler airmass that was being advected into the area on the northerly low level winds. This, combined with the thermally direct circulation enhanced by frontogenetical forcing, caused elevated thunderstorms to develop in an area of weak to neutral CSI. The result was banded precipitation and thundersnow. After midnight, as the storm began to lift northeast into central Missouri, drier air was advected in at all levels over southwest Missouri and the elevated layer of instability was removed.
7. Conclusion
Heavy snow fell across southwest Missouri from the afternoon of 18 January 1995 to the morning of 19 January 1995, with some locations receiving more than 20 inches. While storms of this magnitude have occurred in the past, this storm was unusual in that it was accompanied by thunderstorms. Strong warm advection accompanied by intense vertical lift caused this storm to deepen rapidly. Isentropic lift played an integral part in the storm as very moist air was lifted north into the cold air over southwest Missouri. An analysis of the UMN sounding data and model PCGRIDD data, indicated an area of Conditional Symmetric Instability (CSI) was present near 700 mb implying elevated convective instability was present. CSI and frontogenetic forcing worked together and aided in the development of thunderstorm bands which moved through southwest Missouri dumping 1 to 2 inches of snow per hour. CSI and isentropic lift play a key role in winter storm development and precipitation intensity. Both can be examined through close analysis of sounding and PCGRIDD data. It is up to the forecaster to examine the whole spectrum of data if an accurate forecast is to be made.
8. Acknowledgments
The authors are grateful to Dave Gaede, SOO at NWSO Springfield for his help in gathering data and for his critique of the paper. Additional thanks goes to Douglas Kennedy, meteorologist intern at WSO Columbia, Missouri for his help in sending upper air and surface maps, and to Bill Davis, MIC at NWSO Springfield, for this support in this study.
9. References
Bennets, D. A., and J.C. Sharp, 1982: The Relevance of Conditional Symmetric
Instability to the Prediction of Mesoscale Frontal Rainbands, Quarterly Journal of the Royal Meteorological Society, 108, 595-602.
Bradshaw, Tom, 1994: Relationships Between Conditional Symmetric Instability,
Thunder, and Heavy Snowfall During the "Storm of the Century", SR Technical Attachment 94-21, 8 pp.
Djuric, D., 1994: Weather Analysis. Prentice Hall, 304 pp.
Garcia, Crispin, Jr., 1994: Forecasting Snowfall Using Mixing Ratios on an Isentropic
Surface - An empirical study. NOAA Technical Memorandum NWS CR-105,
28 pp.
Lussky, Glenn R., 1989: Heavy Rains and Flooding in Montana: A Case for Operational
Use of Symmetric Instability Diagnosis, Weather and Forecasting, 4, 186-201.
Moore, James T., and P. D. Blakley, 1988: The Role of Frontogenetical Forcing
and Conditional Symmetric Instability in the Midwest Snowstorm of 30-31
January 1982, Monthly Weather Review, 116, 2155-2171.
Moore, James T., 1989: Isentropic Analysis and Interpretation, NWS Training Center,
84 pp.
Moore, James T., and T. E. Lambert, 1993: The Use of Equivalent Potential
Vorticity to Diagnose Regions of Conditional Symmetric Instability, Weather and
Forecasting, 8, 301-308.
Sangster, Wayne E., and E. Jagler, 1985: The (7WG,8WT) "Magic" Chart, CR
Technical Attachment 85-1, 5 pp.
Snook, John S., 1992: Current Techniques for Real-Time Evaluation of Conditional
Symmetric Instability, Weather and Forecasting, 7, 430-439.
Uccellini, L. W., K. F. Brill, P. J. Kocin, and J. S. Whitaker, 1988: Model Diagnositics
of East Coast Storms, Second National Winter Weather Workshop: NOAA
Technical Memorandum ER-32, 15 pp.


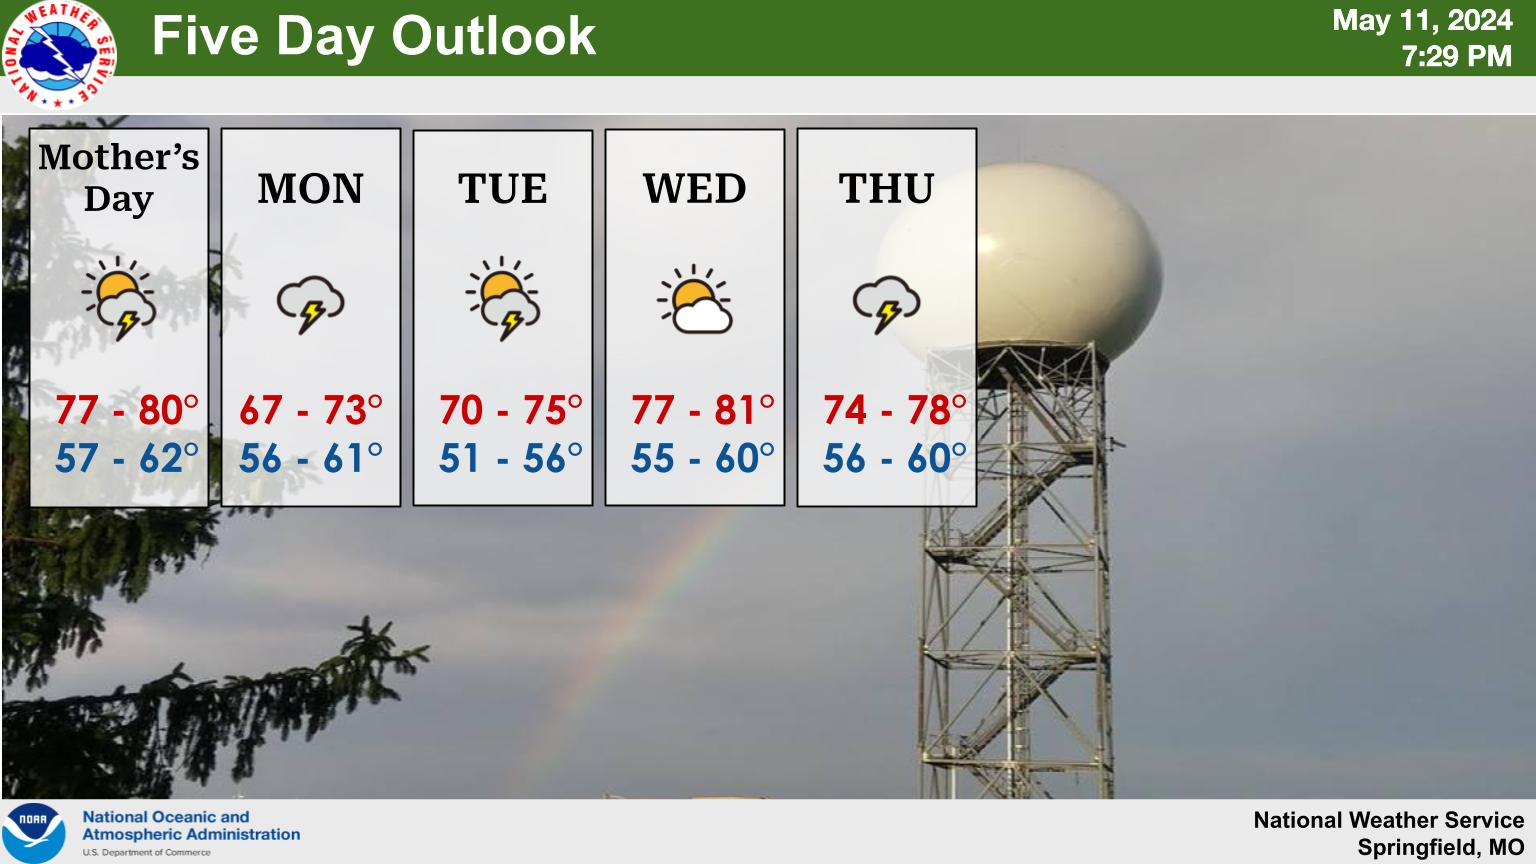 Weather Story
 Weather Map
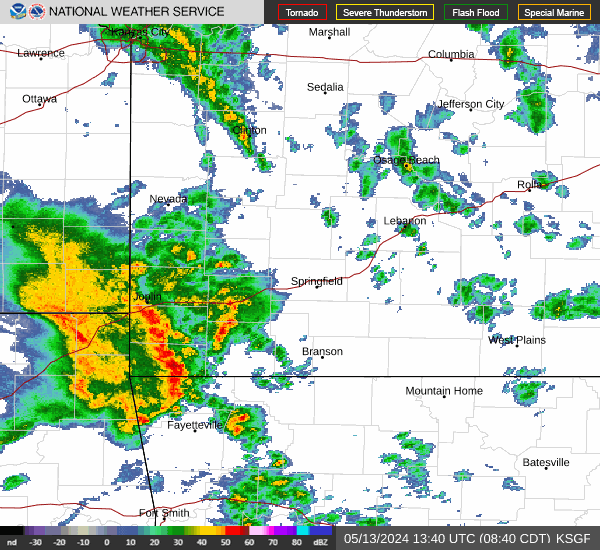 Local Radar