Southeast RFC
River Forecast Center
These graphs are automated model output produced every three hours. To collaborate on the inflow guidance please call our office...770-486-0028 ext 1.
<center>
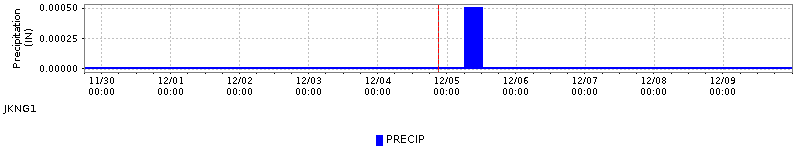
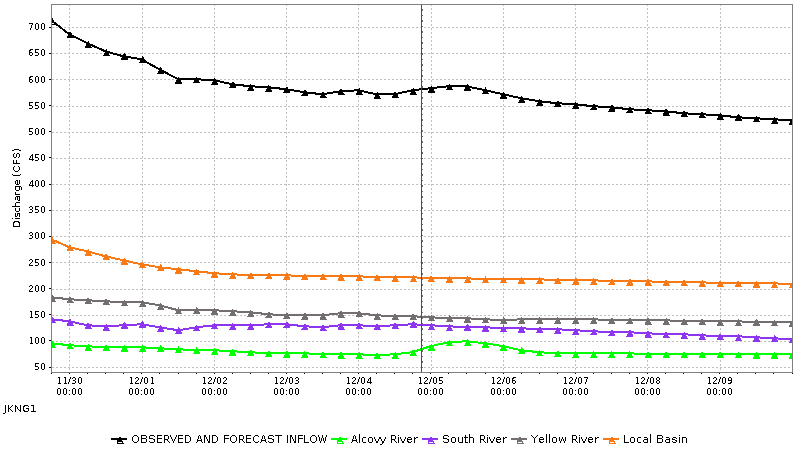
| Jackson Dam Gridded Precipitation Areal Mean Estimate IN | INFLOW River Discharge Simulated Instantaneous CFS | |
|---|---|---|
| 05/25/2026 18GMT | 0.05 | 998.11 |
| 05/26/2026 00GMT | 0.88 | 971.92 |
| 05/26/2026 06GMT | 0.00 | 1236.72 |
| 05/26/2026 12GMT | 0.02 | 1795.28 |
| 05/26/2026 18GMT | 0.12 | 2284.96 |
| 05/27/2026 00GMT | 0.39 | 2548.72 |
| 05/27/2026 06GMT | 0.00 | 2383.84 |
| 05/27/2026 12GMT | 0.00 | 2211.53 |
| 05/27/2026 18GMT | 0.00 | 2905.44 |
| 05/28/2026 00GMT | 0.01 | 3568.80 |
| 05/28/2026 06GMT | 0.00 | 3253.84 |
| 05/28/2026 12GMT | 0.00 | 2800.34 |
| 05/28/2026 18GMT | 0.00 | 2430.06 |
| 05/29/2026 00GMT | 0.01 | 2045.06 |
| 05/29/2026 06GMT | 0.00 | 1665.87 |
| 05/29/2026 12GMT | 0.01 | 1366.54 |
| 05/29/2026 18GMT | 0.07 | 1190.23 |
| 05/30/2026 00GMT | 0.31 | 1092.56 |
| 05/30/2026 06GMT | 0.45 | 1090.94 |
| 05/30/2026 12GMT | 0.03 | 1153.07 |
| 05/30/2026 18GMT | 0.02 | 1338.91 |
| 05/31/2026 00GMT | 0.07 | 1683.21 |
| 05/31/2026 06GMT | 0.12 | 1990.55 |
| 05/31/2026 12GMT | 0.02 | 2064.65 |
| 05/31/2026 18GMT | 0.06 | 2023.12 |
| 06/01/2026 00GMT | 0.01 | 1937.57 |
| 06/01/2026 06GMT | 0.02 | 1810.62 |
| 06/01/2026 12GMT | 0.02 | 1633.08 |
| 06/01/2026 18GMT | 0.00 | 1437.38 |
| 06/02/2026 00GMT | 0.00 | 1253.87 |
| 06/02/2026 06GMT | 0.00 | 1090.62 |
| 06/02/2026 12GMT | 0.00 | 944.75 |
| 06/02/2026 18GMT | 0.00 | 811.42 |
| 06/03/2026 00GMT | 0.00 | 715.08 |
| 06/03/2026 06GMT | 0.00 | 650.43 |
| 06/03/2026 12GMT | 0.00 | 604.63 |
| 06/03/2026 18GMT | 0.00 | 571.35 |
| 06/04/2026 00GMT | 0.00 | 549.54 |
| 06/04/2026 06GMT | 0.00 | 535.38 |
| 06/04/2026 12GMT | 0.00 | 527.46 |
| 06/04/2026 18GMT | 0.00 | 521.61 |
</center>
US Dept of Commerce
National Oceanic and Atmospheric Administration
National Weather Service
Southeast RFC
4 Falcon Drive
Peachtree City, GA 30269
770-486-0028
Comments? Questions? Please Contact Us.

