
Severe thunderstorms will be possible over parts of the Great Plains today through Wednesday which could bring large hail, damaging winds, and possible tornadoes. Slight Risks (level 2 of 5) of severe thunderstorms has been outlooked. Read More >
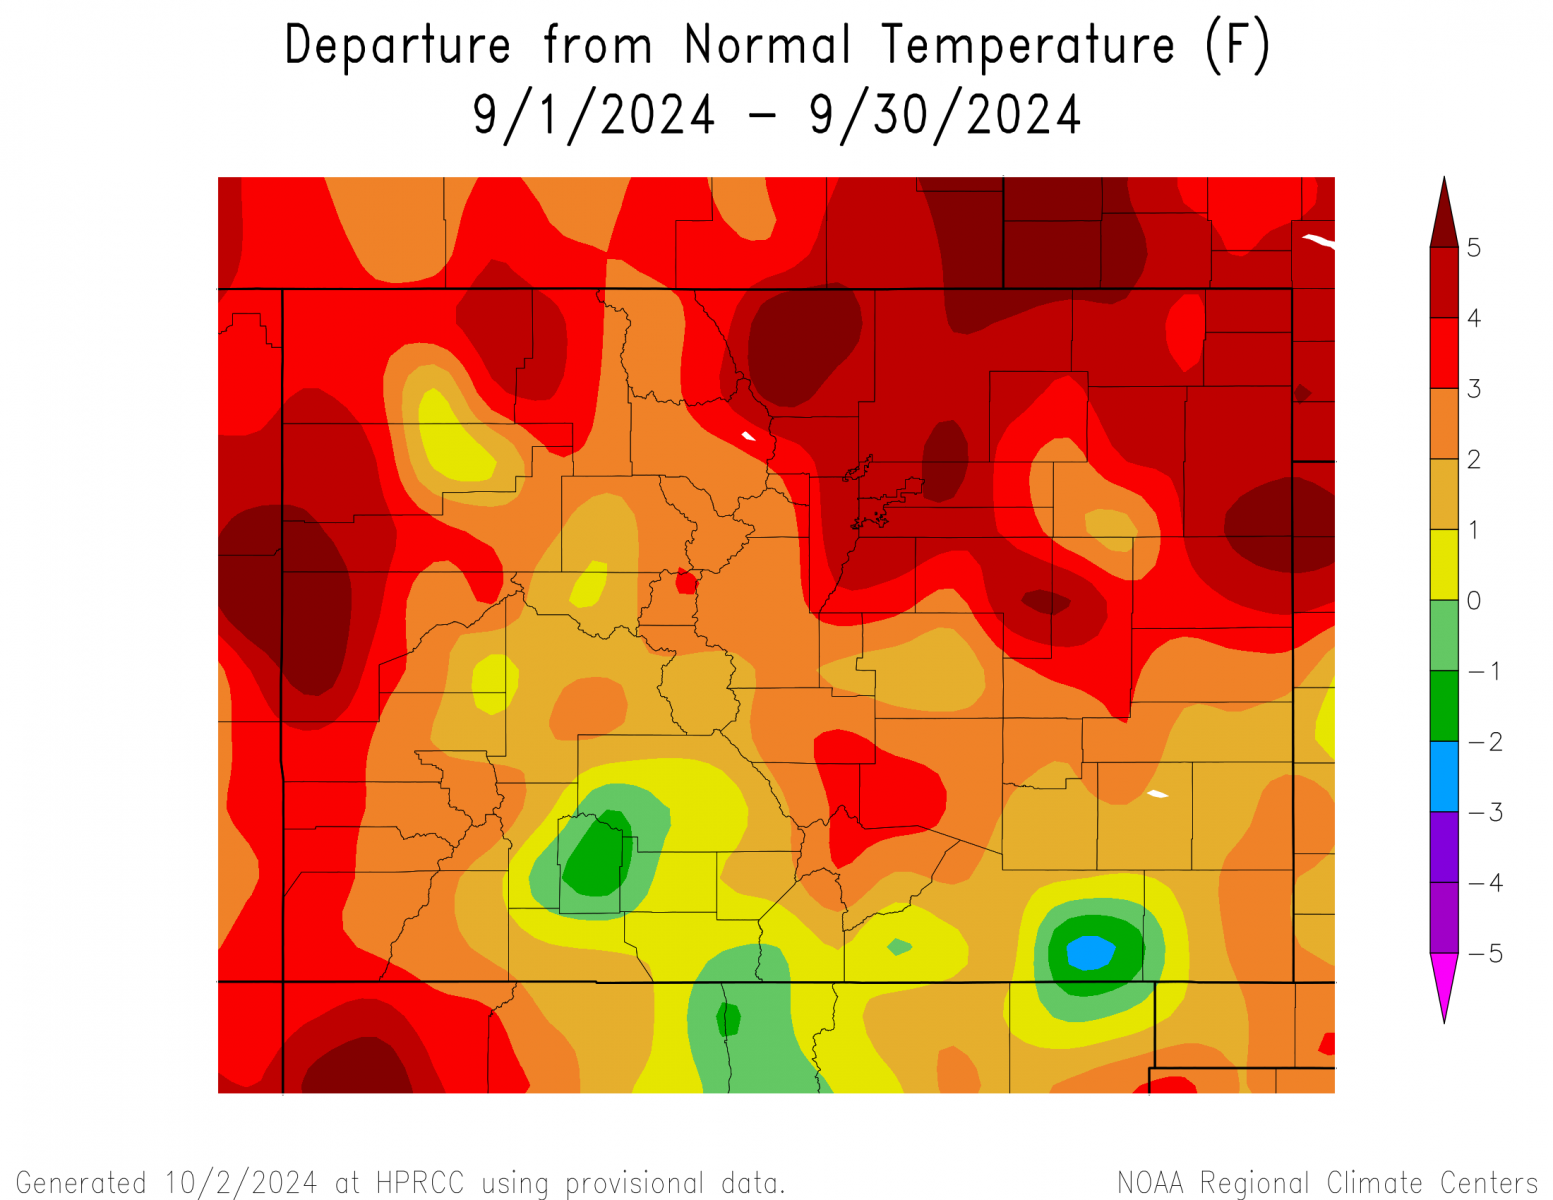
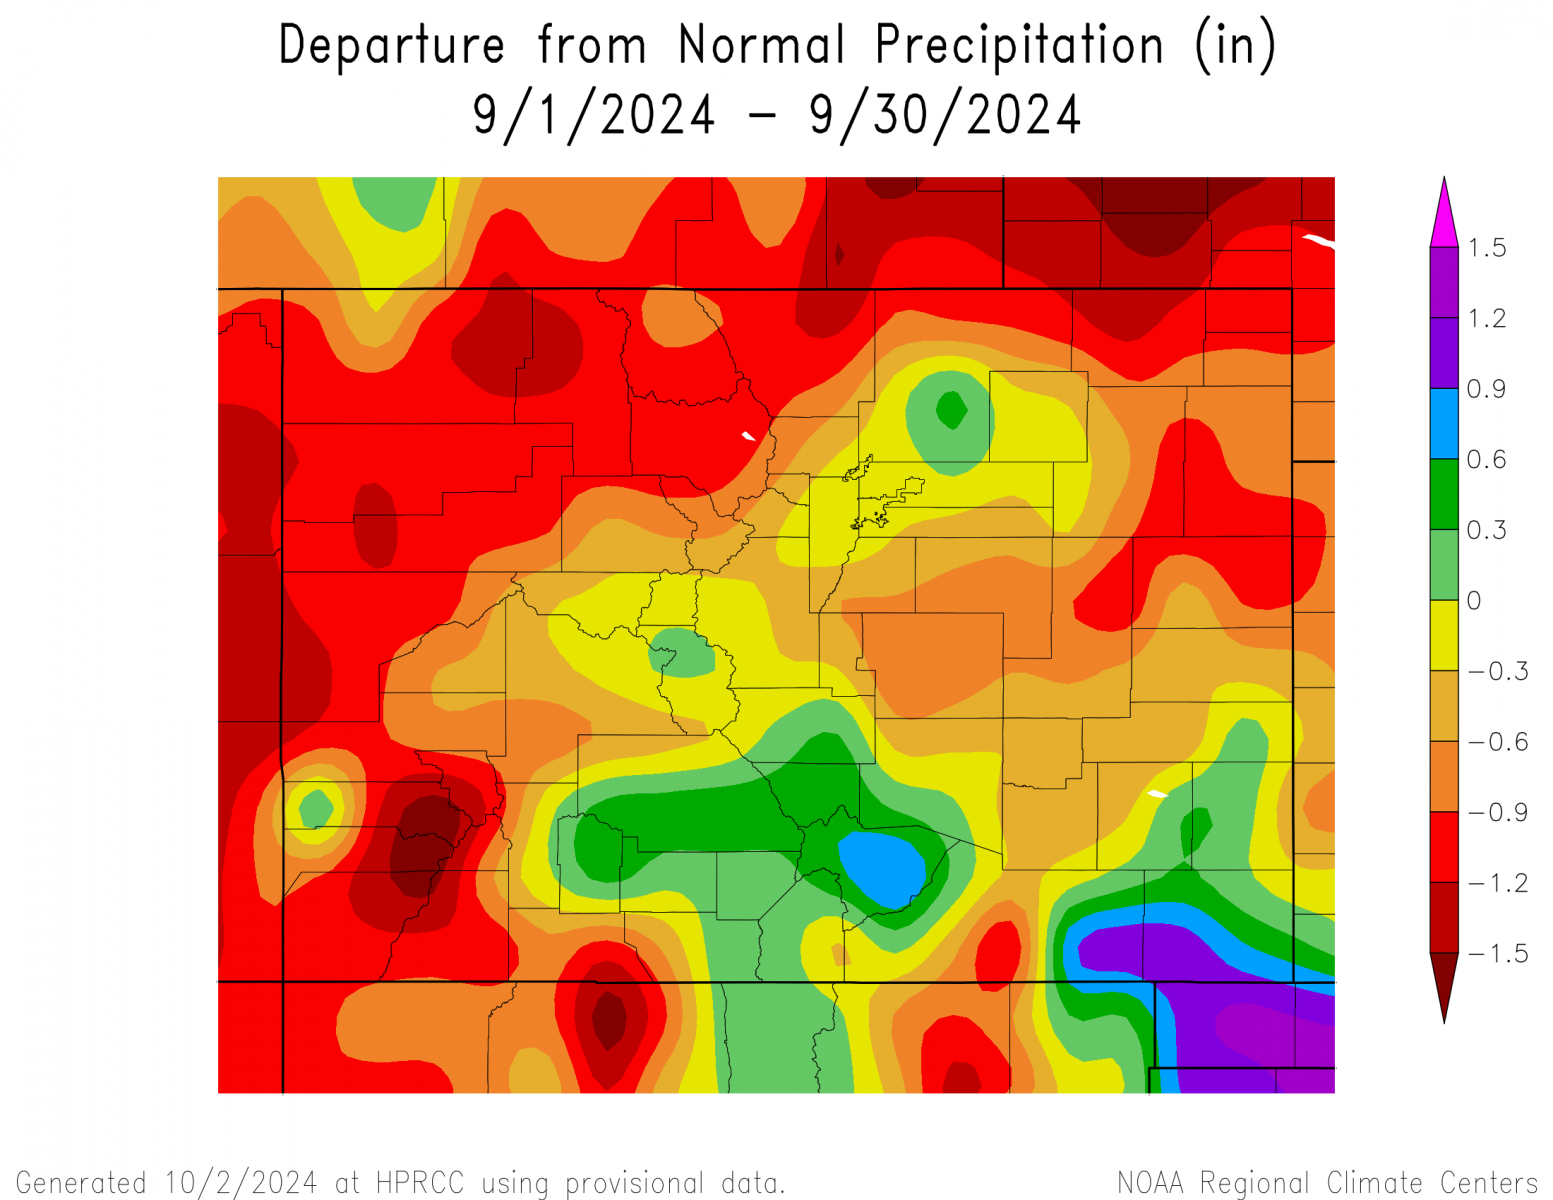
September of 2024 followed the last few months of summer, in which a meandering ridge of high pressure across the Rockies brought periods of very warm temperatures, as well as allowing for a few passing weather systems and fronts to bring brief cool downs and rain and higher mountain snow across the region. For the month of September as a whole, above normal temperatures and generally below normal precipitation was experienced across region, save for above normal precipitation for portions of south central Colorado into the southeast mountains and far southeast Plains.
The following graphics depict monthly temperature and precipitation departures from normal across the state for the past month of September.
 |
 |
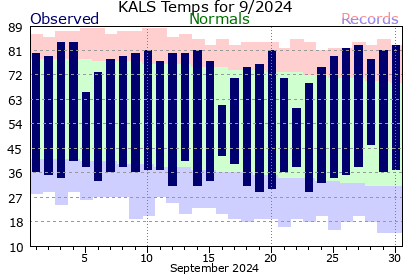
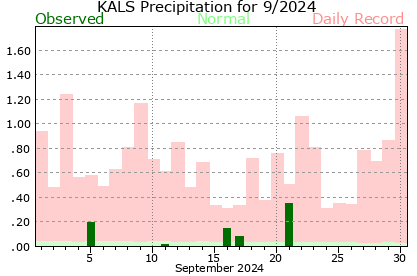
The preliminary average temperature in Alamosa for the past month of September was 56.7 degrees. This is 0.8 degrees above normal and makes September of 2024 the 24th warmest September on record in Alamosa. This is well below the warmest September of 2022 when the average monthly temperature was 59.9 degrees. The average September maximum temperature in Alamosa was 76.8 degrees, which is 2.4 degrees above normal. The average September minimum temperature in Alamosa was 36.6 degrees, which is 0.2 degrees below normal. Alamosa recorded 0.77 inches of precipitation through the month of September, which is 0.21 inches below normal. Alamosa set 2 daily record high temperatures in the month of September. (ALS POR: 1932-2024)
 |
 |
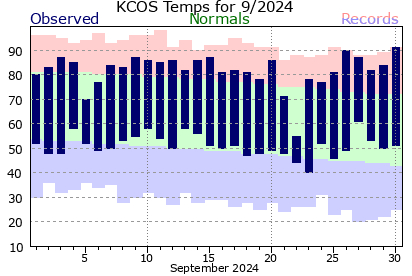
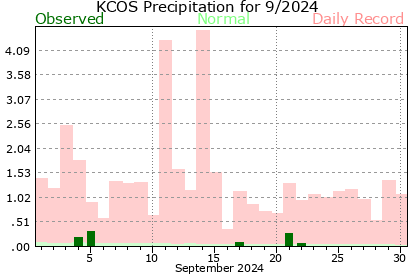
The preliminary average temperature in Colorado Springs for the past month of September was 66.4 degrees. This is 3.4 degrees above normal and makes September of 2024 the 8th warmest September on record in Colorado Springs. This remains well behind the warmest September of 2019 when the average monthly temperature was 68.7F. The average September maximum temperature in Colorado Springs was 81.7 degrees, which is 4.6 degrees above normal. The average September minimum temperature in Colorado Springs was 51.0 degrees, which is 2.1 degrees above normal. Colorado Springs recorded 0.87 inches of precipitation through the month of September, which is 0.48 inches below normal. Colorado Springs had no snow through the month of September, which is 0.2 inches below normal. Colorado Springs set 2 daily record high temperatures and 1 daily record high minimum temperature in the month of September. The record high temperature of 91 degrees on September 30th also became the latest date of seeing 90+ degree temperatures in Colorado Springs, surpassing the 91 degrees set on September 25th, 2020. (COS POR: 1894-2024)
 |
 |
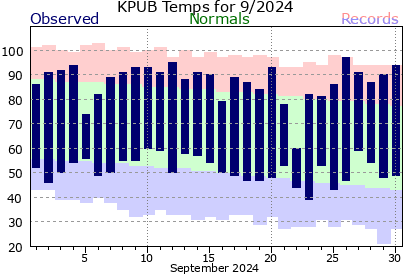
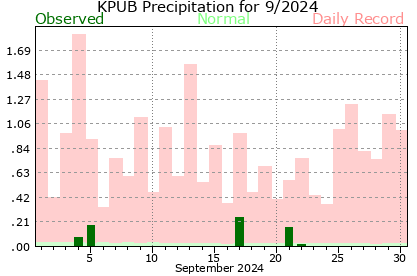
The preliminary average temperature in Pueblo for the past month of September was 69.2 degrees. This 2.6 degrees above normal and makes September of 2024 the 15th warmest September on record. This remains well behind the warmest September of 2019 when the average monthly temperature was 72.8 degrees. The average September maximum temperature in Pueblo was 87.3 degrees, which is 4.2 degrees above normal. The average September minimum temperature in Pueblo was 51.2 degrees, which is 1.1 degrees above normal. Pueblo recorded 0.67 inches of precipitation through the month of September, which is 0.02 inches above normal. Pueblo set 2 daily record high temperatures and 1 record high minimum temperature in the month of September. (PUB POR: 1888-2024)
 |
 |
Looking ahead into October in Alamosa, the average high and low temperatures of 69 degrees and 31 degrees on October 1st, cool to 57 degrees and 19 degrees by the end of the month. The average temperature for the month of October in Alamosa is 43.8 degrees. Alamosa averages 0.65 inches of precipitation and 2.2 inches of snow through the month of October.
In Colorado Springs, the average high and low temperatures of 71 degrees and 43 degrees on October 1st, cool to 59 degrees and 31 degrees by the end of the month. The average temperature for the month of October in Colorado Springs is 50.7 degrees. Colorado Springs averages 0.77 inches of precipitation and 2.5 inches of snow through the month of October.
In Pueblo, the average high and low temperatures of 77 degrees and 43 degrees on October 1st, cool to 63 degrees and 30 degrees by the end of the month. The average temperature for the month of October in Pueblo is 52.8 degrees. Pueblo averages 0.76 inches of precipitation and 1.9 inches of snow through the month of October.
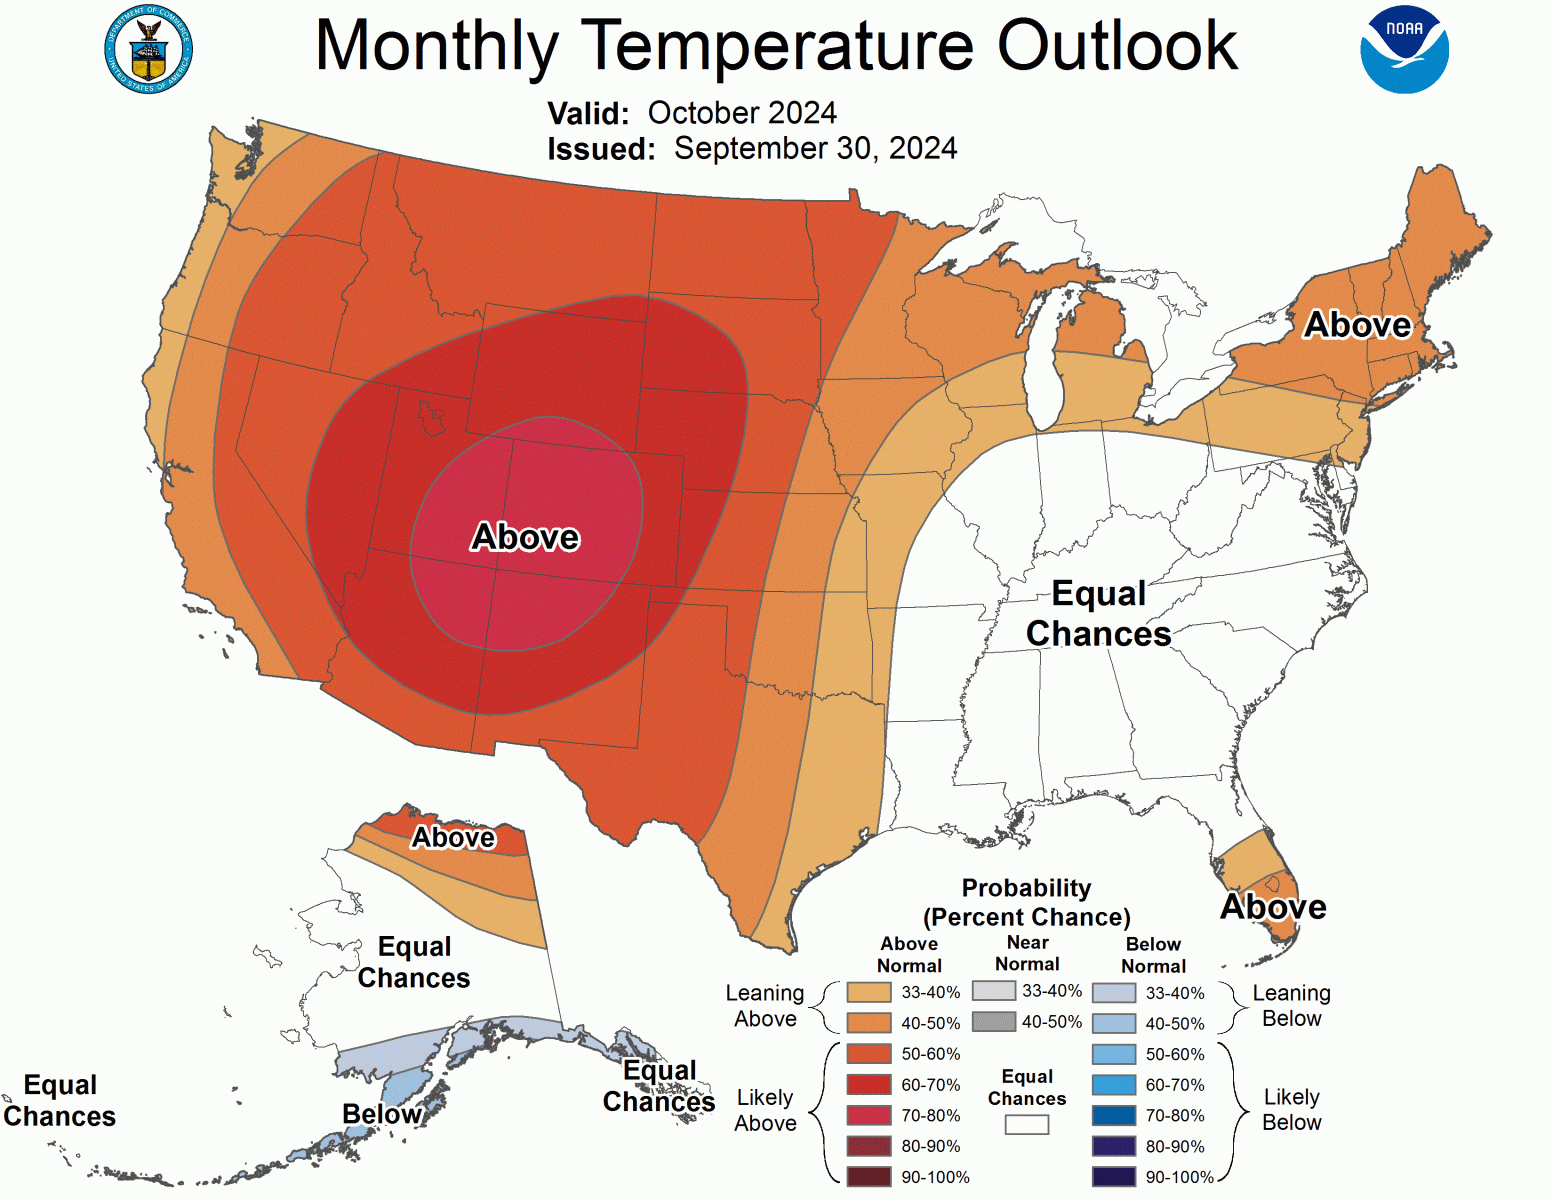
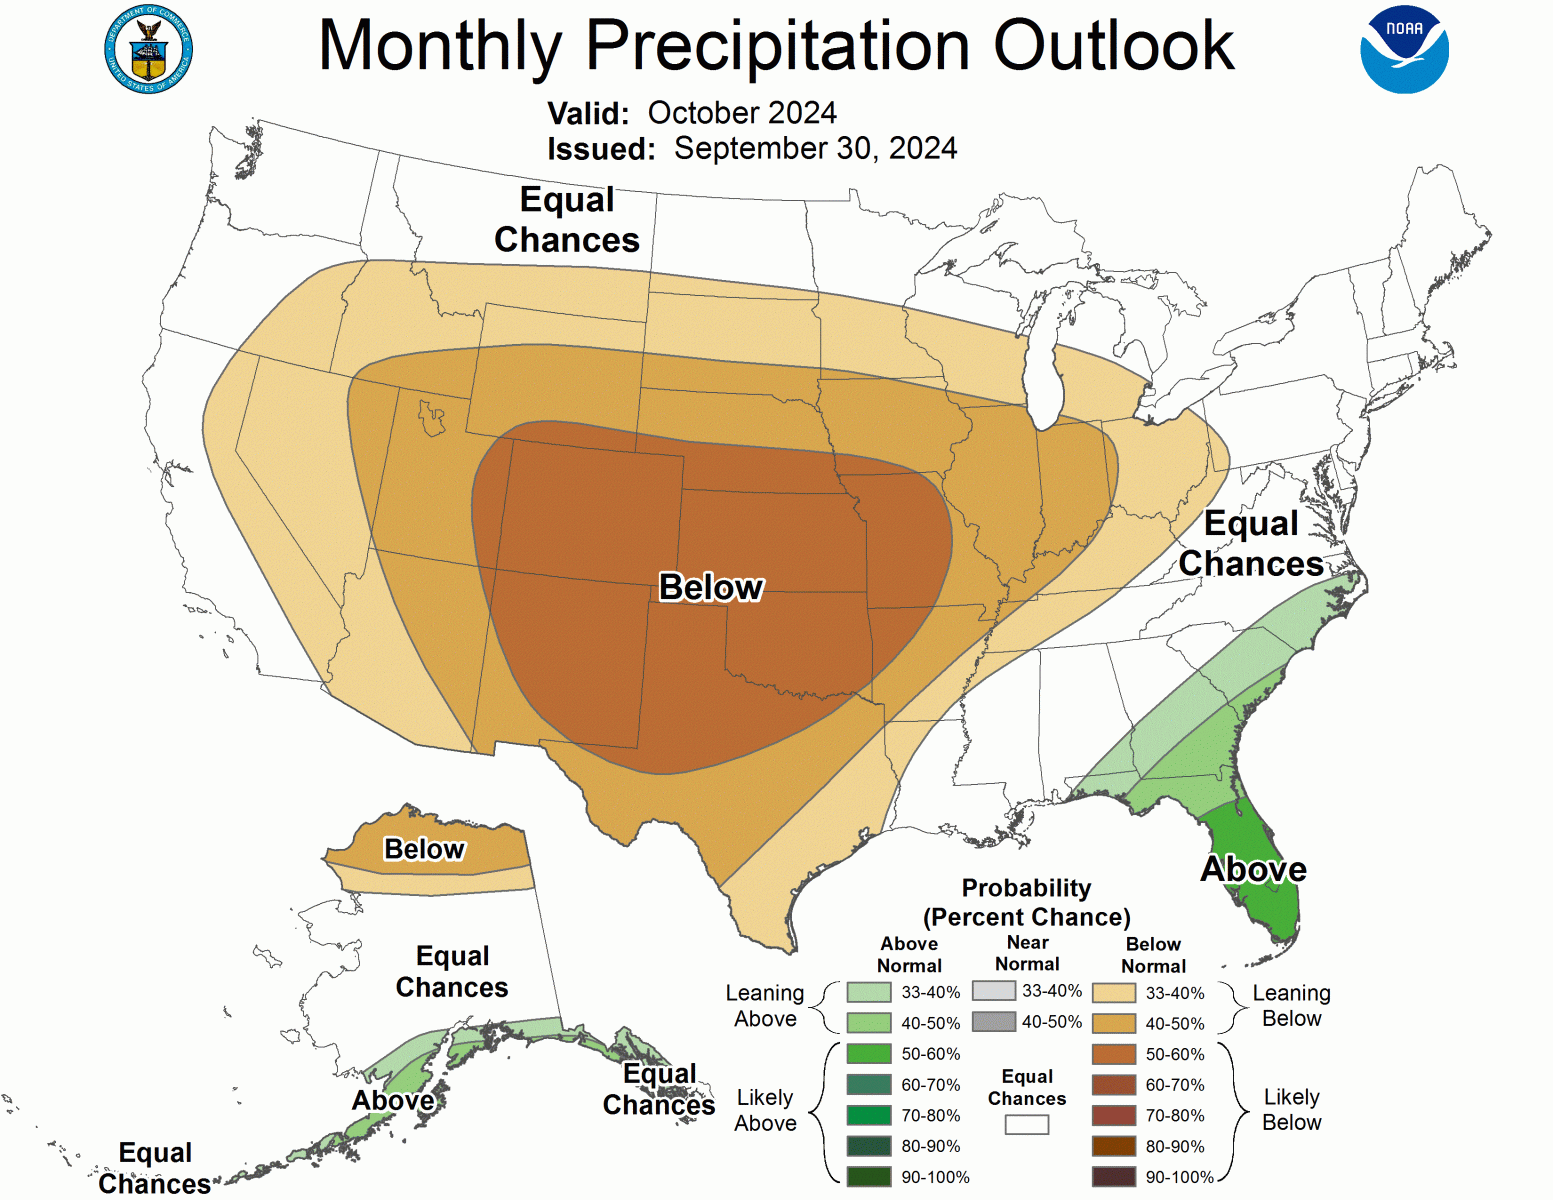
Below is the Climate Prediction Center's (CPC) temperature and precipitation outlook for October of 2024, which leans to above normal temperatures and below normal precipitation across south central and southeast Colorado.
 |
 |

