|
||||||||||||
| Overview | ||||||||||||
| Approximately 11,000 volunteer weather observers participate in the collection of weather data in the United States each day in this large program managed by the National Weather Service. Over 80 of these volunteers are located in Middle Tennessee. The Cooperative Observer Program was formally created in 1890 under the Organic Act. The primary functions of the COOP include defining the weather and climate of the nation, as well as helping to support the NWS mission of protecting lives and property. In many states, and especially in Tennessee, with complex terrain and remote regions, meteorologists depend on the data to produce accurate and detailed forecasts. It is difficult to imagine what the state of weather and climate programs across the United States would be without these valuable observations. Users of COOP data include climatologists, meteorologists, builders, architects, engineers, hydrologists, insurance companies, attorneys, politicians, and/or public utilities to name few. The contributions and impacts of the COOP network are far too numerous to list all of them here, however, a few examples illustrating the value of the program at NWS Nashville are described below. | ||||||||||||
| Impact of COOP Observations on NWS Nashville Operations | |||||
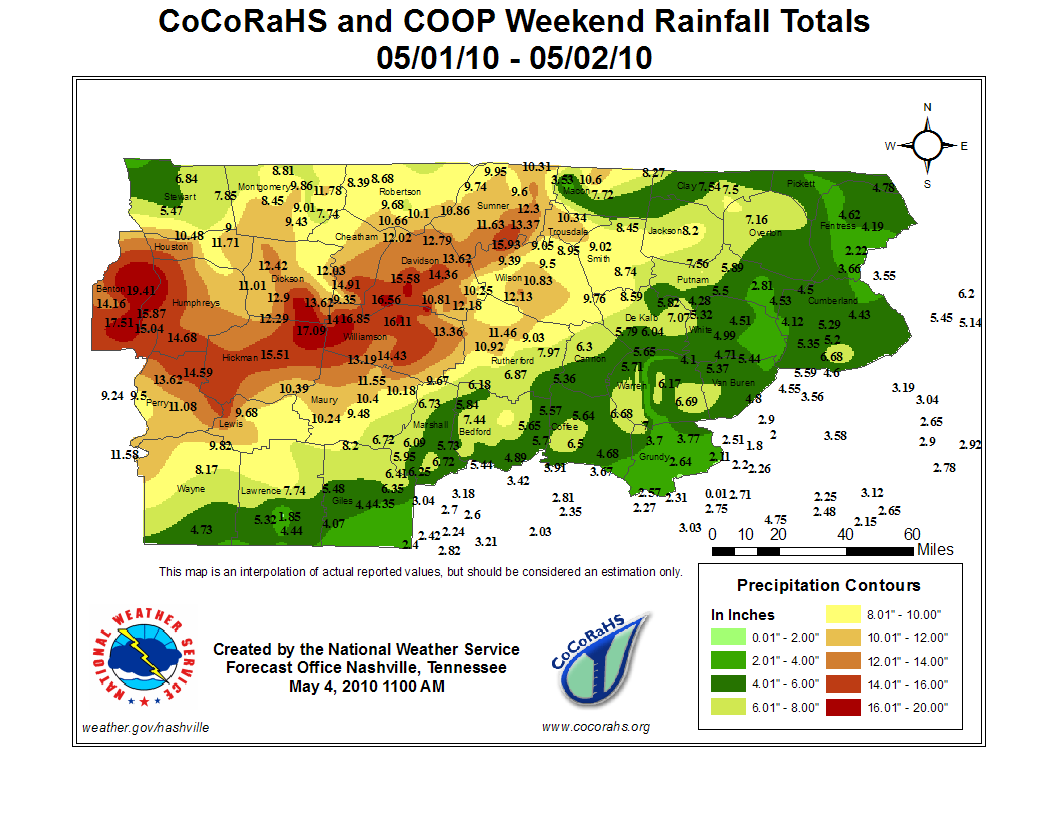
| The contribution of our COOP observations is illustrated in two maps that both depict the rainfall totals from two flooding events. Not only do these data depict which locations could potentially be most susceptible to flooding, but they also allow hydrologists to better forecast river and lake levels with a general knowledge of how much water will be entering a basin. The COOP data were extremely critical in helping to forecast the river and lake levels during and after the historic May 2010 flooding. | |||||
|
|||||
| We also use COOP data to produce daily temperature and precipitation maps, as well as daily climate maps like the ones below. To see these maps, visit this page. | |||||
|
| Impact of COOP Observations on Climate Monitoring | |
| Long-term records of COOP observations are the backbone of climate monitoring, not only in Middle Tennessee, but across the United States. Several of our COOP sites have periods of record that range from 50 to 100 years, or even longer. These records are used to compute means and trends and to examine monthly, seasonal, and annual variations in our climate. The National Weather Service maintains a web site with examples of products that rely on data from the COOP program. Over the years, droughts have had tremendous negative impacts on the economy of the U.S. and the quality of life for its residents. At any give time, a significant percentage of the U.S. can be affected by drought. COOP observations are used to compute a number of drought indices, including the Palmer Drought Index illustrated below. By carefully monitoring drought conditions, we are better able to prepare and properly respond to droughts. |
|
|
|
| COOP observations are sent to the National Centers for Environmental Information (NCEI) in Asheville, NC. These observations, as well as other climate data (historical data sets, normals, extremes, etc.) are available from NCEI. The NCEI data are considered official data, meaning that observations have been quality controlled, published ,and certified. COOP observations from sites with a long period of record, a low percentage of missing data, and few station moves are included in the U.S. Historical Climatology Network (USHCN). This is a high-quality moderate sized data set of monthly averaged maximum, minimum, and mean temperature and total monthly precipitation developed to assist in the detection of regional climate change. The USHCN is comprised of 1,221 high-quality stations from the U.S. Cooperative Observing Network within the 48 contiguous United States. The USHCN was developed and is maintained at the National Centers for Environmental Information (NCEI) and the Carbon Dioxide Information and Analysis Center (CDIAC) of Oak Ridge National Laboratory through a cooperative agreement between the NCEI and the U.S. Department of Energy. |