Grade Summary
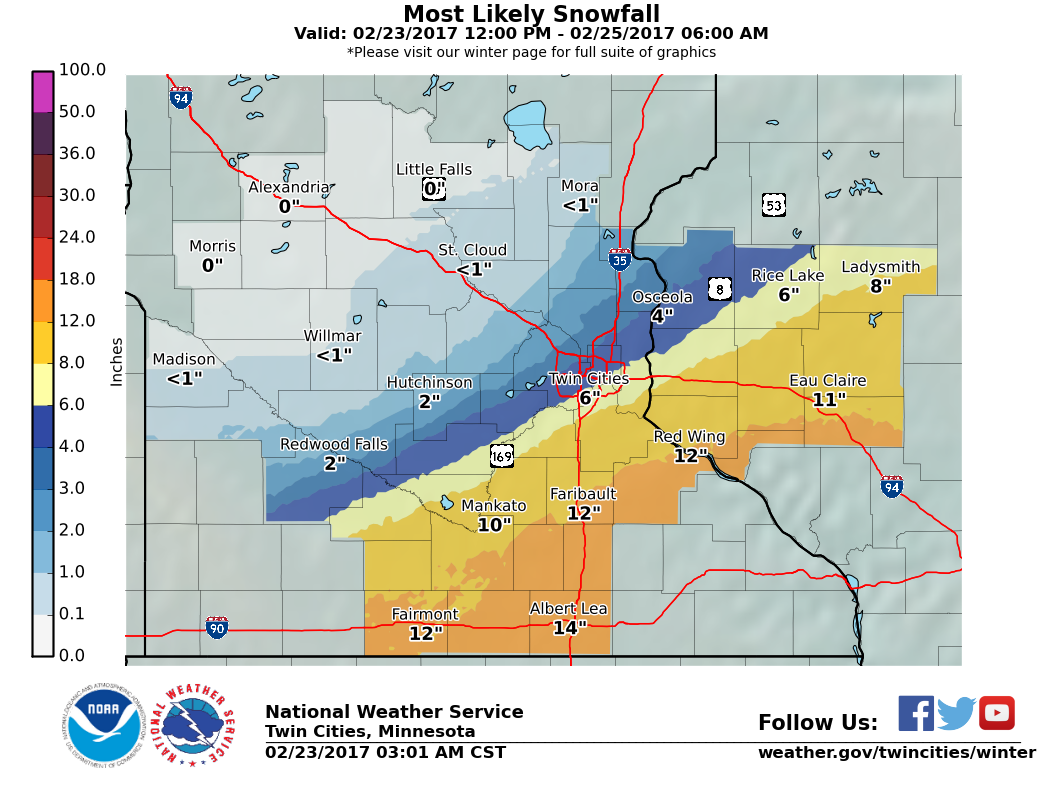
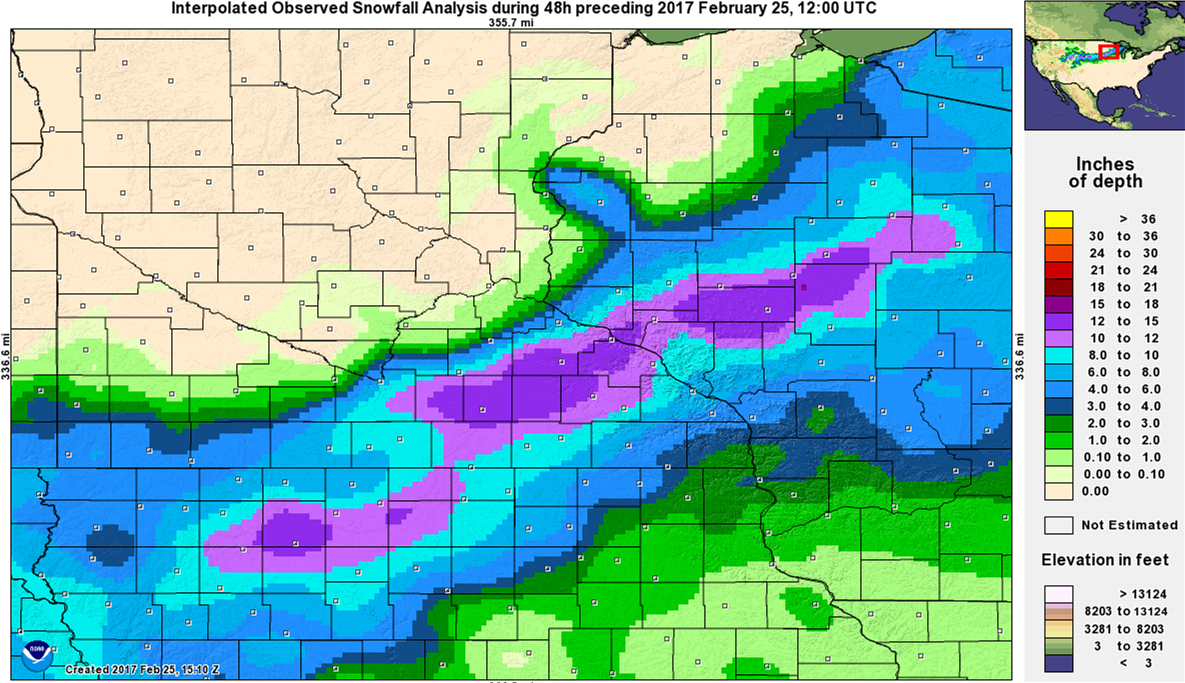
This storm was difficult to forecast. Models were in good agreement painting significant snow across our entire forecast area and only closer to the event, near the time warnings were posted, did it become apparent an exceptionally tight gradient was going to set up somewhere near the Twin Cities. This resulted in drastic changes to the forecast during the period warnings were issued and shortly thereafter. The heavy snow accumulations did pan out across southern Minnesota into west central Wisconsin as forecast, but missed the metro and points north/west entirely.
Local conditions and perceptions may vary from the objective grade calculated below. Step through the other tabs to see a breakdown of the scoring.
| 73% | Graded Element | Possible Points | Actual Points |
| 6 inch contour error | 8 | 5 | |
| Magnitude of snow error | 8 | 8 | |
| Onset timing error | 4 | 4 | |
| Peak wind gust error | 4 | 2 | |
| Probability of Detection/False Alarm Ratio | 8 | 4 | |
| Warning lead time | 8 | 8 | |
| Impact messaging | 4 | 1 | |
| Total | 44 | 32 | |
| Grade | 73% |
6 inch contour error
 |
 |
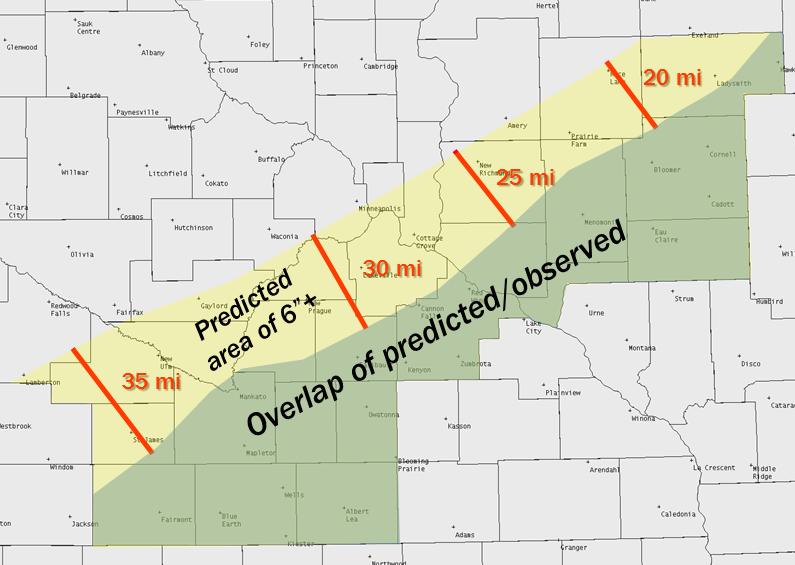 |
| Official snowfall forecast at warning issuance | Observed Snowfall | Overlap of predicted and observed 6 inch snowfall areas |
| Error | Points |
| <=15 miles | 8 |
| 16-20 miles | 7 |
| 21-25 miles | 6 |
| 26-30 miles | 5 |
| 31-35 miles | 4 |
| 36-40 miles | 3 |
| 41-45 miles | 2 |
| 46-50 miles | 1 |
| 51+ miles | 0 |
| Actual: 28 miles | 5 |
Magnitude of snow error
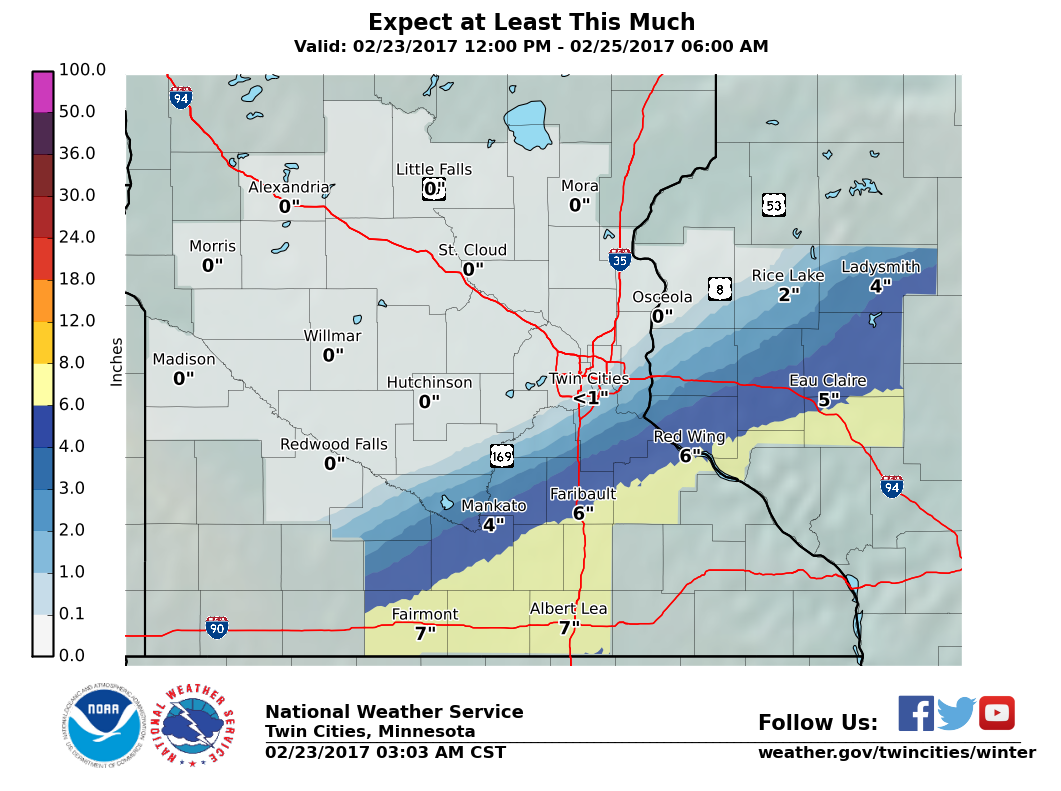
The highest amount of snow forecast was around 14 inches. The actual highest total was 15.5 inches in Kenyon, MN.
 |
 |
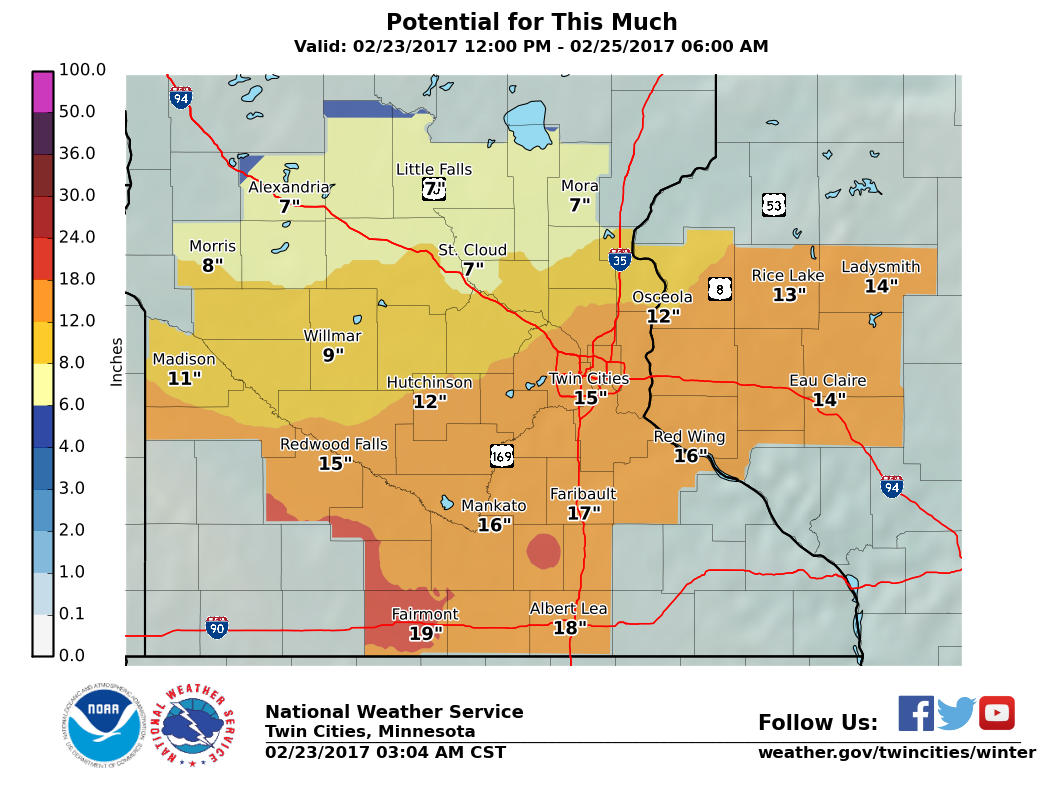 |
| 10th percentile snow at warning issuance (90% chance for more snow than this) | Official snowfall forecast at warning issuance | 90th percentile snow at warning issuance (10% chance for more snow than this) |
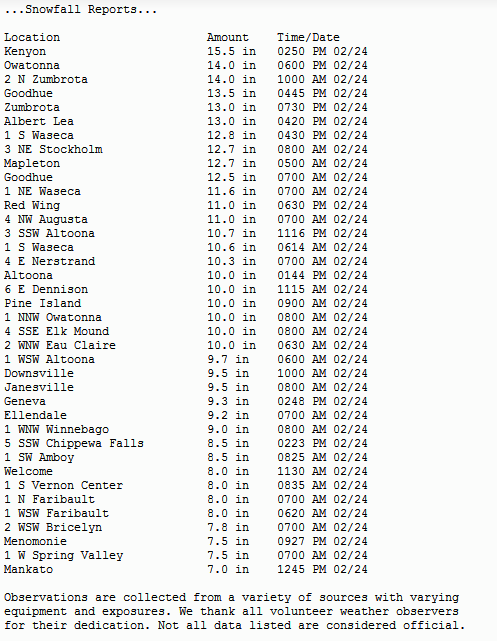 |
| List of Snowfall Totals |
| Error | Points |
| <=2" | 8 |
| 2.1-3.5" | 6 |
| 3.6-5.0" | 4 |
| 5.1-6.5" | 2 |
| 6.6+" | 0 |
| Actual: 1.5" | 8 |
Onset timing error
The time visibility falls to less than 3 miles due to falling snow is noted for each warned weather station at an airport. This is considered the time accumulating snow begins. It is checked against the "When" bullet in the Winter Storm or Blizzard Warning and the difference is calculated. The expected time range will never be greater than 3 hours. The existence of the range is often determined by the number of counties included in each warning grouping. The more counties included, the larger the differences in timing.
| Warned Airport Weather Station | Expected Time ("When" bullet in warning) | Actual time visibility fell to less than 3 miles due to snow | Error (hh:mm) |
| Albert Lea (AEL) | 8-10 pm | 5:13 pm | 2:47 |
| Eau Claire (EAU) | 10 pm-12 am | 11:50 pm | 0:00 |
| Fairmont (FRM) | 8-10 pm | 5:28 pm | 2:32 |
| Faribault (FBL) | 10 pm-12 am | 9:24 pm | 0:36 |
| St. James (JYG) | 8-10 pm | 8:35 pm | 0:00 |
| Menomonie (LUM) | 10 pm-12 am | 12:55 am | 0:55 |
| Mankato (MKT) | 8-10 pm | 9:36 pm | 0:00 |
| Owatonna (OWA) | 8-10 pm | 6:14 pm | 1:46 |
| Red Wing (RGK) | 10 pm-12 am | 10:36 pm | 0:00 |
| Stanton Airfield (SYN) | 10 pm-12 am | 10:34 pm | 0:00 |
| New Ulm (ULM) | 8-10 pm | 9:34 pm | 0:00 |
| Waseca (ACQ) | 8-10 pm | 5:33 pm | 2:27 |
| Average: 0:55 |
| Error | Points |
| <1 hr | 4 |
| 1-2 hr | 3 |
| 2-3 hr | 2 |
| 3-4 hr | 1 |
| 4+ hr | 0 |
| Actual: 00:55 | 4 |
Peak wind gust error
| Warned Airport Weather Station |
Expected wind gusts from warning (mph) |
Actual wind gust (mph) |
Error (mph) |
| Albert Lea (AEL) | 45 | 34 | 11 |
| Eau Claire (EAU) | 40 | 27 | 13 |
| Fairmont (FRM) | 45 | 36 | 9 |
| Faribault (FBL) | 40 | 28 | 12 |
| St. James (JYG) | 45 | 35 | 11 |
| Menomonie (LUM) | 40 | 28 | 12 |
| Mankato (MKT) | 45 | 36 | 9 |
| Owatonna (OWA) | 45 | 34 | 11 |
| Red Wing (RGK) | 40 | 25 | 15 |
| Stanton Airfield (SYN) | 40 | 32 | 8 |
| New Ulm (ULM) | 45 | 28 | 17 |
| Waseca (ACQ) | 45 | 31 | 14 |
| Average: 12 mph |
| Error | Points |
| <5 mph | 4 |
| 5-8 mph | 3 |
| 9-12 mph | 2 |
| 13-16 mph | 1 |
| 17+ mph | 0 |
| Actual: 12 mph | 2 |
Probability of Detection (POD)/False Alarm Ratio (FAR)
Probability of Detection (POD) is event-based, meaning that each confirmed event is checked to see if a warning was issued and in effect at the time of the event. The national goal for winter storms is 0.90 or greater (90%).
False Alarm Rates (FAR) are computed based on warnings. For each warning issued, did an event meeting warning criteria take place? There is not a set national goal for FAR. The higher the decimal, the more counties were warned for that didn't need them.
| POD | Points | FAR | Points | |
| 0.90+ | 4 | <0.11 | 4 | |
| 0.80-0.89 | 3 | 0.11-0.20 | 3 | |
| 0.70-0.79 | 2 | 0.21-0.30 | 2 | |
| 0.60-0.69 | 1 | 0.31-0.40 | 1 | |
| <0.60 | 0 | 0.40+ | 0 | |
| Actual: 1.000 | 4 | Actual: 0.56 | 0 |
Warning lead time
Lead time is considered the amount of time between the warning issuance and when criteria is met (typically when 6 inches of snow was measured). This category is the average lead time of all the verified counties.
| Lead Time | Points |
| 20+ hours | 8 |
| 15-19 hours | 6 |
| 10-14 hours | 4 |
| 5-9 hours | 2 |
| <5 hours | 0 |
| Actual: 24.9 hours | 8 |
Impact messaging
Given the shifting forecast, it was difficult to convey the most current trends. This messaging was ineffective because many latched onto earlier forecasts for significant snowfall in the Twin Cities.
| Impact messaging | Up to 4 points |
| 1 |
 |
Media use of NWS Web News Stories is encouraged! Please acknowledge the NWS as the source of any news information accessed from this site. |
 |