Grade Summary
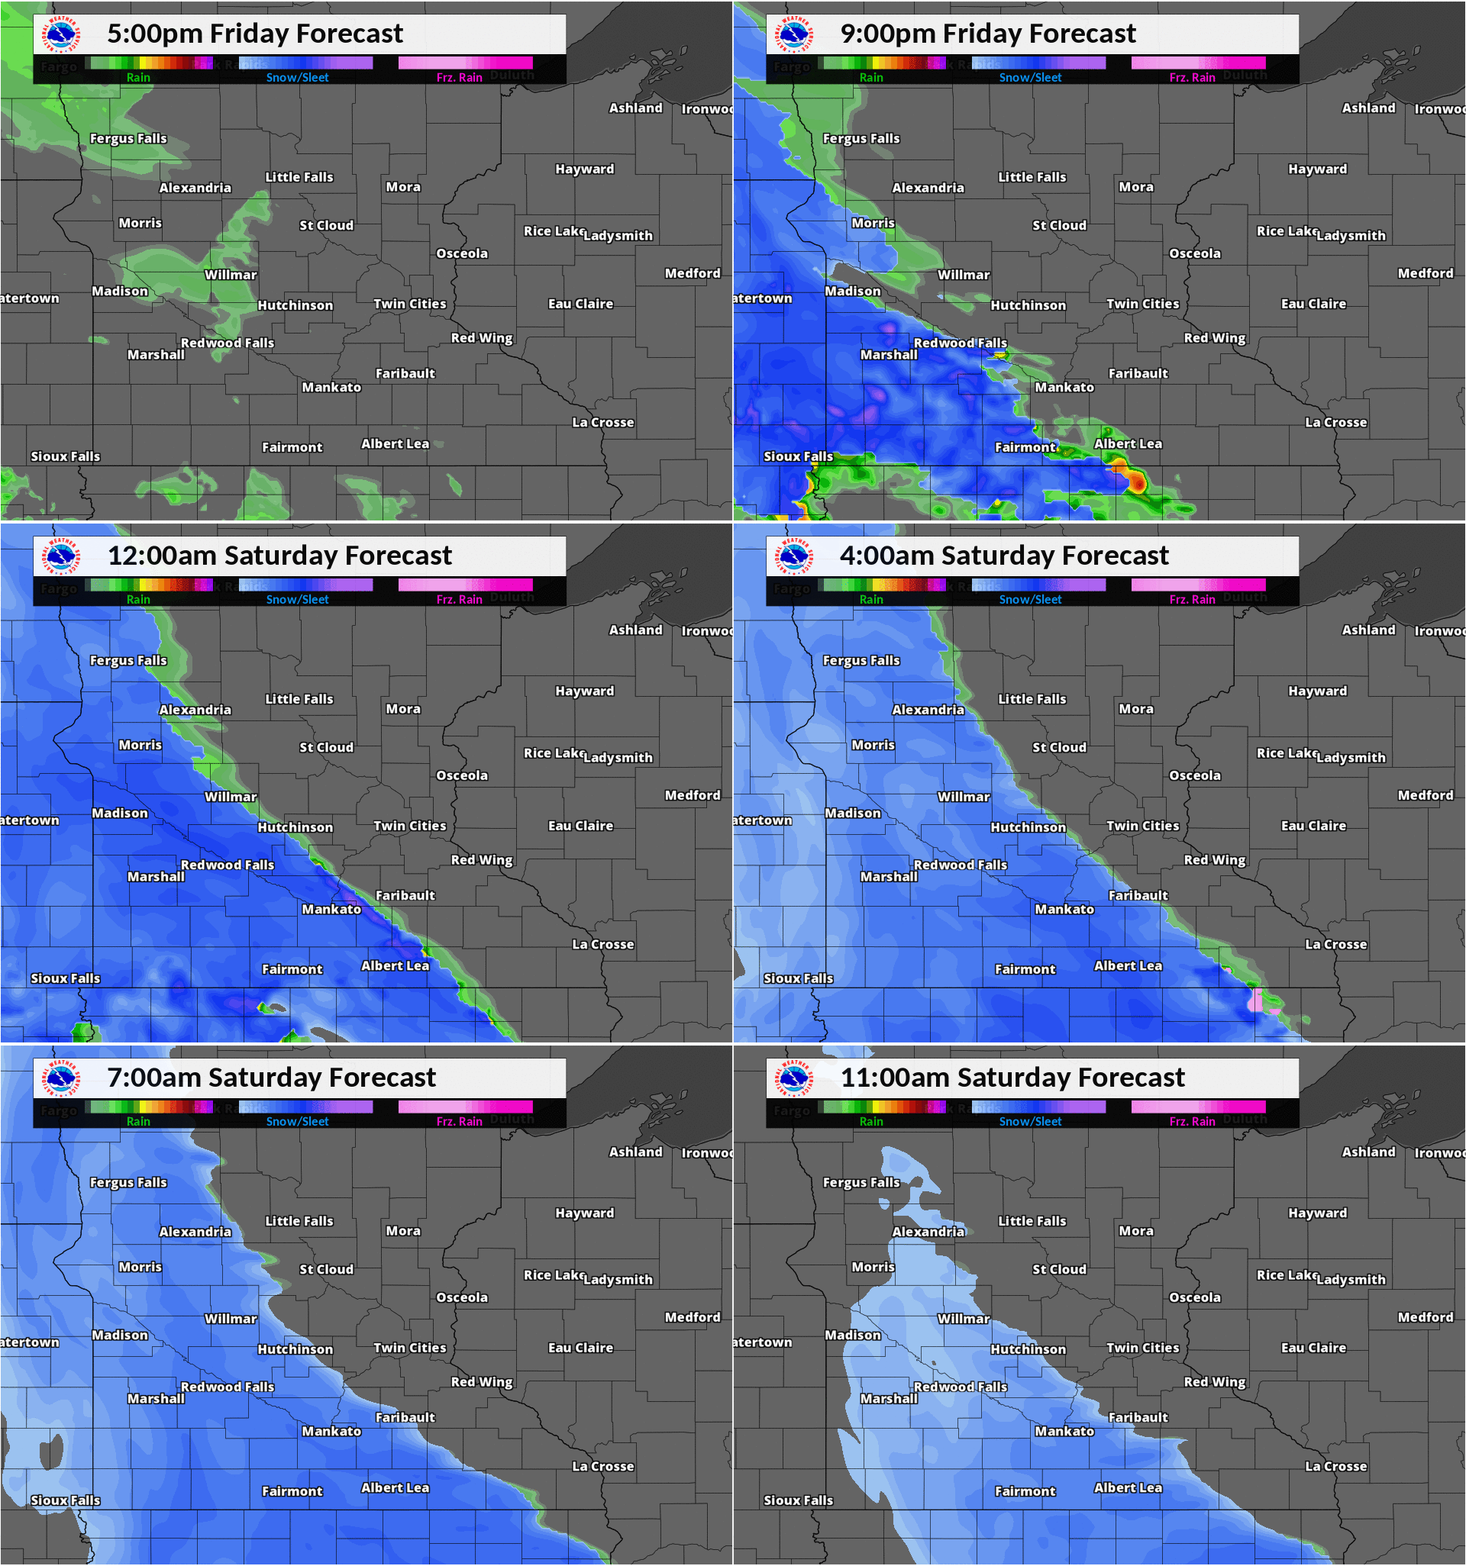
An unusually high amount of moisture (for a snow storm) was in place extending northward into southern Minnesota. In addition to the moisture, strong lift was present which allowed a very heavy band of snow to develop. Even some thunderstorms inched northward into southern Minnesota, enhancing the snowfall rates further. The band of snow didn't move much and remained largely in the same area in which it developed. To the northeast of the Minnesota River, very dry low level air was in place and prevented the snow from reaching the ground as far north as was expected, despite the deep moisture aloft. The combination of high moisture where it was snowing, very dry low level air where it wasn't, and the band not moving much produced an exceedingly tight gradient in snowfall totals. It was clear for a few days there would be such a gradient, but it proved more impressive than what we could have reasonably forecasted.
Another challenge with this system was model variability, or lack thereof. Model guidance was largely steady in the days leading up to the event with a number of them continually bringing the gradient to the Mississippi River. Winter Storm Watches were issued for areas south of the Mississippi River on the 21st. As time went on the gradient only slowly shifted south. By the evening of the 22nd, the Winter Storm Watches were upgraded to warnings, except for the Mississippi River counties due to lowering confidence there. When higher resolution models began to capture the event on the 23rd, the gradient waffled between the Minnesota River and about 40 miles north with the global models (GFS, NAM, ECMWF) maintaining a relatively similar forecast from the days prior. A few of the far northern counties were downgraded from the warning on the afternoon of the 23rd. The rest of the area was maintained under warning through the evening since it was not yet clear exactly where the band would set up. It became more evident overnight when the band ceased its northward progression that several more counties needed to be dropped from the warning.
Most of the points deducted were from the 6 inch error, onset timing, and a high FAR.
Local conditions and perceptions may vary from the objective grade calculated below. Step through the other tabs to see a breakdown of the scoring.
|
59% |
Graded Element | Possible Points | Actual Points |
| 6 inch contour error | 8 | 2 | |
| Magnitude of snow error | 8 | 6 | |
| Onset timing error | 4 | 0 | |
| Peak wind gust error | 4 | 3 | |
| Probability of Detection/False Alarm Ratio | 8 | 4 | |
| Warning lead time | 8 | 8 | |
| Impact messaging | 4 | 3 | |
| Total | 44 | 26 | |
| Grade | 59% |
6 inch contour error
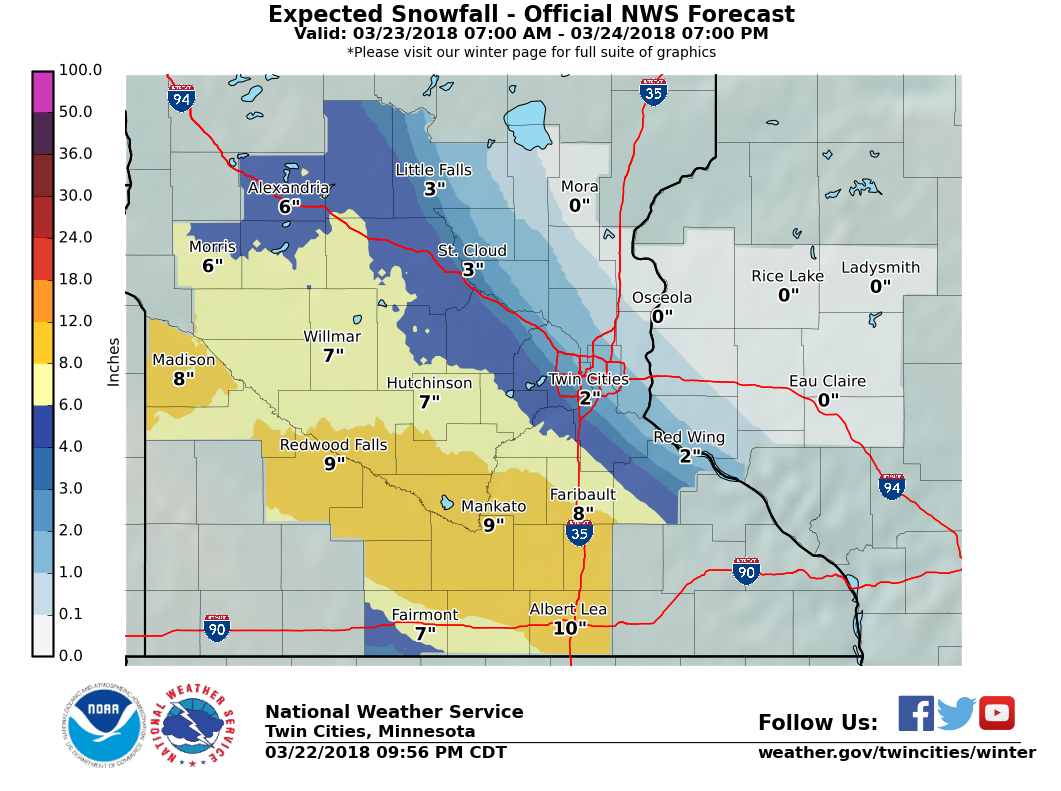
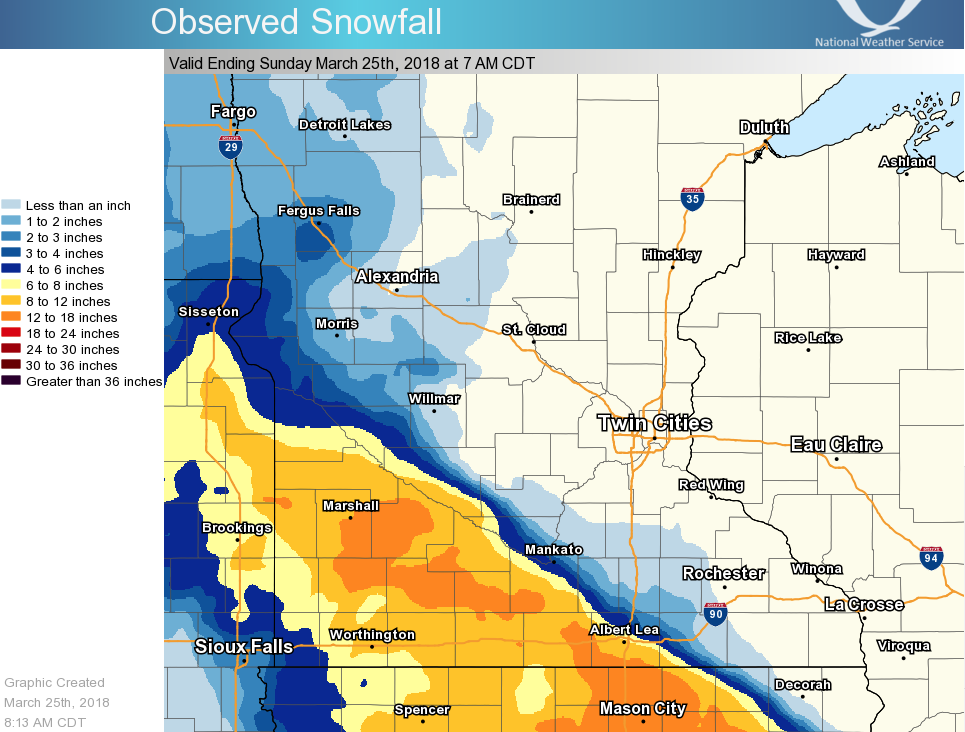
The forecasted area for 6 inches or greater was produced mainly from a blend of the models. The expectation was the higher amounts would shift closer to the 6 inch contour, as would the lower amounts as the gradient tightened over time. Warnings are issued for areas greater than 6 inches.
 |
 |
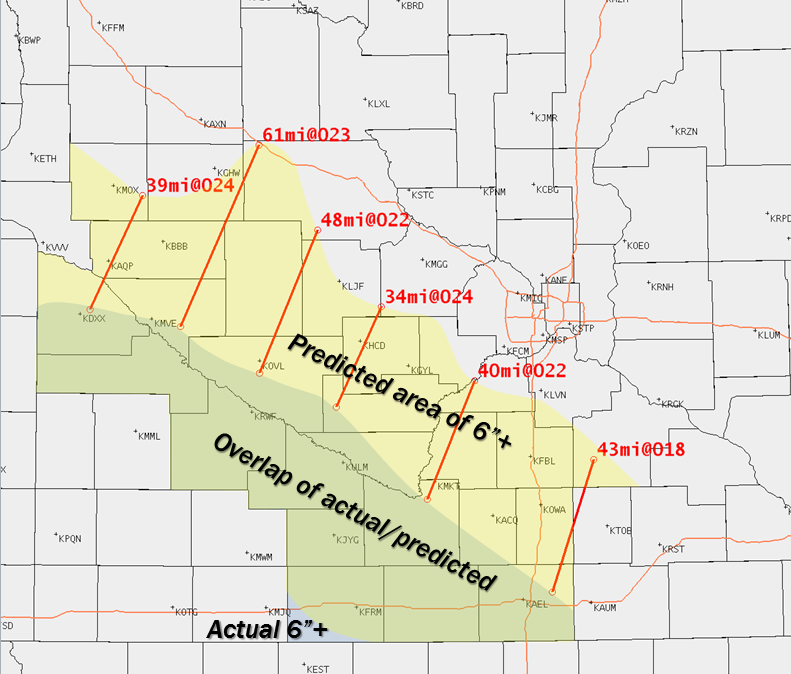 |
| Official snowfall forecast at warning issuance | Observed Snowfall | Overlap of predicted and observed 6 inch snowfall areas |
| Error | Points |
| <=15 miles | 8 |
| 16-20 miles | 7 |
| 21-25 miles | 6 |
| 26-30 miles | 5 |
| 31-35 miles | 4 |
| 36-40 miles | 3 |
| 41-45 miles | 2 |
| 46-50 miles | 1 |
| 51+ miles | 0 |
| Actual: 44 | 2 |
Magnitude of snow error
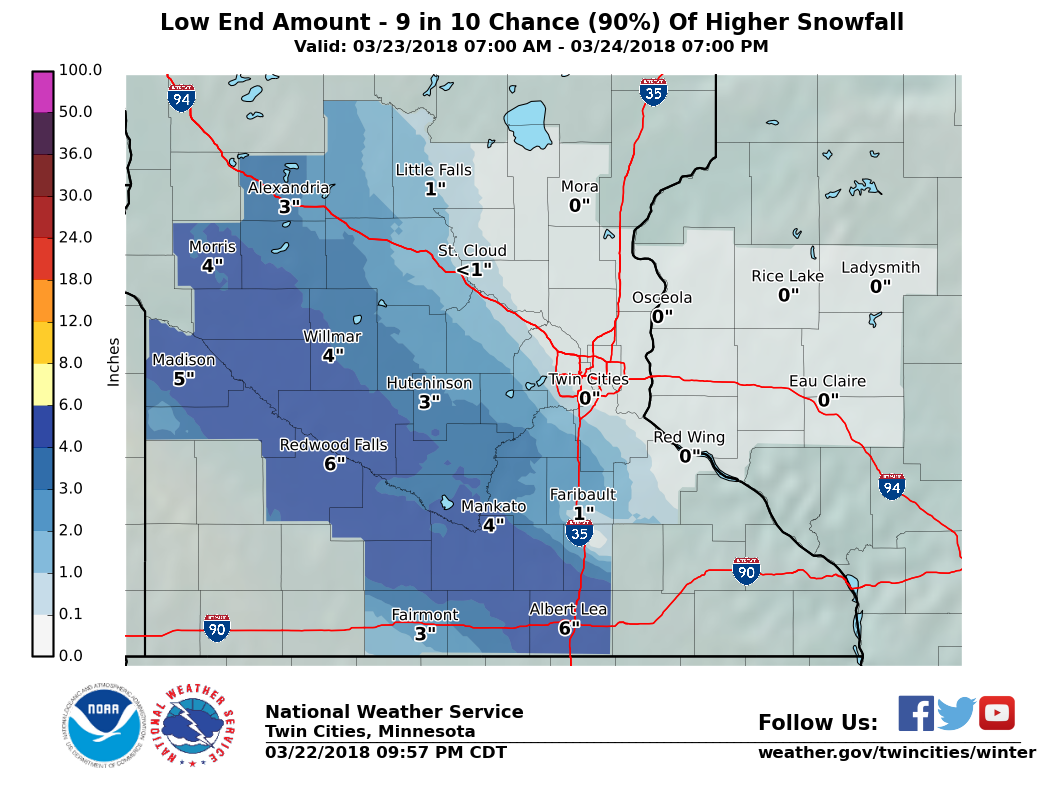
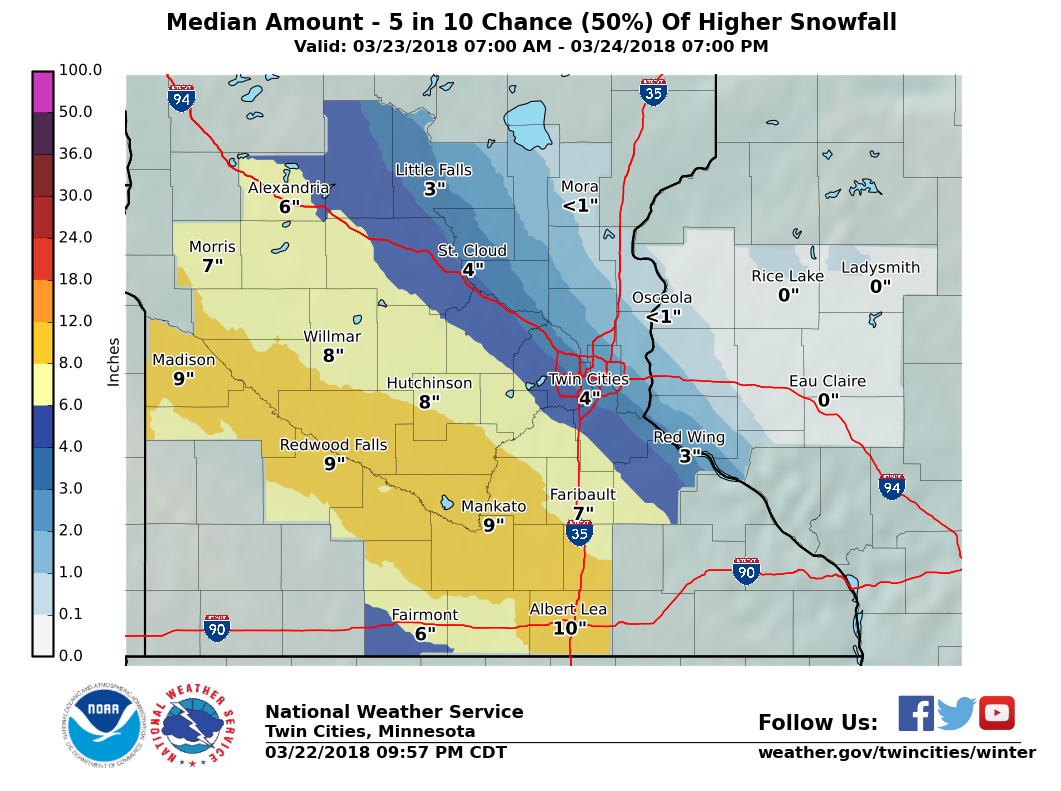
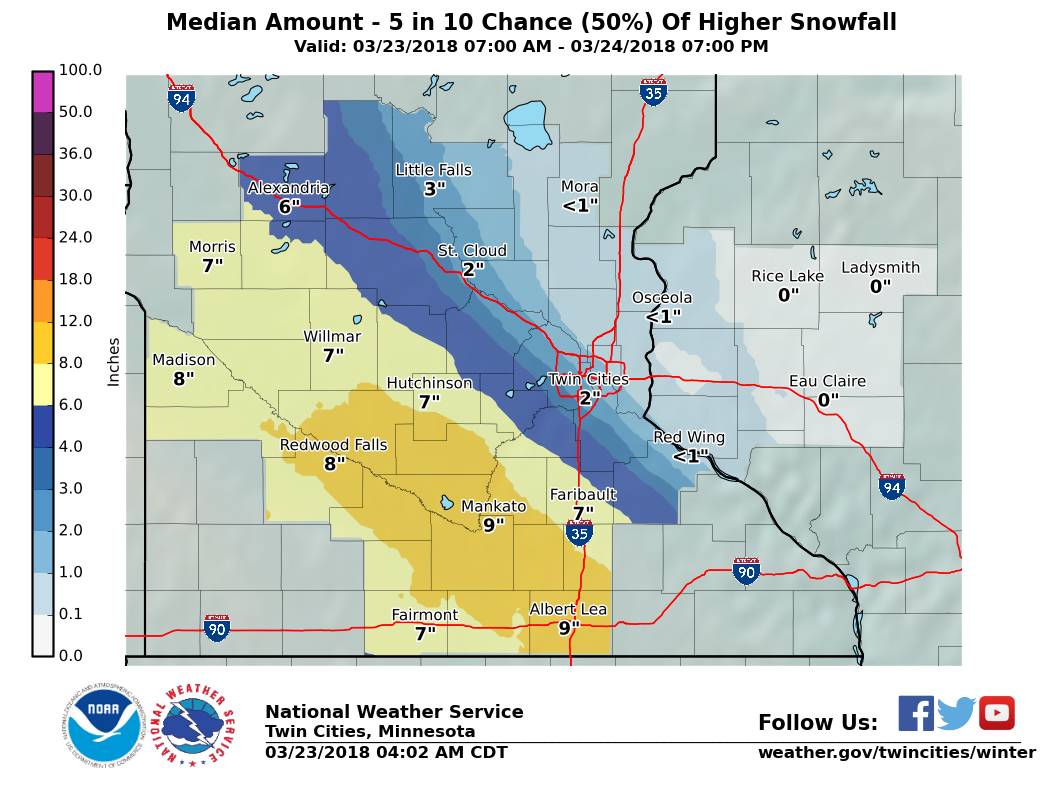
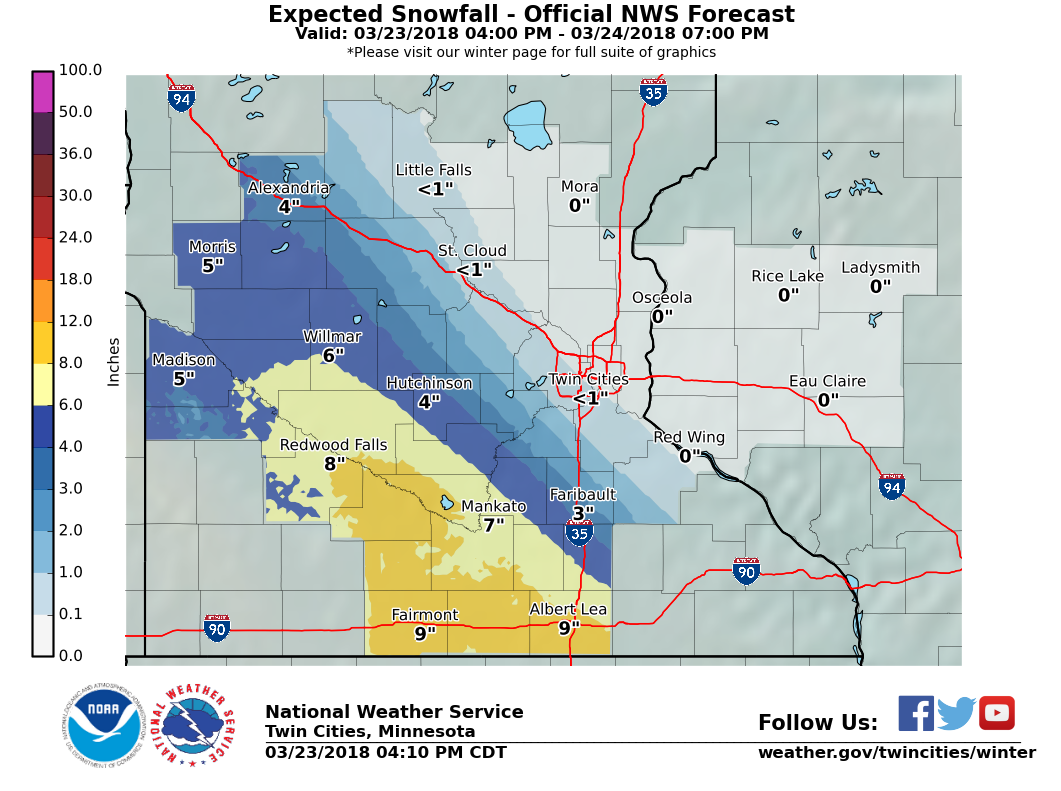
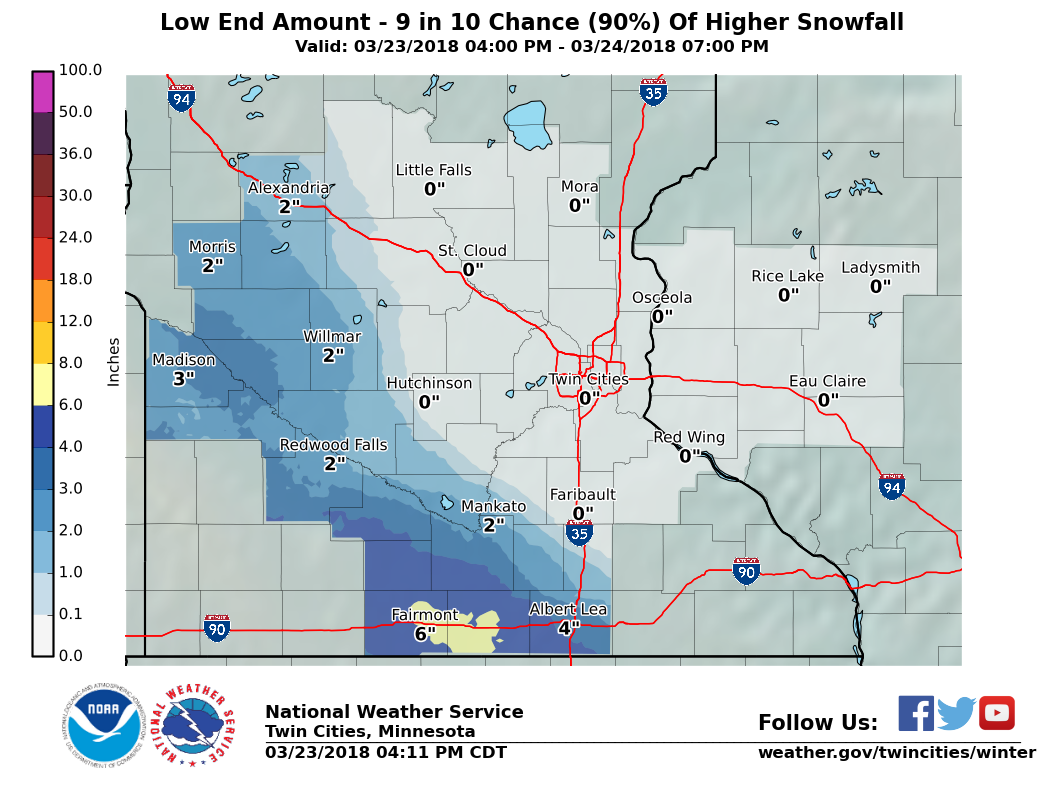
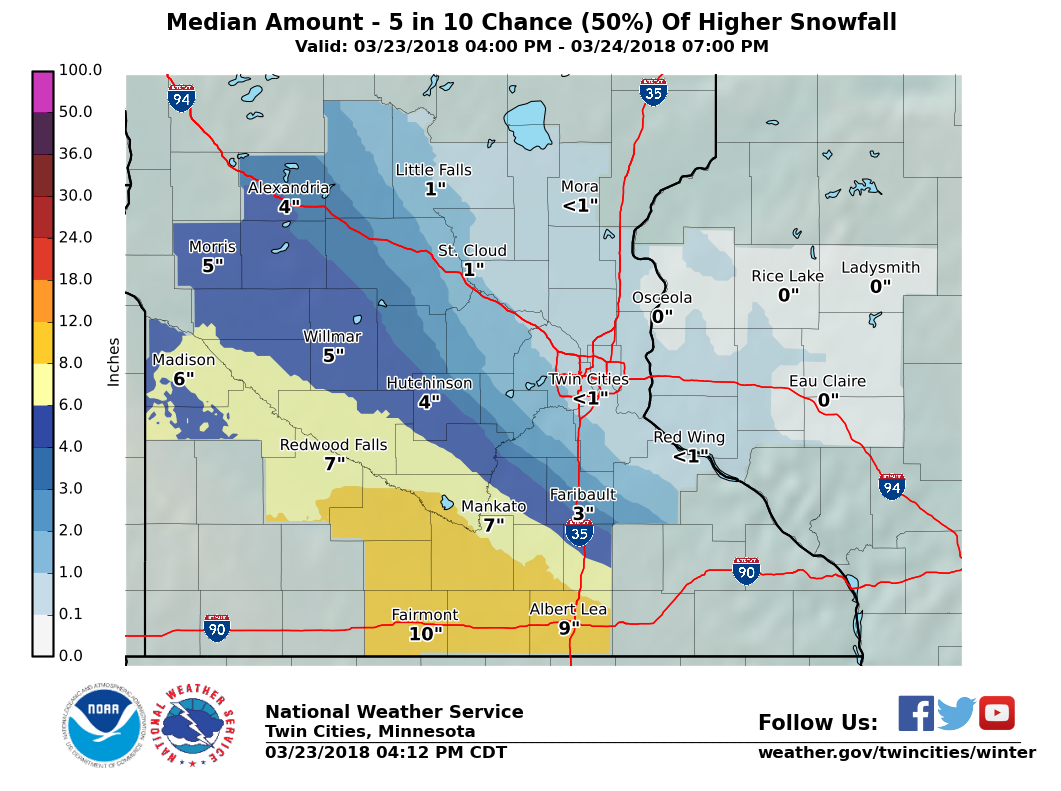
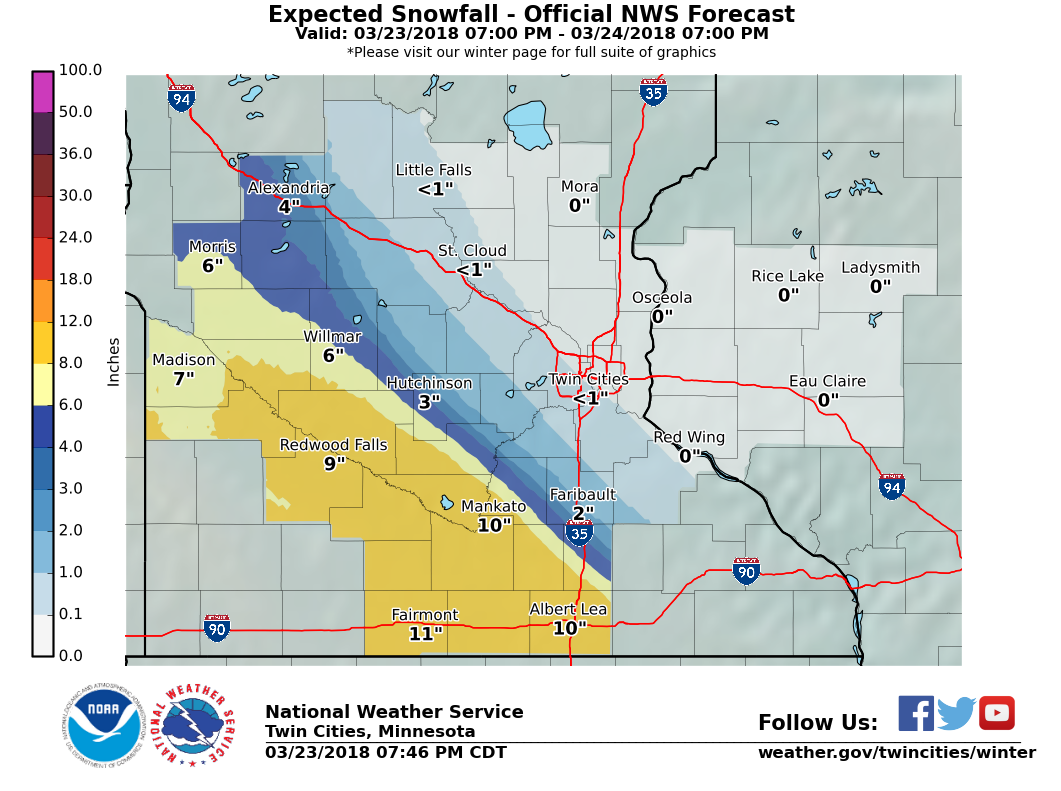
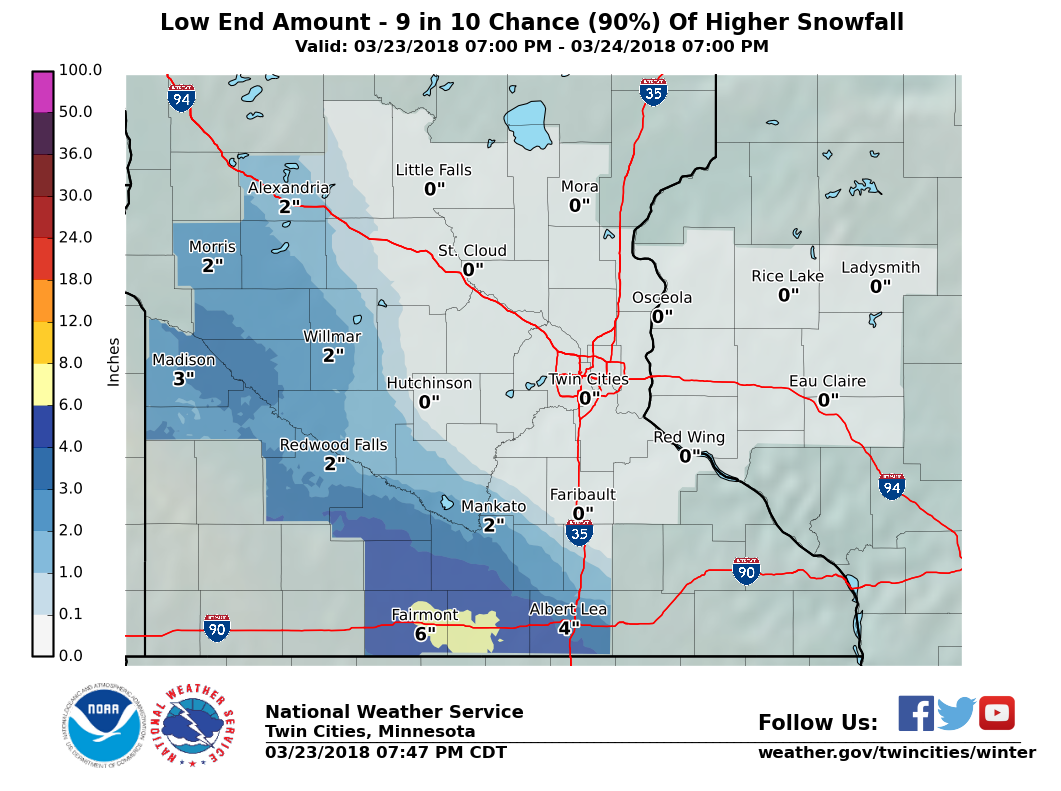
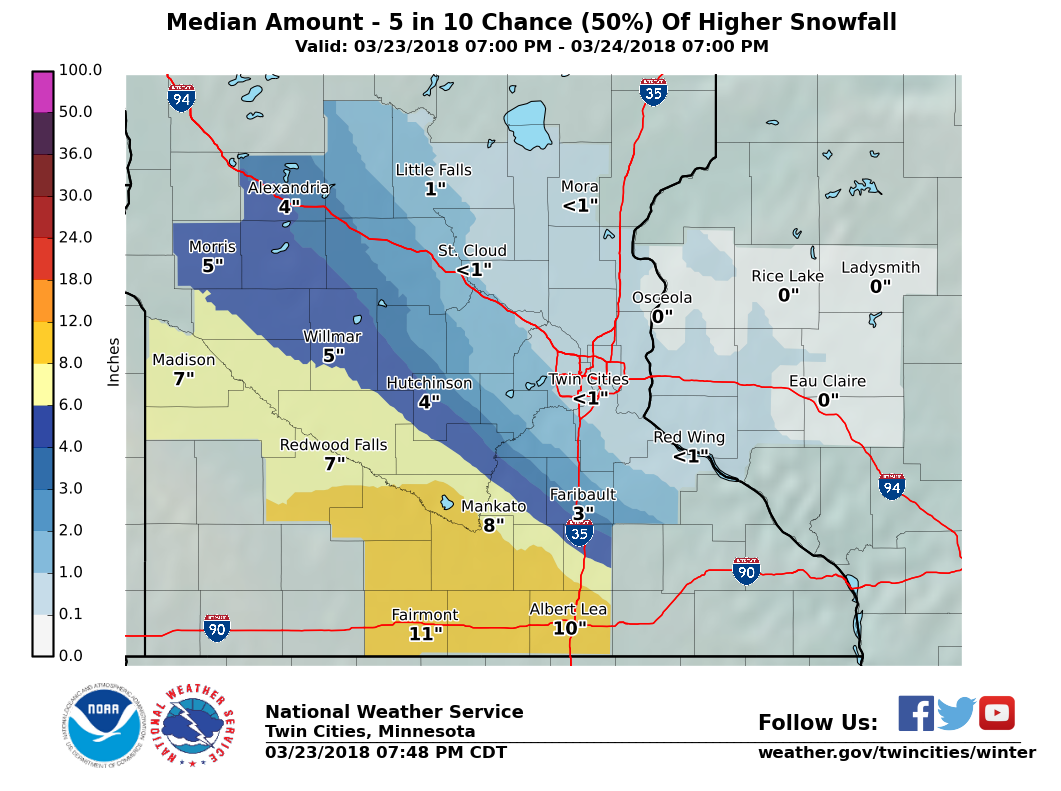
The highest amount of snow forecast was between 10 to 11 inches in scattered areas between Albert Lea and Nicollet County. The highest totals were 14.0 inches in Emmons, MN and 13.5 inches in Lucan, MN. Most totals fell into the 6 to 10 inch range. The official forecast totals mimicked the model consensus, which is why they were quite similar to the median amount (50% chance for more or less snow).
Forecast with initial warning issuance
Thursday afternoon, March 22, 2018:
 |
 |
 |
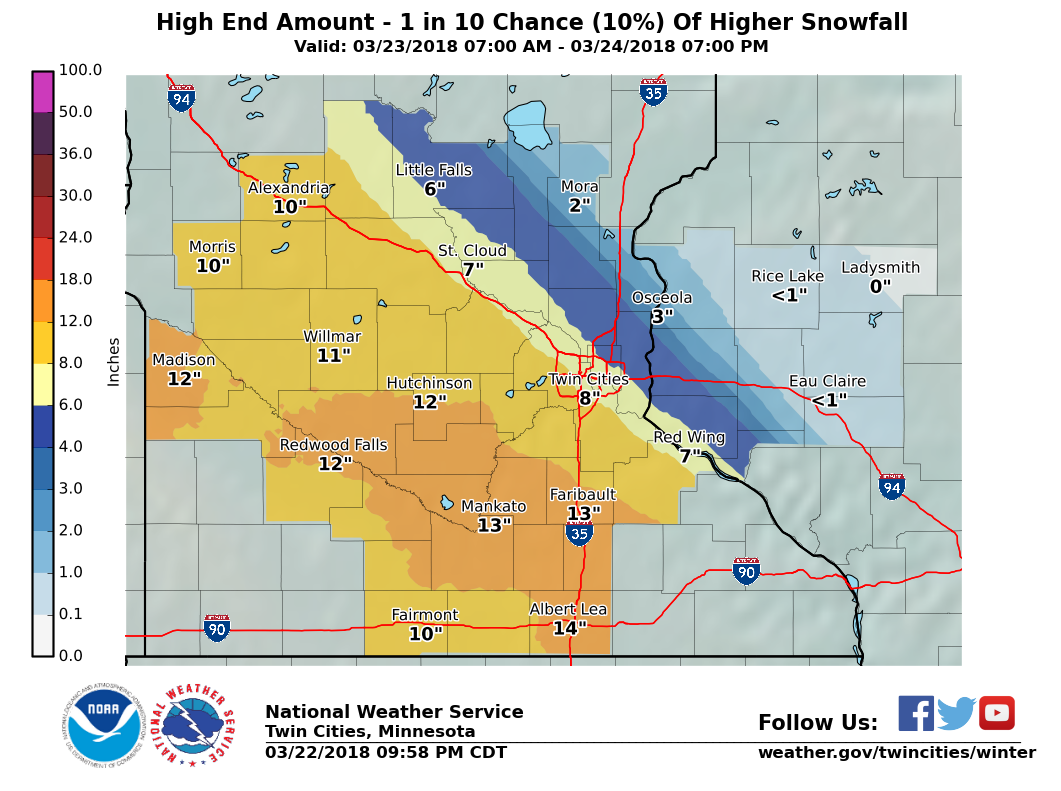 |
| Official snowfall forecast | Low end amount (90% chance for more snow than this) | Median amount (equal chances for more or less than this) | High end amount (10% chance for more snow than this) |
| Error | Points |
| <=2" | 8 |
| 2.1-3.5" | 6 |
| 3.6-5.0" | 4 |
| 5.1-6.5" | 2 |
| 6.6+" | 0 |
| Actual: 3.5" | 6 |
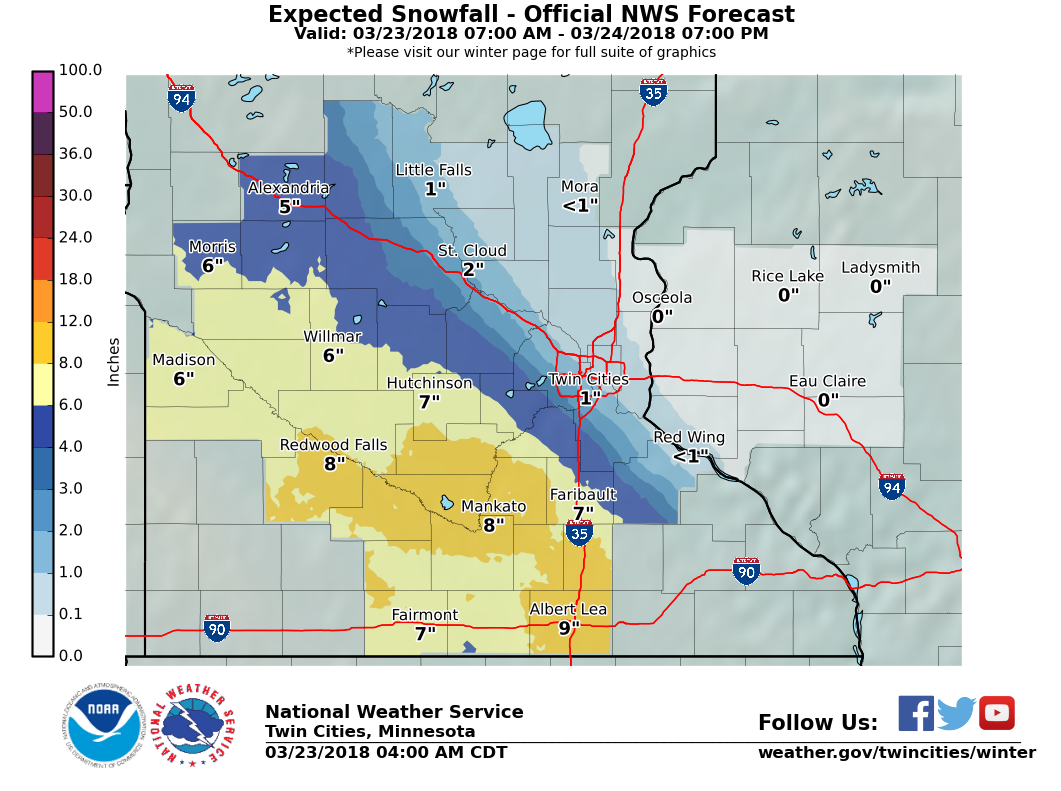
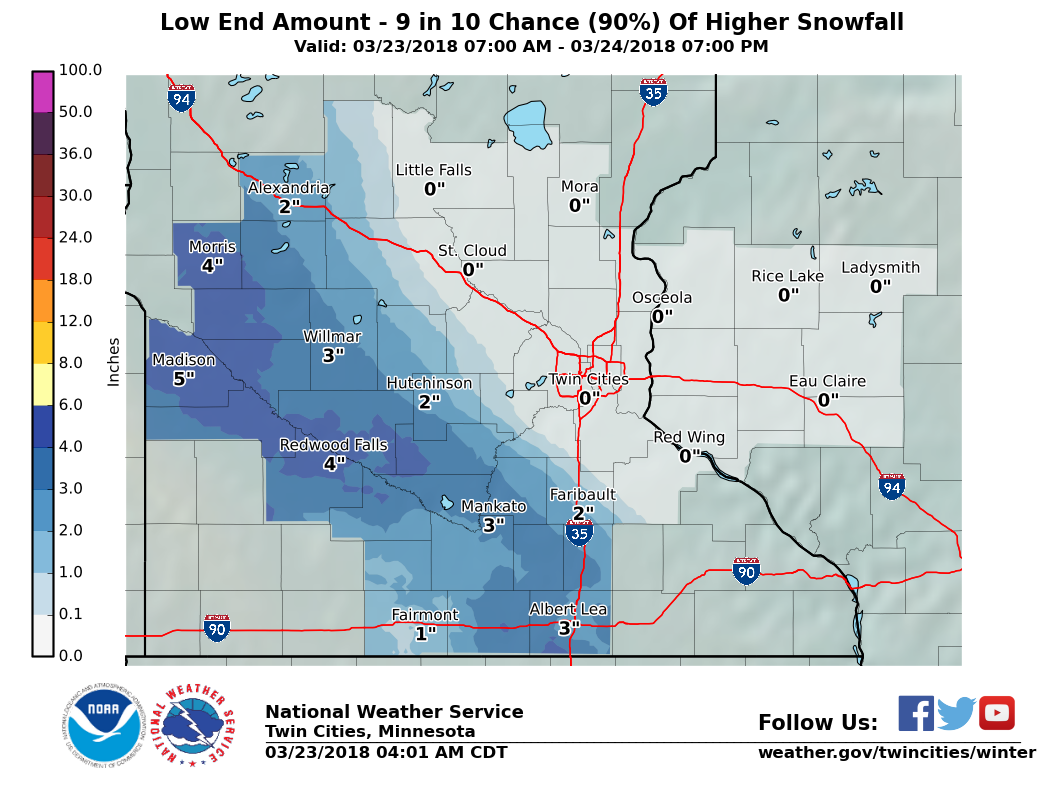
Subsequent Forecasts
Friday morning, March 23, 2018:
 |
 |
 |
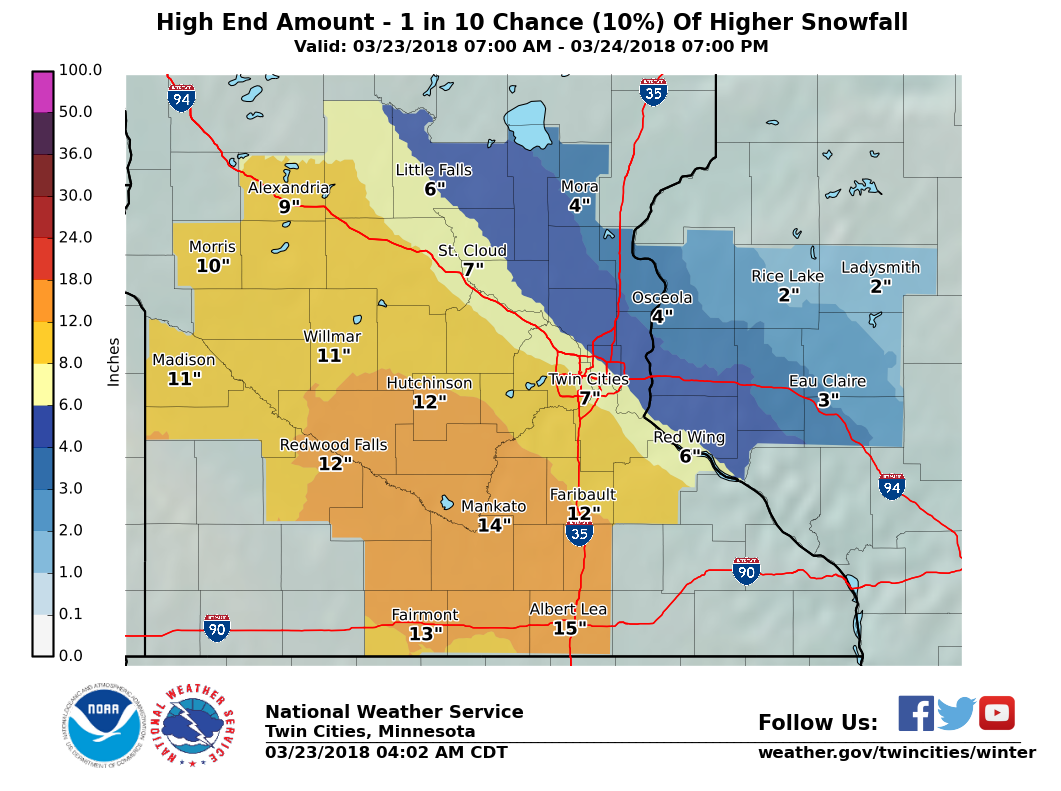 |
| Official snowfall forecast | Low end amount (90% chance for more snow than this) | Median amount (equal chances for more or less than this) | High end amount (10% chance for more snow than this) |
Friday afternoon, March 23, 2018:
 |
 |
 |
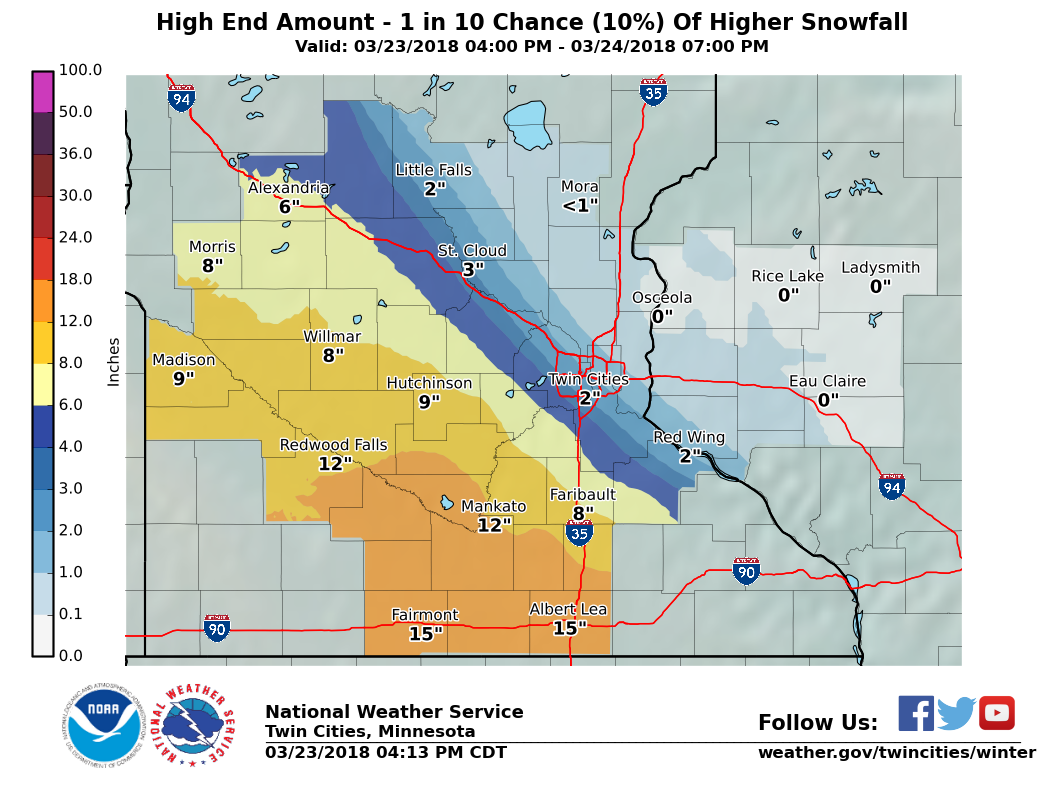 |
| Official snowfall forecast | Low end amount (90% chance for more snow than this) | Median amount (equal chances for more or less than this) | High end amount (10% chance for more snow than this) |
Friday evening, March 23, 2018:
 |
 |
 |
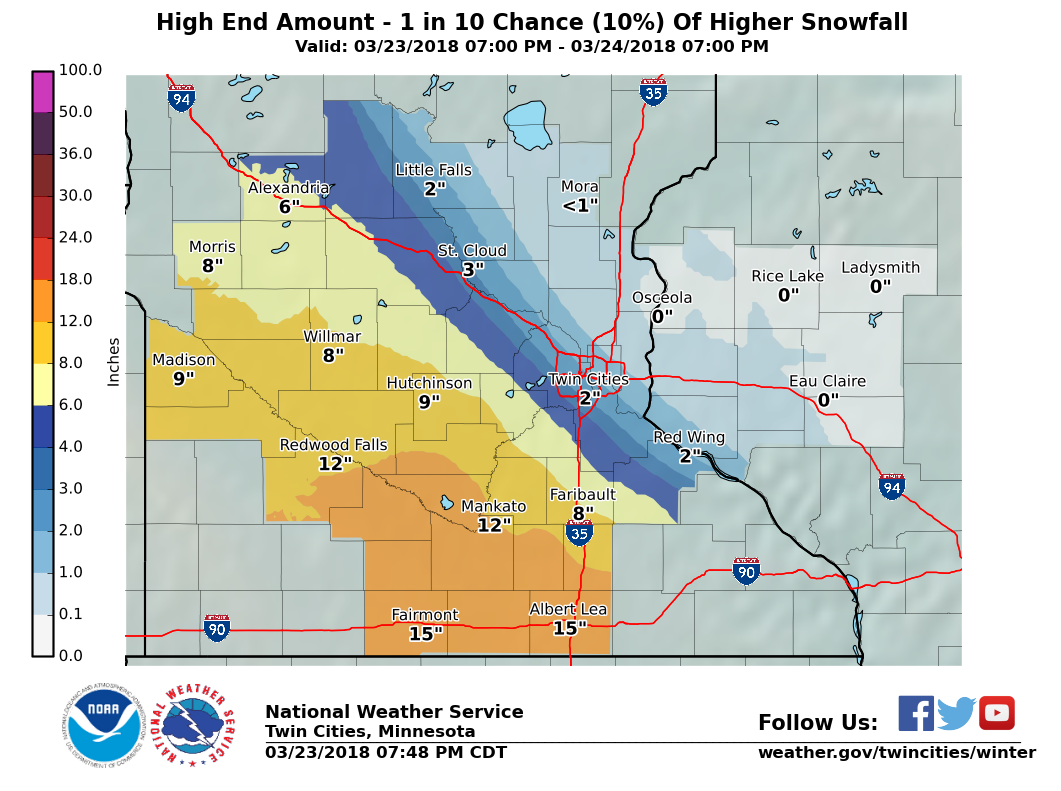 |
| Official snowfall forecast | Low end amount (90% chance for more snow than this) | Median amount (equal chances for more or less than this) | High end amount (10% chance for more snow than this) |
Snowfall reports by county:
Location                     Amount    Time/Date

...Minnesota...

...Blue Earth County...
Lake Crystal                 7.0 in    1144 AM 03/24
Mankato                      5.0 in    0500 AM 03/24
Garden City                  5.0 in    0900 AM 03/24
2 WNW Eagle Lake             2.6 in    0700 AM 03/24
1 ENE Mankato                2.5 in    0630 AM 03/24

...Brown County...
6 NNW Sveadahl               9.7 in    0730 AM 03/25
Sveadahl 5NNW                9.7 in    0730 AM 03/25
Springfield 1NW              8.5 in    0700 AM 03/25
2 NNW Springfield            8.5 in    0700 AM 03/25
1 SW Sleepy Eye              8.3 in    0800 AM 03/24

...Chippewa County...
Montevideo                   6.5 in    0700 AM 03/25
1 WNW Milan                  3.0 in    0600 PM 03/24
Milan 1NW                    3.0 in    0600 PM 03/24

...Faribault County...
Winnebago                    12.0 in   0700 AM 03/25
1 E Blue Earth               11.0 in   0700 AM 03/25
Blue Earth                   11.0 in   0700 AM 03/25
2 WSW Bricelyn               10.1 in   0700 AM 03/25
Bricelyn                     10.1 in   0700 AM 03/25
1 SSE Blue Earth             9.9 in    0800 AM 03/25
Blue Earth 1S                9.9 in    0800 AM 03/25
1 E Blue Earth               8.0 in    0700 AM 03/24
Wells                        6.0 in    0845 AM 03/24

...Freeborn County...
Emmons                       14.0 in   0900 AM 03/24
Albert Lea                   10.0 in   1130 AM 03/24
8 NE Myrtle                  5.8 in    0238 PM 03/24

...Lac qui Parle County...
2 SW Montevideo              5.0 in    0700 AM 03/25
Dawson                       5.0 in    0700 AM 03/24
Montevideo 1SW               5.0 in    0700 AM 03/25

...Martin County...
Welcome                      10.0 in   0900 AM 03/24
Fairmont                     7.0 in    0649 AM 03/24

...Nicollet County...
3 ESE New Ulm                6.7 in    0606 AM 03/25
1 WSW North Mankato          4.0 in    0741 AM 03/24

...Redwood County...
Lucan                        13.5 in   0900 AM 03/24
1 NE Redwood Falls           9.6 in    0530 AM 03/24
Vesta                        9.0 in    1200 PM 03/24
Sanborn                      8.0 in    0647 AM 03/24

...Renville County...
Franklin                     10.0 in   0900 AM 03/24
7 SSE Bird Island            1.7 in    0700 AM 03/24

...Steele County...
Ellendale                    4.2 in    0700 AM 03/25

...Watonwan County...
St. James                    11.0 in   1136 AM 03/24

Observations are collected from a variety of sources with varying
equipment and exposures. We thank all volunteer weather observers
for their dedication. Not all data listed are considered official.
Onset timing error
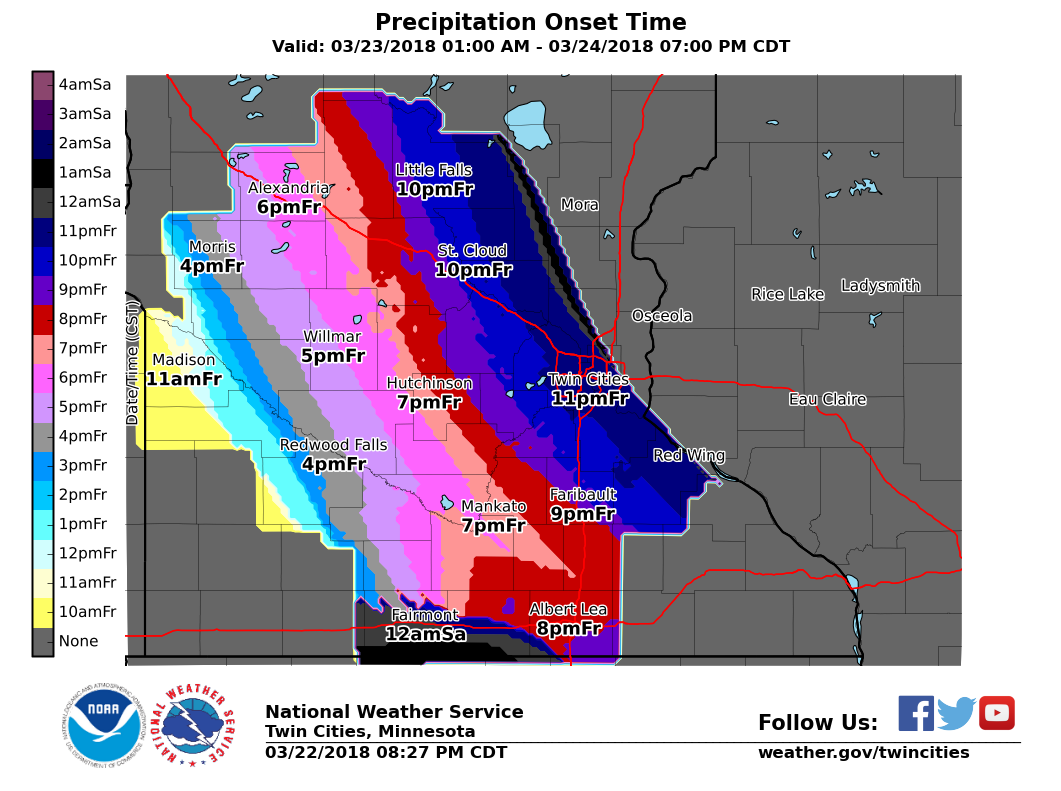
The time visibility falls to less than 3 miles due to snow is noted for each warned weather station at an airport. This is considered the time accumulations and impacts begin. It is checked against the time snow becomes likely in the forecast when the initial warning is issued and the difference is calculated.
In this case, snow began much later than predicted. The dry air won out initially and kept precipitation from developing until several hours later.
| Warned Airport Weather Station | Expected time accumulating snow becomes likely | Actual time visibility fell to less than 3 miles due to snow | Error (hh:mm) |
| Albert Lea (AEL) | 8:00 pm | 11:35 pm | 3:35 |
| Alexandria (AXN) | 6:00 pm | 5:10 (24th) | 11:10 |
| Appleton (AQP) | 2:00 pm | 3:32 am (24th) | 13:32 |
| Benson (BBB) | 4:00 pm | 5:55 am (24th) | 13:55 |
| Canby (CNB) | 10:00 am | 10:59 pm | 12:59 |
| Fairmont (FRM) | 12:00 am (24th) | 10:58 pm | 1:02 |
| Faribault (FBL) | 9:00 pm | Didn't occur | |
| Glencoe (GYL) | 8:00 pm | Didn't occur | |
| Glenwood (GHW) | 6:00 pm | Didn't occur | |
| Granite Falls (GDB) | 3:00 pm | 10:56 pm | 7:56 |
| Hutchinson (HCD) | 7:00 pm | Didn't occur | |
| Litchfield (LJF) | 7:00 pm | Didn't occur | |
| Madison (DXX) | 11:00 am | 12:35 am (24th) | 13:35 |
| Mankato (MKT) | 7:00 pm | 1:26 am (24th) | 6:26 |
| Montevideo (MVE) | 3:00 pm | 12:55 am (24th) | 9:55 |
| Morris (MOX) | 4:00 pm | 10:55 pm | 6:55 |
| New Ulm (ULM) | 5:00 pm | 11:15 pm | 6:15 |
| Olivia (OVL) | 3:00 pm | 12:55 am (24th) | 9:55 |
| Owatonna (OWA) | 8:00 pm | Didn't occur | |
| Redwood Falls (RWF) | 4:00 pm | 10:33 pm | 6:33 |
| St. James (JYG) | 5:00 pm | 10:35 pm | 5:35 |
| Waseca (ACQ) | 7:00 pm | 1:35 am (24th) | 6:35 |
| Willmar (BDH) | 5:00 pm | Didn't occur | |
| Average: 8:29 |
| Error | Points |
| <1 hr | 4 |
| 1-2 hr | 3 |
| 2-3 hr | 2 |
| 3-4 hr | 1 |
| 4+ hr | 0 |
| Actual: 8:29 | 0 |
Peak wind gust error
Wind gusts of 40 mph were predicted throughout the warned areas. The forecast was generally too high.
| Warned Airport Weather Station |
Expected peak wind gusts (mph) |
Actual peak wind gust (mph) |
Error (mph) |
| Albert Lea (AEL) | 40 | 33 | 7 |
| Alexandria (AXN) | 40 | 38 | 2 |
| Appleton (AQP) | 40 | 31 | 9 |
| Benson (BBB) | 40 | 29 | 11 |
| Canby (CNB) | 35 | 28 | 7 |
| Fairmont (FRM) | 40 | 43 | 3 |
| Faribault (FBL) | 40 | 28 | 12 |
| Glencoe (GYL) | 40 | 26 | 14 |
| Glenwood (GHW) | 40 | 32 | 8 |
| Granite Falls (GDB) | 35 | 29 | 6 |
| Hutchinson (HCD) | 40 | 25 | 15 |
| Litchfield (LJF) | 40 | 29 | 11 |
| Madison (DXX) | 35 | 31 | 4 |
| Mankato (MKT) | 40 | 33 | 7 |
| Montevideo (MVE) | 40 | 32 | 8 |
| Morris (MOX) | 40 | 37 | 3 |
| New Ulm (ULM) | 40 | 31 | 9 |
| Olivia (OVL) | 40 | 26 | 14 |
| Owatonna (OWA) | 40 | 30 | 10 |
| Redwood Falls (RWF) | 40 | 35 | 6 |
| St. James (JYG) | 40 | 26 | 14 |
| Waseca (ACQ) | 40 | 35 | 6 |
| Willmar (BDH) | 40 | 29 | 11 |
| Average: 8 mph |
| Error | Points |
| <5 mph | 4 |
| 5-8 mph | 3 |
| 9-12 mph | 2 |
| 13-16 mph | 1 |
| 17+ mph | 0 |
| Actual: 8 mph | 3 |
Probability of Detection (POD)/False Alarm Ratio (FAR)
Probability of Detection (POD) is event-based, meaning that each confirmed event is checked to see if a warning was issued and in effect at the time of the event. The national goal for winter storms is 0.90 or greater (90%).
False Alarm Rates (FAR) are computed based on warnings. For each warning issued, did an event meeting warning criteria take place? There is not a set national goal for FAR. The higher the decimal, the more counties were warned for that didn't need them.
With this event, warnings were issued for all counties that had greater than 6 inches so POD was perfect. FAR was high because half the counties warned did not reach warning criteria due to the band shifting south.
| POD | Points | FAR | Points | |
| 0.90+ | 4 | <0.11 | 4 | |
| 0.80-0.89 | 3 | 0.11-0.20 | 3 | |
| 0.70-0.79 | 2 | 0.21-0.30 | 2 | |
| 0.60-0.69 | 1 | 0.31-0.40 | 1 | |
| <0.60 | 0 | 0.40+ | 0 | |
| Actual: 1.0 | 4 | Actual: 0.54 | 0 |
Warning lead time
Lead time is considered the amount of time between the warning issuance and when criteria is met (typically when 6 inches of snow was measured or less snow with a wintry mix). This category is the average lead time of all the verified counties and unwarned counties.
| Lead Time | Points |
| 20+ hours | 8 |
| 15-19 hours | 6 |
| 10-14 hours | 4 |
| 5-9 hours | 2 |
| <5 hours | 0 |
| Actual: more than 24 hours | 8 |
Impact messaging
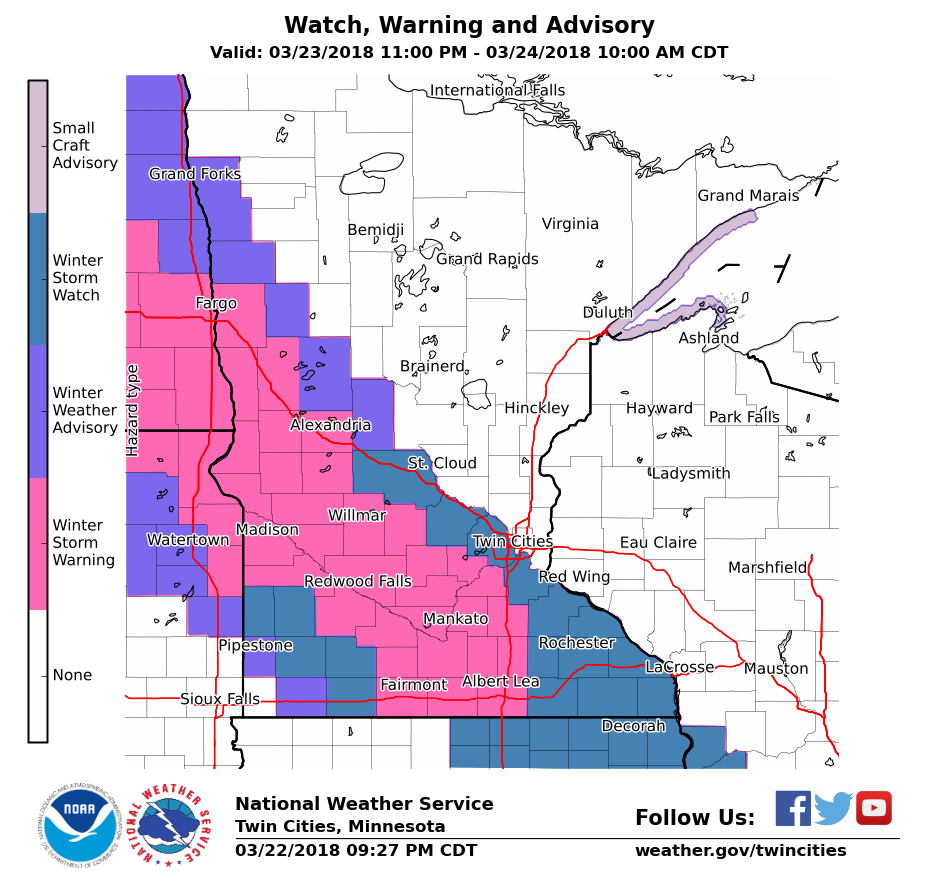
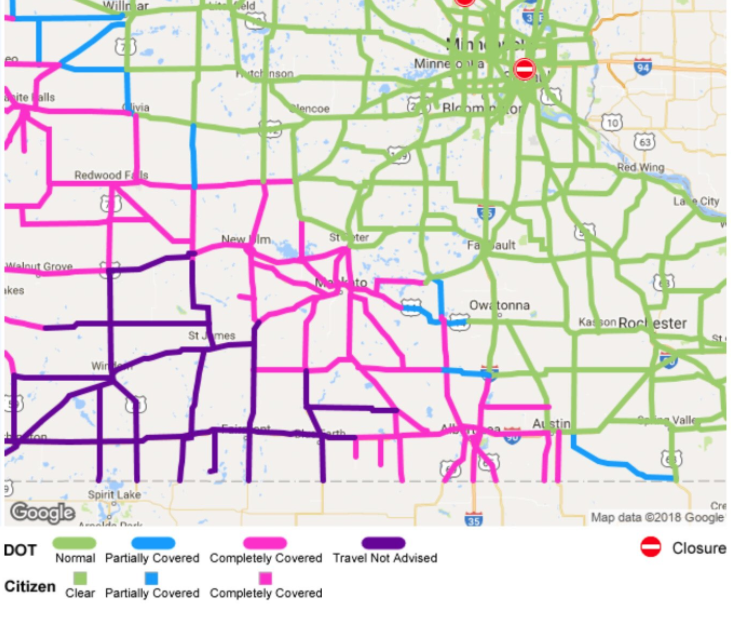
The main message was uncertainty regarding the location of the snowfall gradient and vastly different conditions expected on either side of it. Since the storm occurred overnight on a weekend, impacts were minor overall. However, MnDOT advised no travel across southwest and portions of south central Minnesota during the height of the storm when 2 inch per hour rates were occurring. A point was deducted for not conveying the possibility of a bigger shift in the snow band.
 |
 |
 |
 |
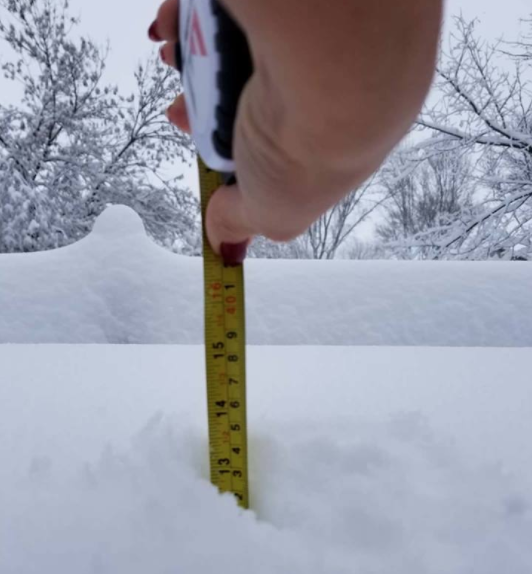 |
| Watches, warnings, and advisories in effect on the evening of March 22nd. | Graphic issued during the evening of March 23rd showed continued model support for a more northerly track even as the event was unfolding. | Radar loop of the storm. | Travel conditions late afternoon, March 5th. | Snow measurement from Lucan, MN (Redwood County) showing 13.5 inches had fallen. |
| Impact messaging | Up to 4 points |
| Impacts were clearly conveyed and partners responded accordingly. Positive feedback was received. | 4 |
| Overall, impacts were conveyed well, but some impacts were over or underestimated. Mostly positive feedback was received. | 3 |
| Impacts could have been more clearly stated. Feedback was mixed. | 2 |
| Impacts were not clearly defined. Mostly negative feedback was received. | 1 |
| Impacts were opposite of what was forecast. Feedback was negative. | 0 |
| 3 |
 |
Media use of NWS Web News Stories is encouraged! Please acknowledge the NWS as the source of any news information accessed from this site. |
 |