Flood Outlook - updated March 12, 2026.
Key Points
Briefing Slides for Southern Wisconsin - Final update for the season
Spring Flood Outlook Story Map for the entire Upper Midwest River Basin.
Seasonal Flood Outlook Graphics (select site on map, select 'Full Gauge Page' on top of hydrograph, then scroll down)
Flood Risk Factors
Current Conditions (images auto update and conditions may differ from when the spring flood outlook was issued)
Link to Realtime Streamflow
Link to Frost Depth
Link to Soil Temperature
|
Snow Water Equivalent (inches) |
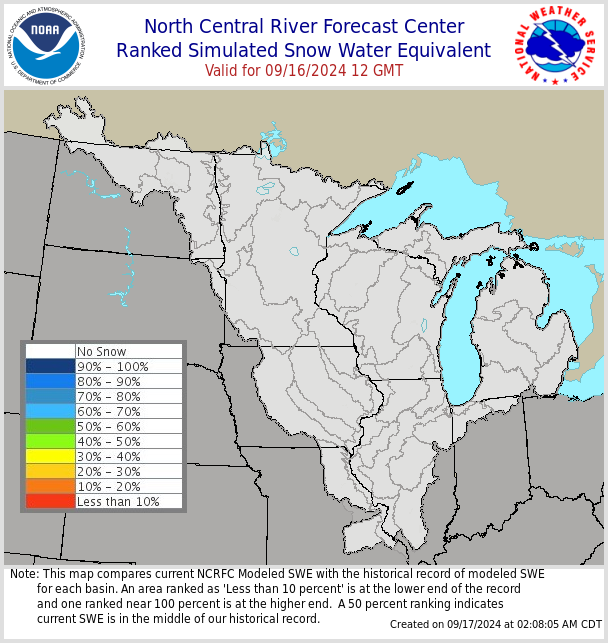
Ranked Snow Water Equivalent |
Soil Moisture Percentile Climate Prediction Center |
 |
||
| 30 Day Precipitation Departure From Normal | 4 Month Precipitation Departure from Normal | U.S. Drought Monitor |
 |
 |
 |

Looking Ahead (images auto update and may differ from when the outlook was issued)
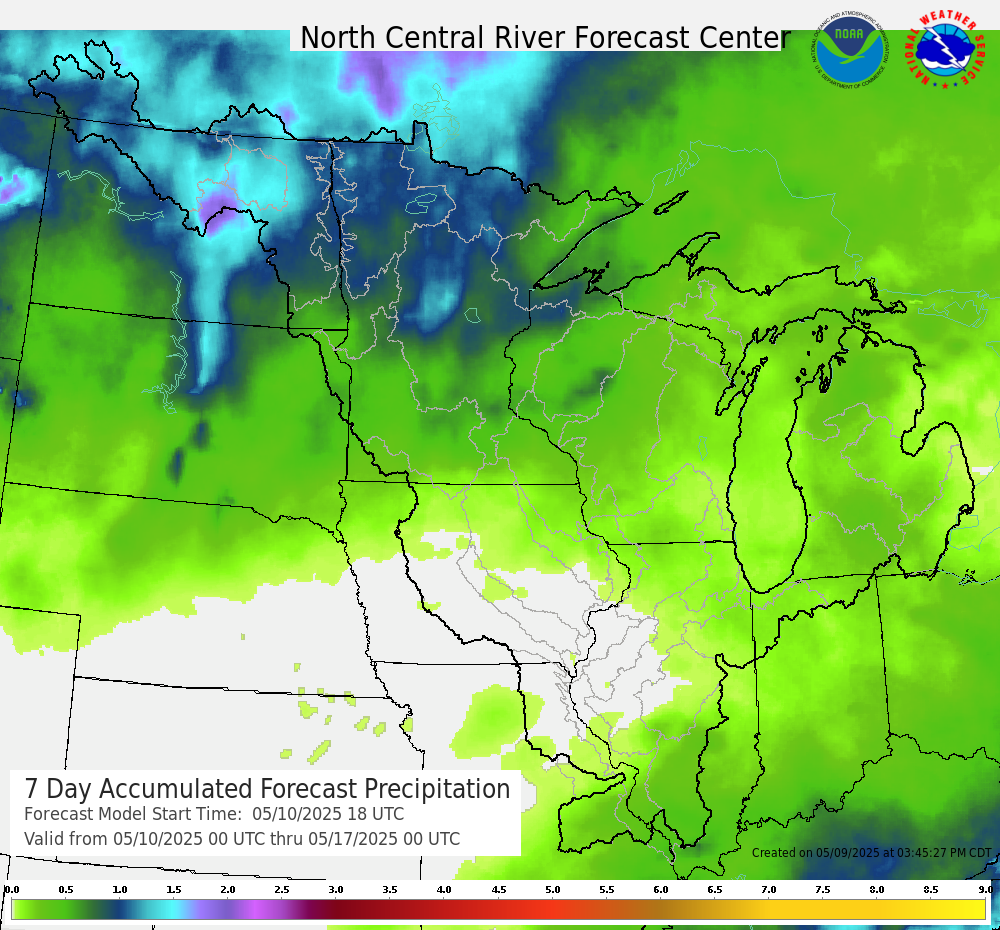
| 7 Day Precipitation Forecast |
 |
Extended outlooks from the Climate Prediction Center:
 |
 |
 |
 |
 |
 |
How To Prepare & Safety
Preparedness/Early Actions:
How To Stay Safe During a Flood:
Flood Outlooks
Long Range Outlooks
Weekly Probability of Exceeding Flood Stage by Location. More information is here.
 |
|
 |
|
| Fox River at Princeton | Fox River at Princeton | Fox River at Berlin | Fox River at Berlin |
 |
|
 |
|
| WI River at WI Dells | WI River at WI Dells | WI River at Portage | WI River at Portage |
 |
|
 |
|
| Baraboo R at Reedsburg | Baraboo R at Reedsburg | Baraboo R at Rock Springs | Baraboo R at Rock Springs |
 |
 |
 |
|
| Baraboo R at West Baraboo | Baraboo R at West Baraboo | Baraboo R at Baraboo | Baraboo R at Baraboo |
 |
|
 |
|
| Black Earth Creek at Black Earth | Black Earth Creek at Black Earth | Pecatonica R at Blanchardville | Pecatonica R at Blanchardville |
 |
|
 |
|
| Pecatonica R at Darlington | Pecatonica R at Darlington | Pecatonica R at Martintown | Pecatonica R at Martintown |
 |
|
|
|
| Sugar River at Albany | Sugar River at Albany | Sugar River at Brodhead | Sugar River at Brodhead |
 |
|
 |
|
| Crawfish River at Milford | Crawfish River at Milford | Rock River at Watertown | Rock River at Watertown |
 |
|
 |
|
| Rock River at Jefferson | Rock River at Jefferson | Rock River at Fort Atkinson | Rock River at Fort Atkinson |
 |
|
 |
|
| Rock R at Lake Koshkonong | Rock R at Lake Koshkonong | Rock River at Afton | Rock River at Afton |
 |
|
 |
|
| Turtle Creek at Clinton | Turtle Creek at Clinton | Sheboygan R at Sheboygan | Sheboygan R at Sheboygan |
 |
|
 |
|
| Cedar Creek at Cedarburg | Cedar Creek at Cedarburg | Milwaukee R at Cedarburg | Milwaukee R at Cedarburg |
 |
|
 |
|
| Fox River at Waukesha | Fox River at Waukesha | Fox River at New Munster | Fox River at New Munster |
 |
|
 |
|
| Root River at Franklin | Root River at Franklin | Root River Canal near Raymond | Root River Canal near Raymond |
 |
|
||
| Root River at Racine | Root River at Racine |
Interpreting 3 Month Outlooks


If you have any questions or comments about this spring flood outlook or river forecasts please contact:
Sarah Marquardt
Senior Service Hydrologist
National Weather Service Milwaukee
sarah.marquardt@noaa.gov
 |
Media use of NWS Web News Stories is encouraged! Please acknowledge the NWS as the source of any news information accessed from this site. |
|

