
Severe thunderstorms will be possible over parts of the northern Plains today through Thursday which could bring large hail, damaging winds, and possible tornadoes. Thunderstorms with heavy to excessive rainfall may continue to produce flooding over parts of the southern and northern Plains today. Read More >
Despite the recent bitter cold spell, the year 2017 wrapped up as one of the top 10 warmest on record in Milwaukee. The average temperature was 50.6 degrees, which was 2.7 degrees above the annual normal. This was the 6th warmest year on record.
| Rank | Year | MKE Average Temperature |
| 1 | 2012 | 51.9 |
| 1 | 1931 | 51.9 |
| 3 | 1998 | 50.9 |
| 4 | 2016 | 50.8 |
| 5 | 1921 | 50.7 |
| 6 | 2017 | 50.6 |
| 7 | 2010 | 50.3 |
| 8 | 1987 | 50.2 |
| 9 | 2006 | 50.0 |
| 9 | 1991 | 50.0 |
| 11 | 1990 | 49.9 |
The average temperature in Madison was 48.3 degrees which tied for the 14th warmest year on record.
| Rank | Year | MSN Average Temperature |
| 1 | 2012 | 51.3 |
| 2 | 1931 | 50.9 |
| 3 | 1998 | 49.8 |
| 3 | 1878 | 49.8 |
| 5 | 1921 | 49.5 |
| 6 | 2016 | 49.3 |
| 7 | 1939 | 49.1 |
| 8 | 1987 | 48.9 |
| 9 | 1941 | 48.8 |
| 10 | 1953 | 48.7 |
| 10 | 1946 | 48.7 |
| 12 | 1938 | 48.6 |
| 13 | 2006 | 48.5 |
| 14 | 2017 | 48.3 |
| 14 | 2010 | 48.3 |
| 14 | 2005 | 48.3 |
| 14 | 1934 | 48.3 |
| 18 | 2015 | 48.1 |
Here are links to the complete Milwaukee and Madison annual climate summaries.
The below graphs illustrate the high and low temperature for each day of the year as well as cumulative rain and snowfall. Record high and low temperatures are indicated by a red or blue star respectively. Graphs for past years are available on our website at www.weather.gov/mkx/yearly_climate.
 |
 |
Milwaukee
For most of 2017, Milwaukee was running above normal for precipitation and liquid equivalent of snow. Only during this recent December dry spell, did the annual precipitation fall slightly below normal. For the year, Milwaukee ended up with 34.09 inches of rain and snow melt, which was about one half inch (0.67") below normal.
Snowfall for the calendar year ended up well below the annual normal of 46.9 inches. The above graph shows snowfall was running at a deficit both at the end of the 2016-2017 winter and so far through the beginning of the 2017-2018 winter.
Madison
Madison ended up measuring 38.28 inches of precipitation and liquid equivalent of snow, which was above the annual normal by nearly 4 inches (3.8"). The above graph shows Madison was running at a precipitation surplus for almost the entire year.
Snowfall however took a hit in Madison. Only 25.3 inches fell during the calendar year, which was 25.6 inches below the annual normal. The 2016-2017 season ended up with about a 5" deficit of snowfall, and the deficit has increased significantly so far this cold season of 2017-2018.
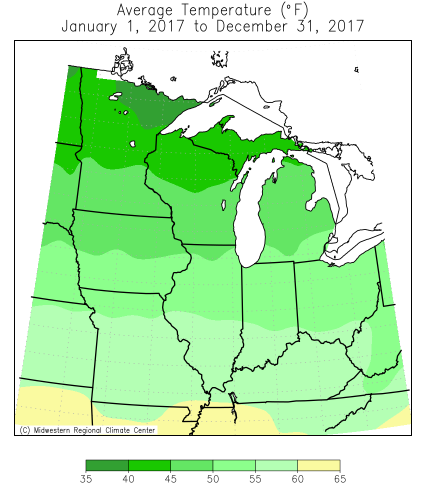
The below graphics were prepared by the Midwest Regional Climate Center and illustrate the 2017 average temperature, maximum temperature, minimum temperature, precipitation and snowfall across the region.
 |
 |
 |
 |
 |
Marc Kavinsky
NWS - Milwaukee/Sullivan

