May 1, 2023 Spring and Summer Streamflow Forecasts
Upper Missouri Basin
The high elevation snow pack in the Upper Missouri Basin as of May 1
was near average. The snow pack in the St. Mary Basin was 94 percent,
and the Milk River Basin was 97 percent.
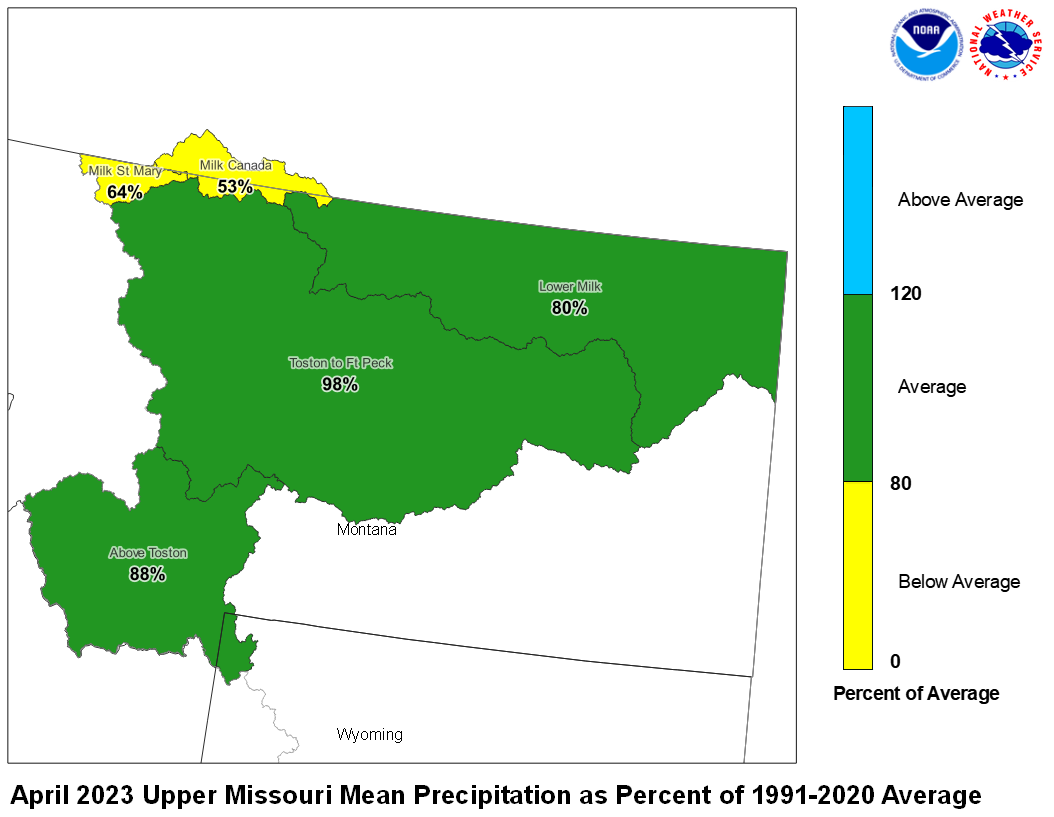
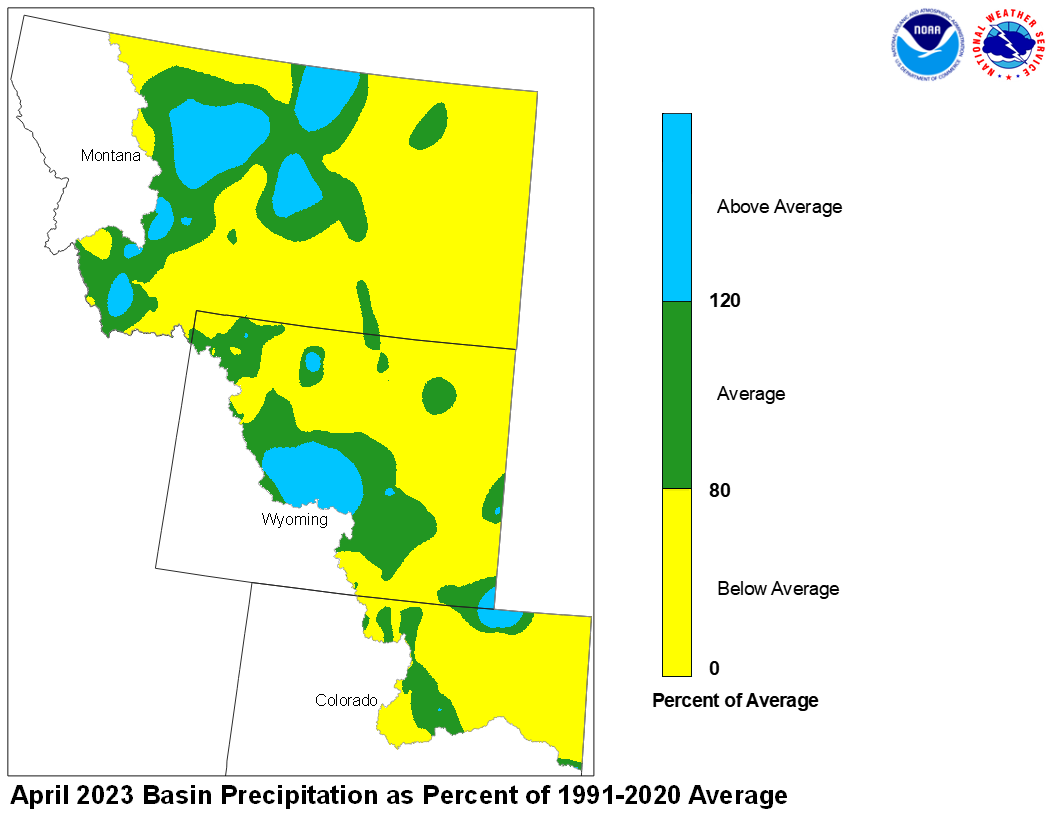
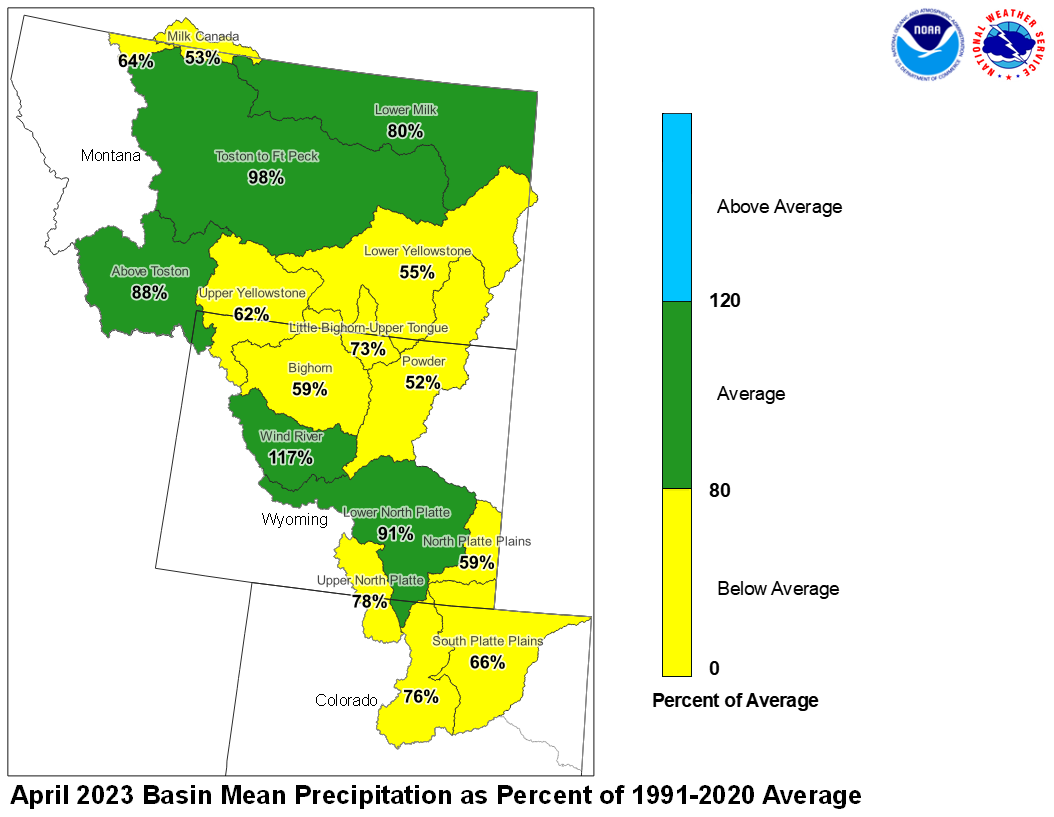
April precipitation across the Upper Missouri Basin was below average.
Basin precipitation summaries for the Missouri Basin include: Milk St. Mary,
64 percent; Milk Canada, 53 percent; Lower Milk, 80 percent; above Toston,
88 percent; Toston to Ft. Peck, 98 percent.
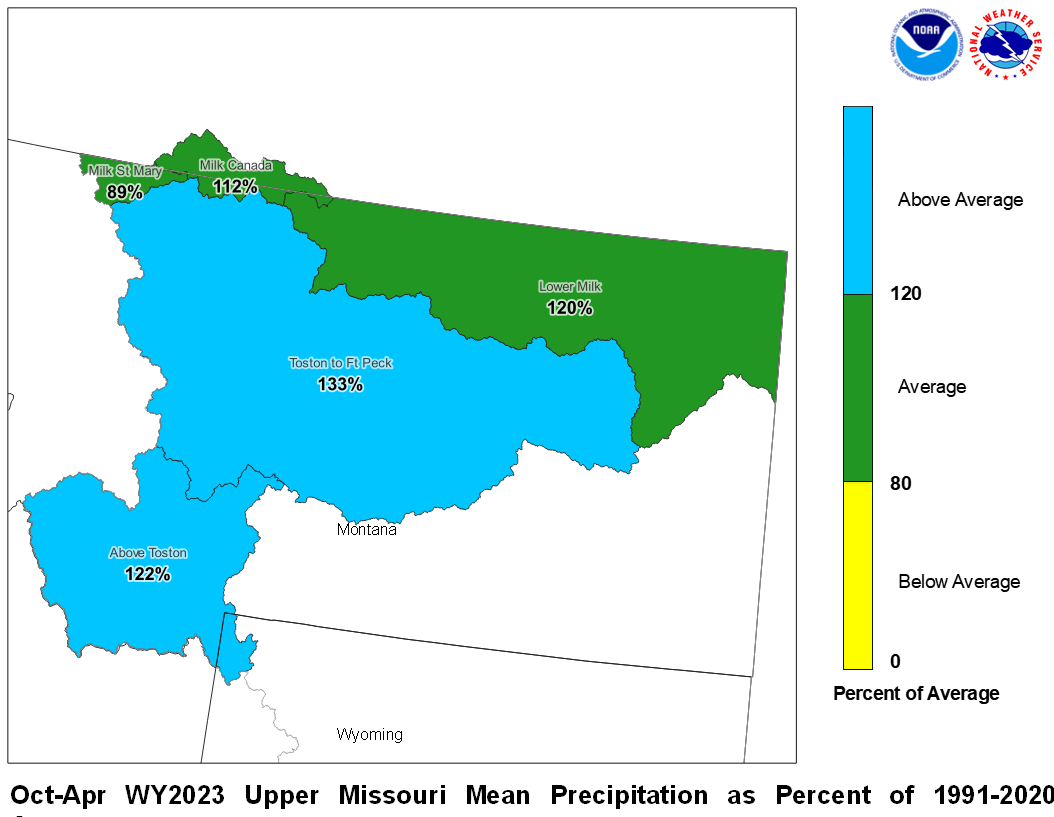
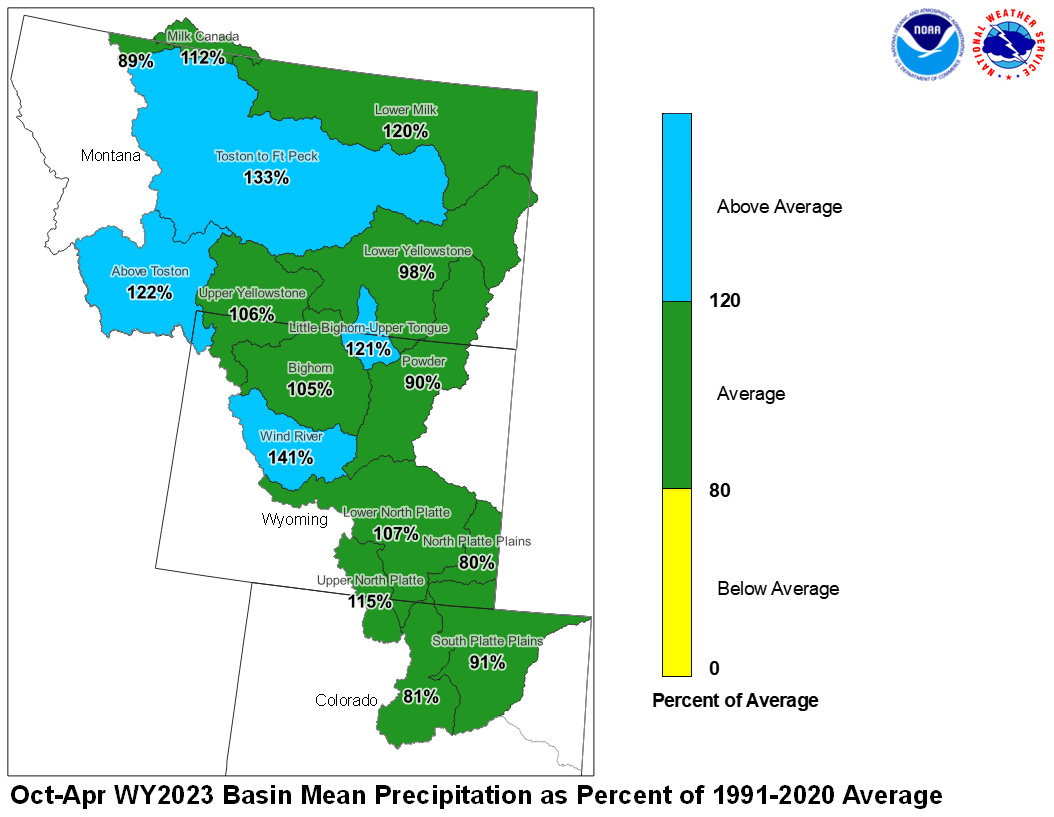
April 2023 Upper Missouri Mean Precip Oct-Apr WY2023 Upper Missouri Mean Precip
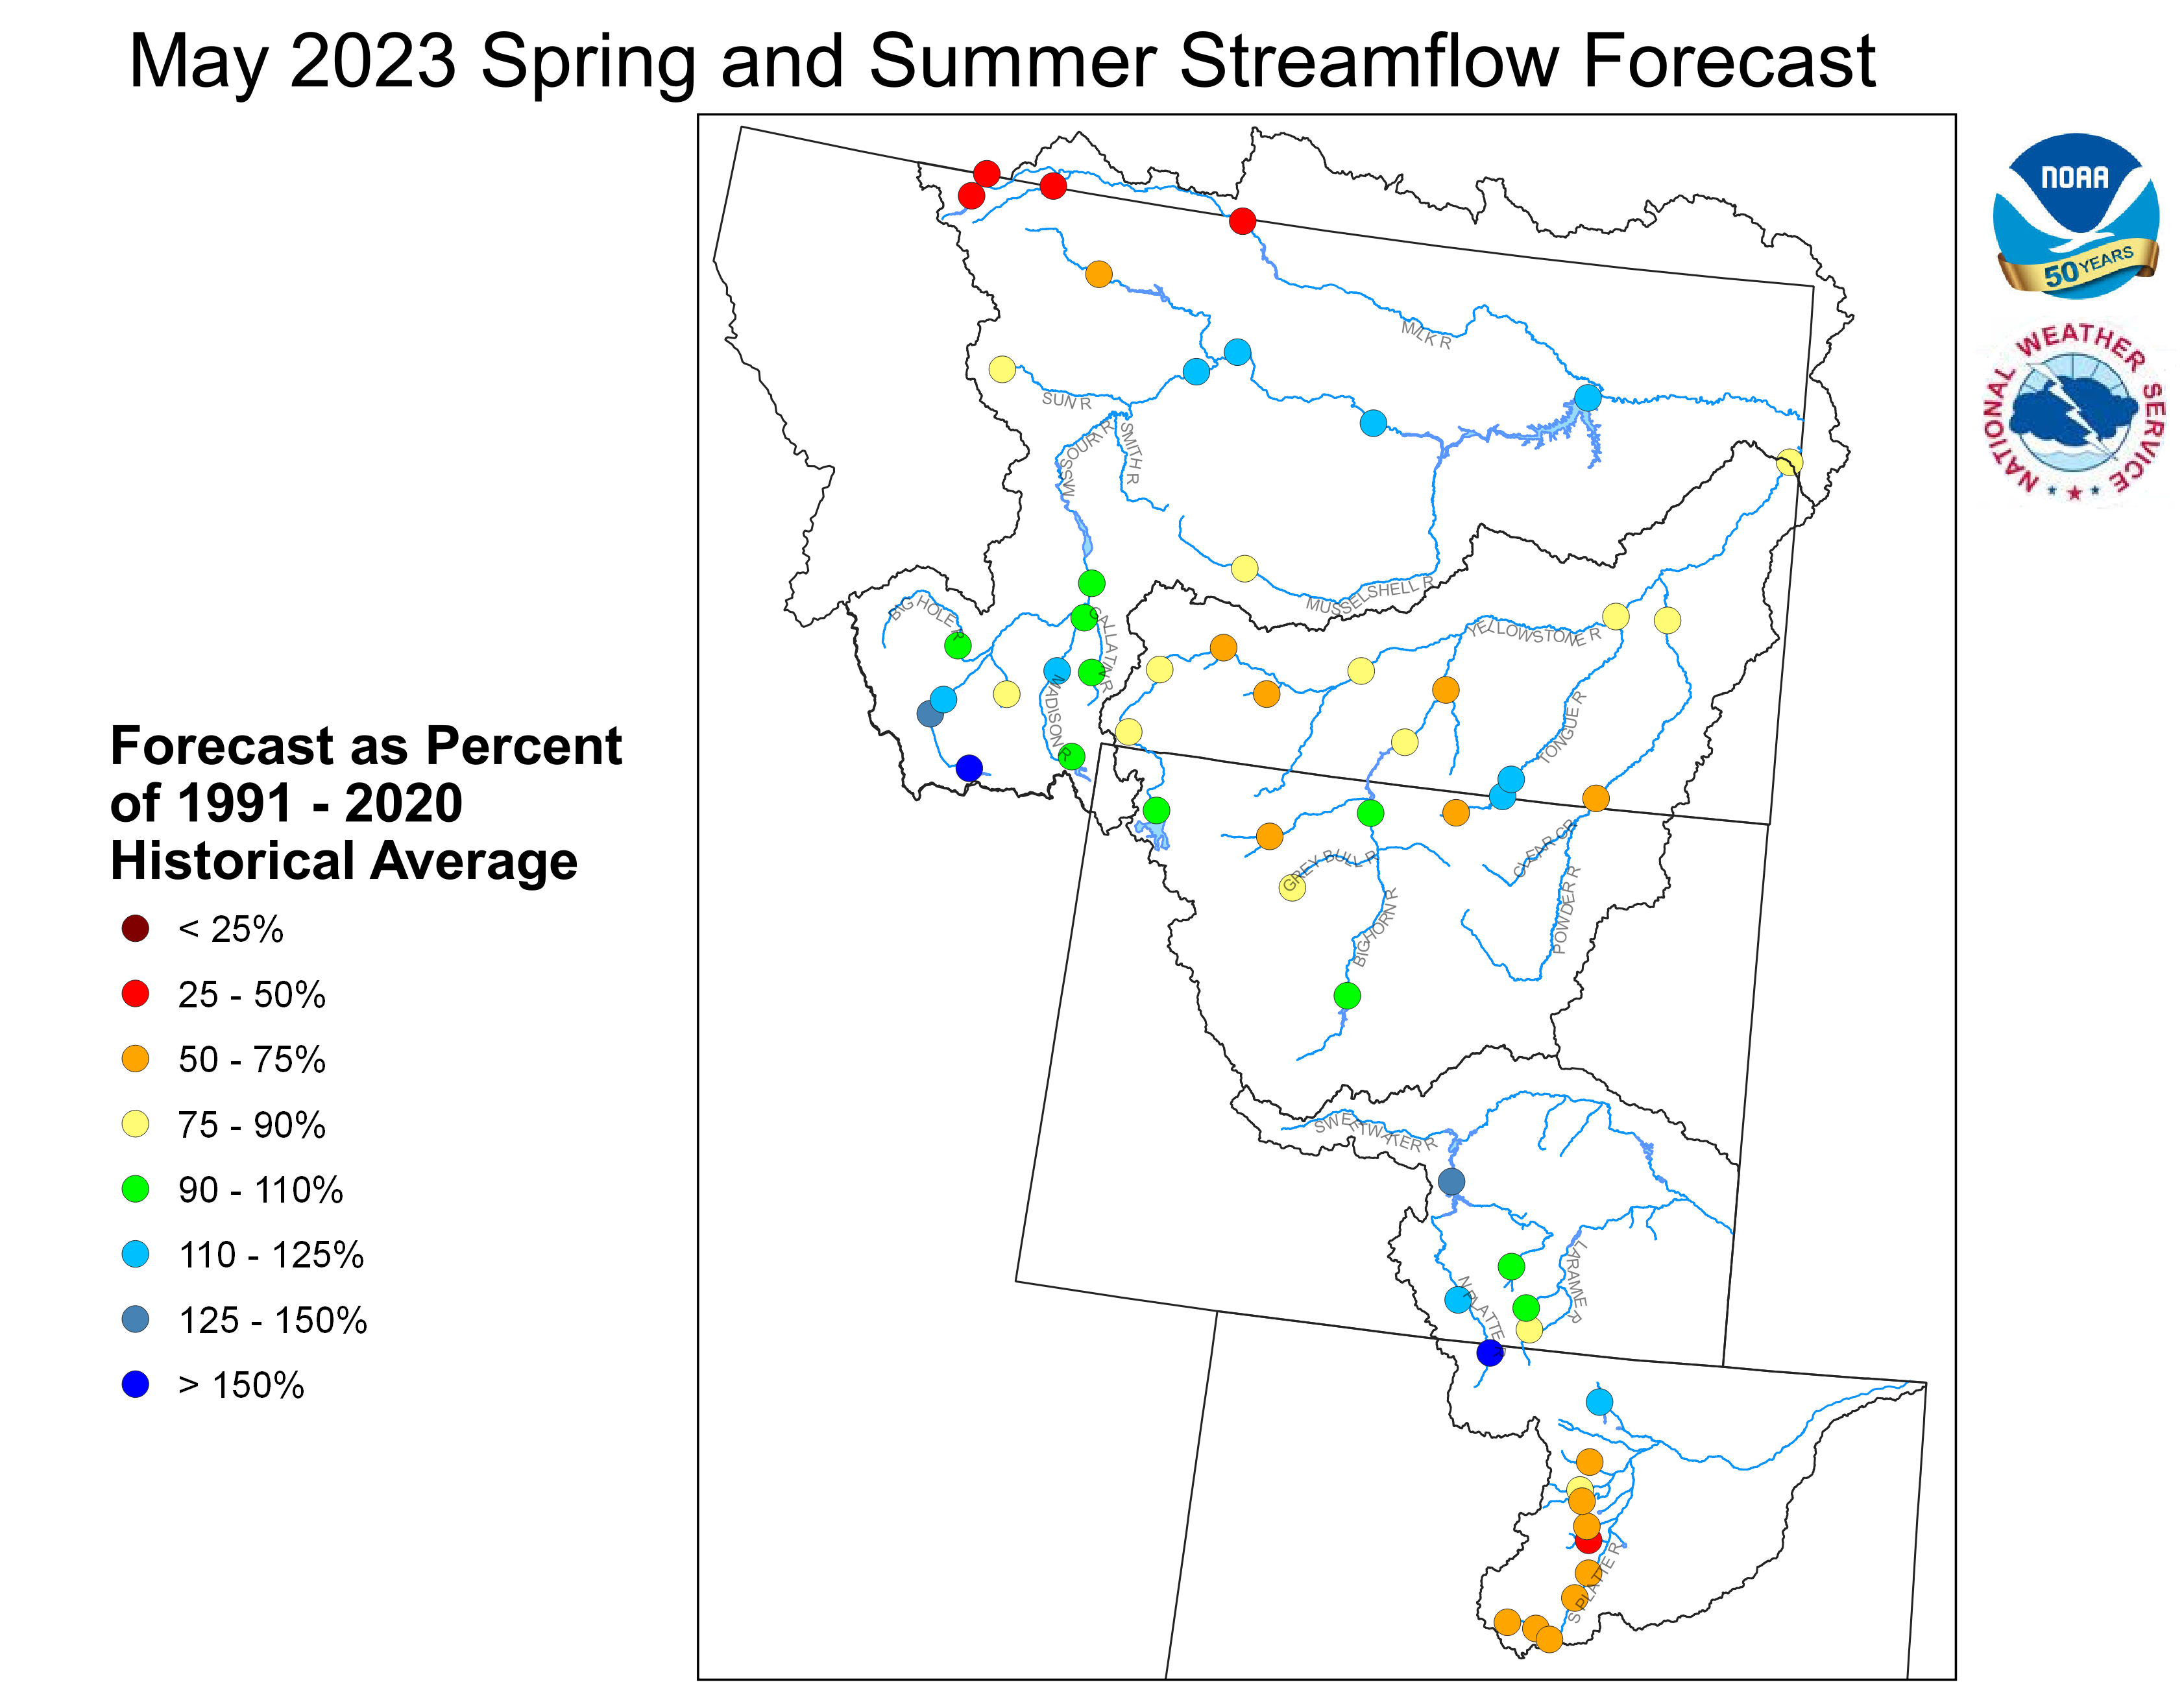
Stream flow in the Upper Missouri Basin is forecast to be
below to above average during the upcoming Spring and Summer.
The St. Mary River is forecast to have 47 percent of average
May-September flows. Runoff is expected to range around
110 percent of average for the Missouri Basin above Fort Peck,
Montana.
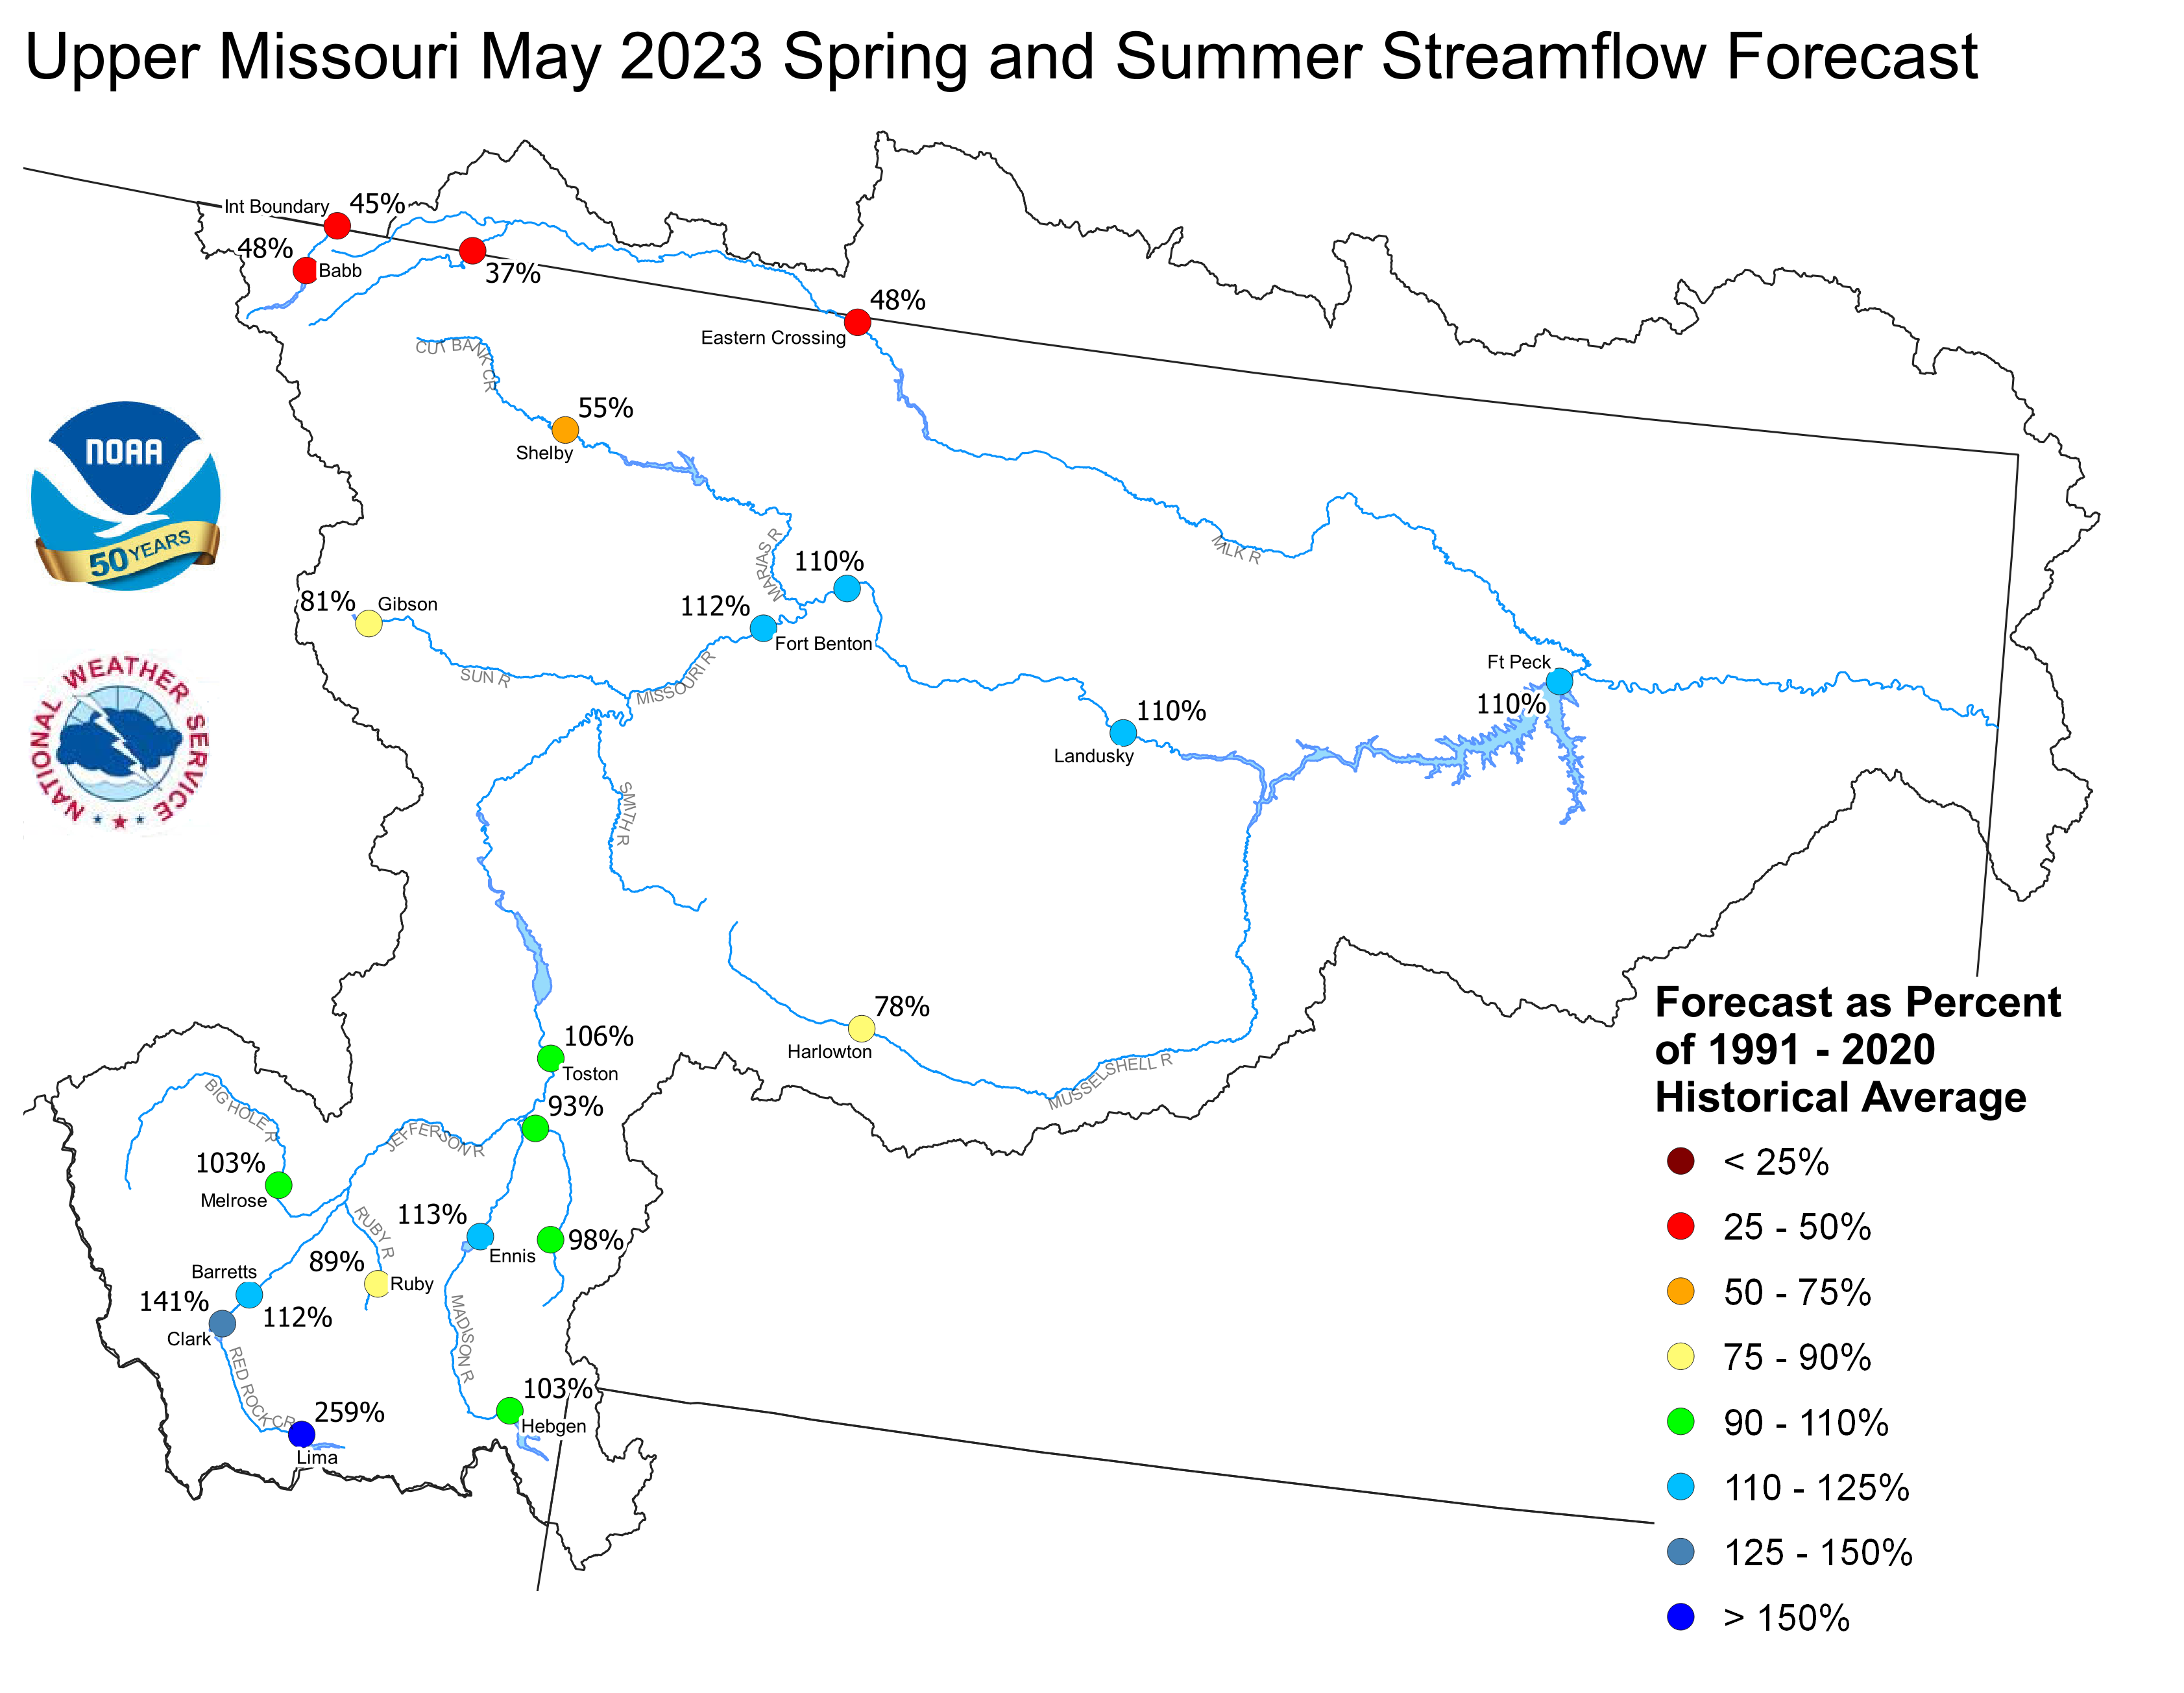
Upper Missouri May 1, 2023 Spring and Summer Streamflow Forecasts
Of the four major irrigation reservoirs in Montana; Lima
Reservoir had 58 percent average storage, Clark Canyon was
holding 86 percent of average water, Gibson Reservoir had 43
percent of average stored water, and Fresno Reservoir had
102 percent of average stored water.
Yellowstone Basin
The high elevation snow pack in the Yellowstone Basin was above average
on May 1. The snow pack in the Upper Yellowstone Basin was 113 percent
of average. The snow packs in the Wind, Bighorn, and Shoshone Basins were 133,
106, and 95 percent of average, respectively. The snow packs in the Tongue
and Powder basins were 105 and 110 percent of average, respectively.
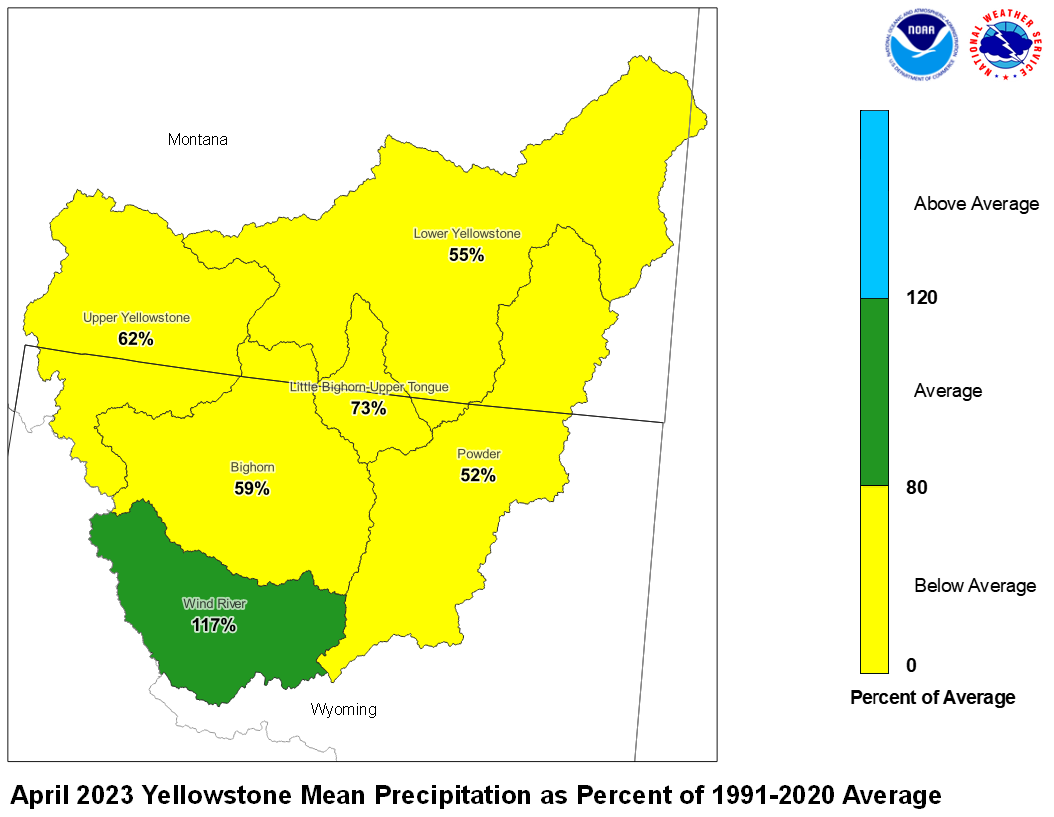
Precipitation during April was below average. The upper Yellowstone River
Basin received 62 percent of average precipitation while the Lower
Yellowstone River Basin reported 55 percent of average. The Bighorn
Basin received 59 percent of average precipitation while the
Wind River Basin received 117 percent of average. The Little Bighorn -
Upper Tongue Basin received 73 percent of average and the Powder River
had 52 percent of average precipitation.
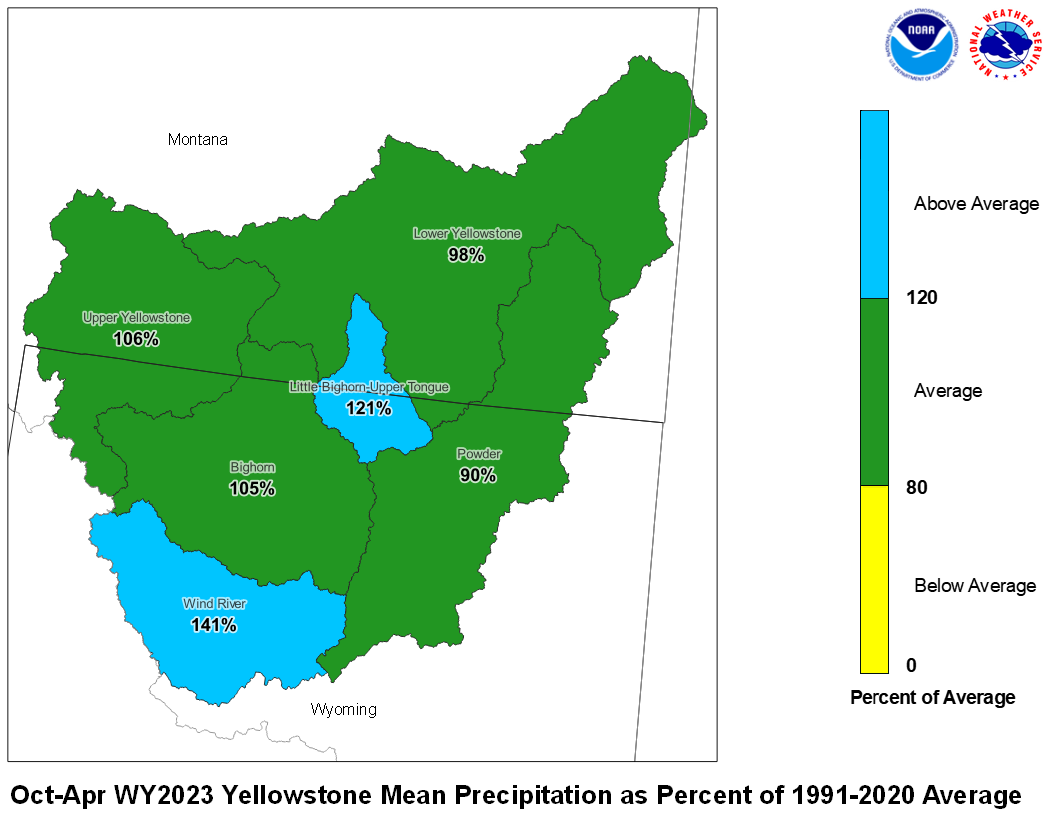
April 2023 Yellowstone Mean Precip Oct-Apr WY2023 Yellowstone Mean Precip
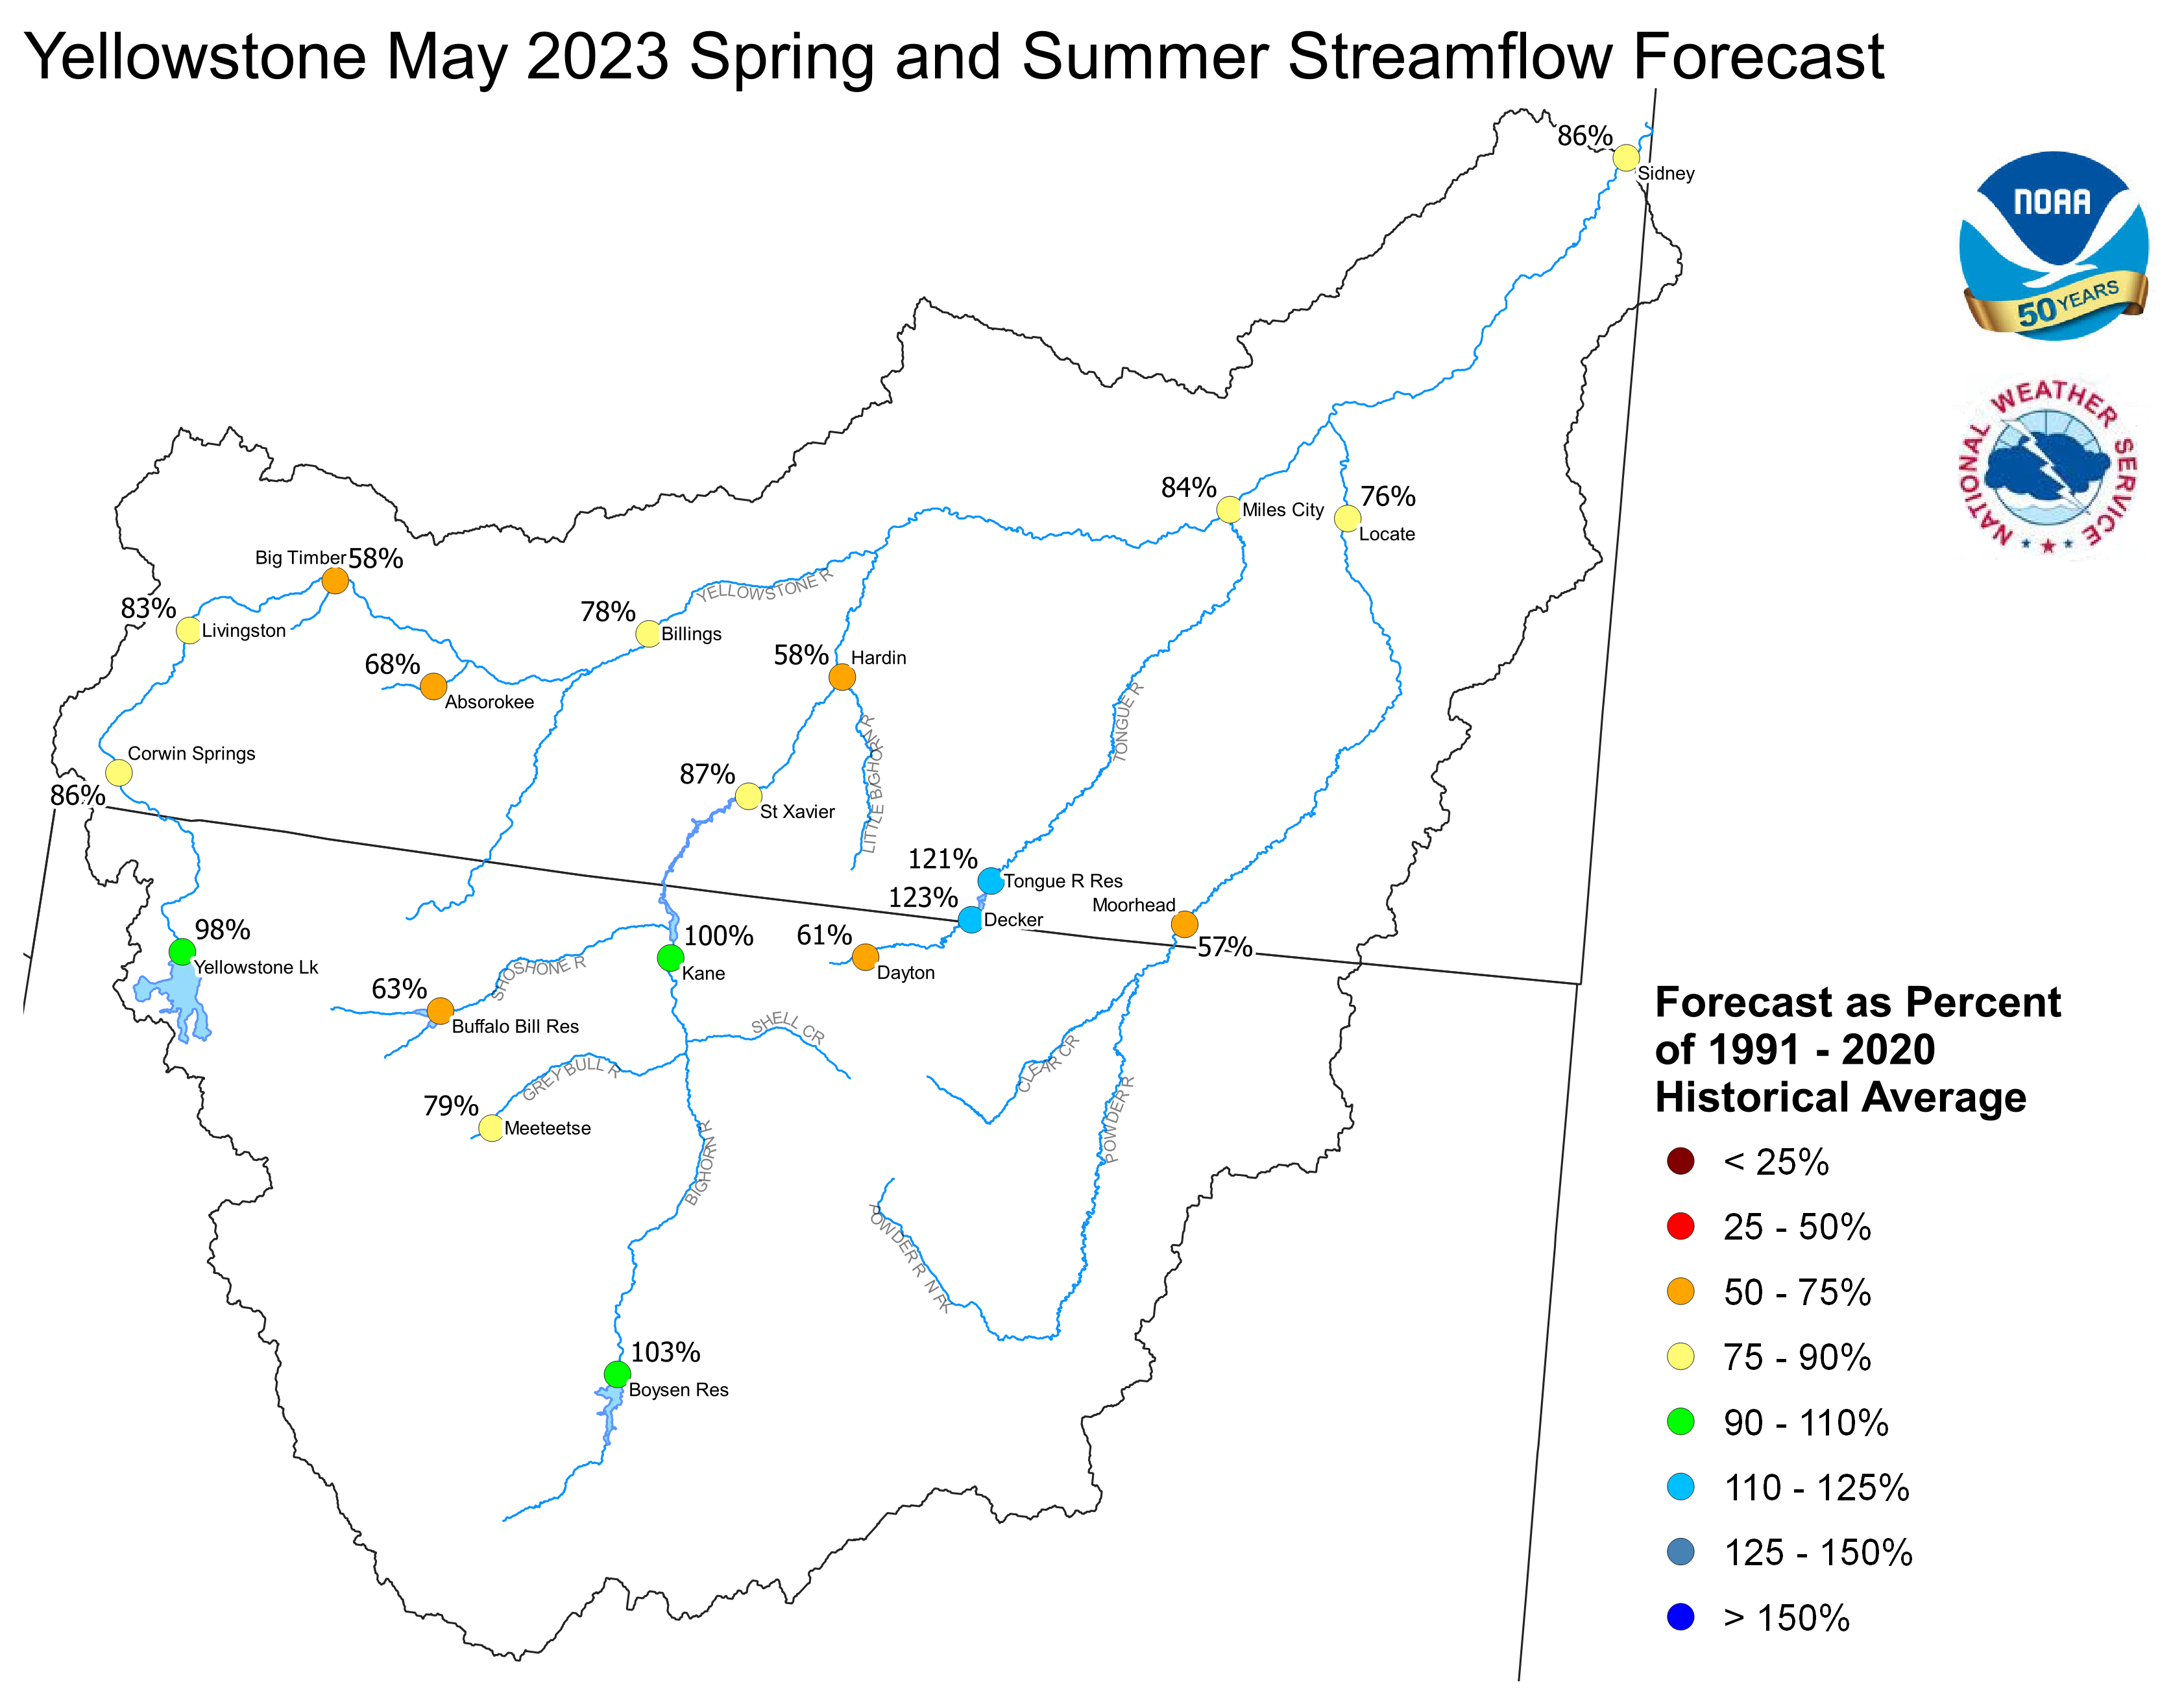
Forecast stream flow in the Yellowstone Basin is below to above average
for the upcoming Spring and Summer. Stream flow for the
Yellowstone River above Sidney, Montana is forecast to be about
83 percent of average. Flow in the Tongue Basin is expected to be
122 percent of average. Flows in the Powder River are expected
to be about 57 percent of average.
Monthend storage at Boysen Reservoir was 92 percent of average.
Stored water in Buffalo Bill Reservoir was 102 percent of average.
Monthend storage was 100 percent of average at Bighorn Reservoir.
Yellowstone May 1, 2023 Spring and Summer Streamflow Forecasts
Platte Basin
The high elevation snow pack in the Upper North Platte Basin was
91 percent of average on May 1. The snow pack in the North Platte
Basin below Seminoe Reservoir was 125 percent of average. The snow
pack in the South Platte Basin was 106 percent of average.
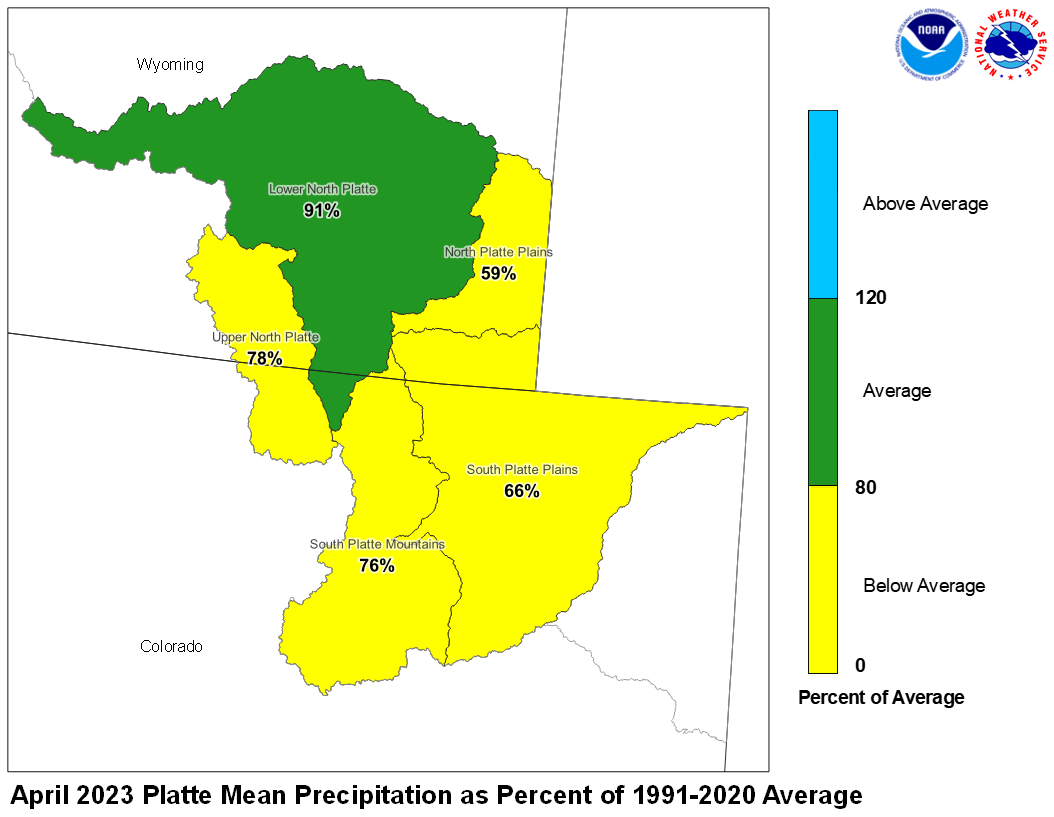
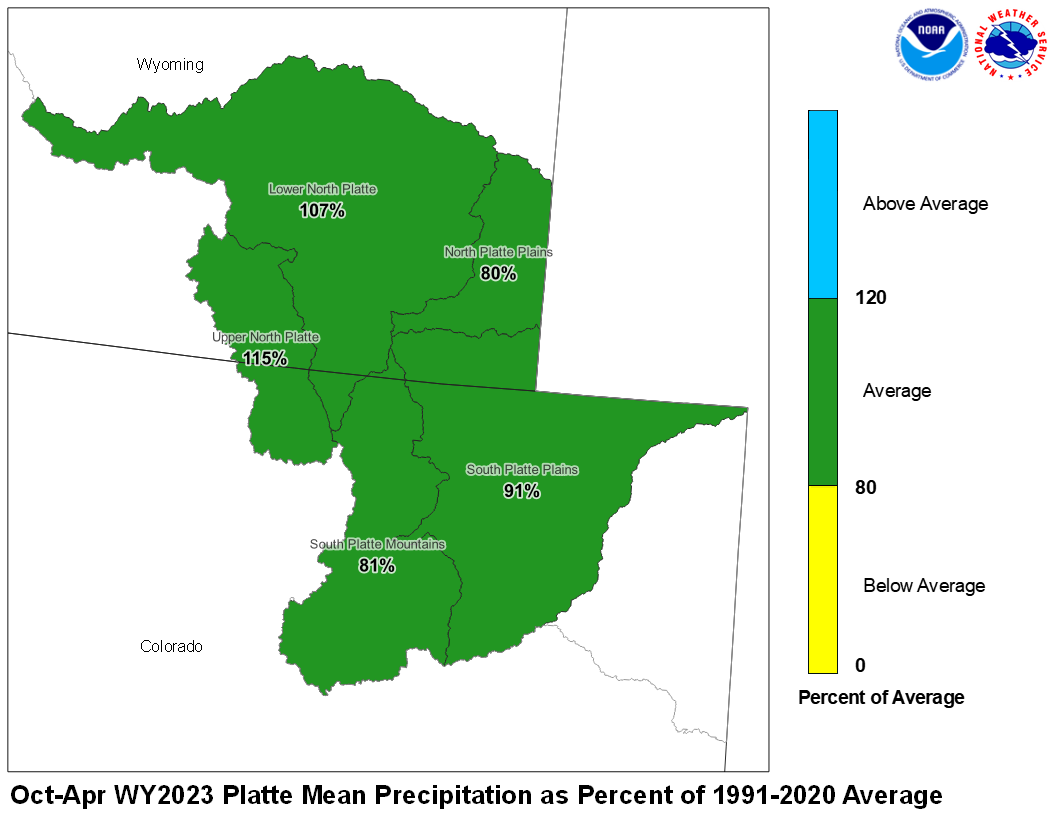
Precipitation during April in the Upper North Platte Basin was 78
percent of average. In the Lower North Platte Basin, precipitation
was 91 percent of average. The North Platte Plains below Guernsy
Reservoir had 59 percent. The South Platte Mountains had 76
percent whereas the Plains had 66 percent of average April
precipitation.
April 2023 Platte Mean Precip Oct-Apr WY2023 Platte Mean Precip
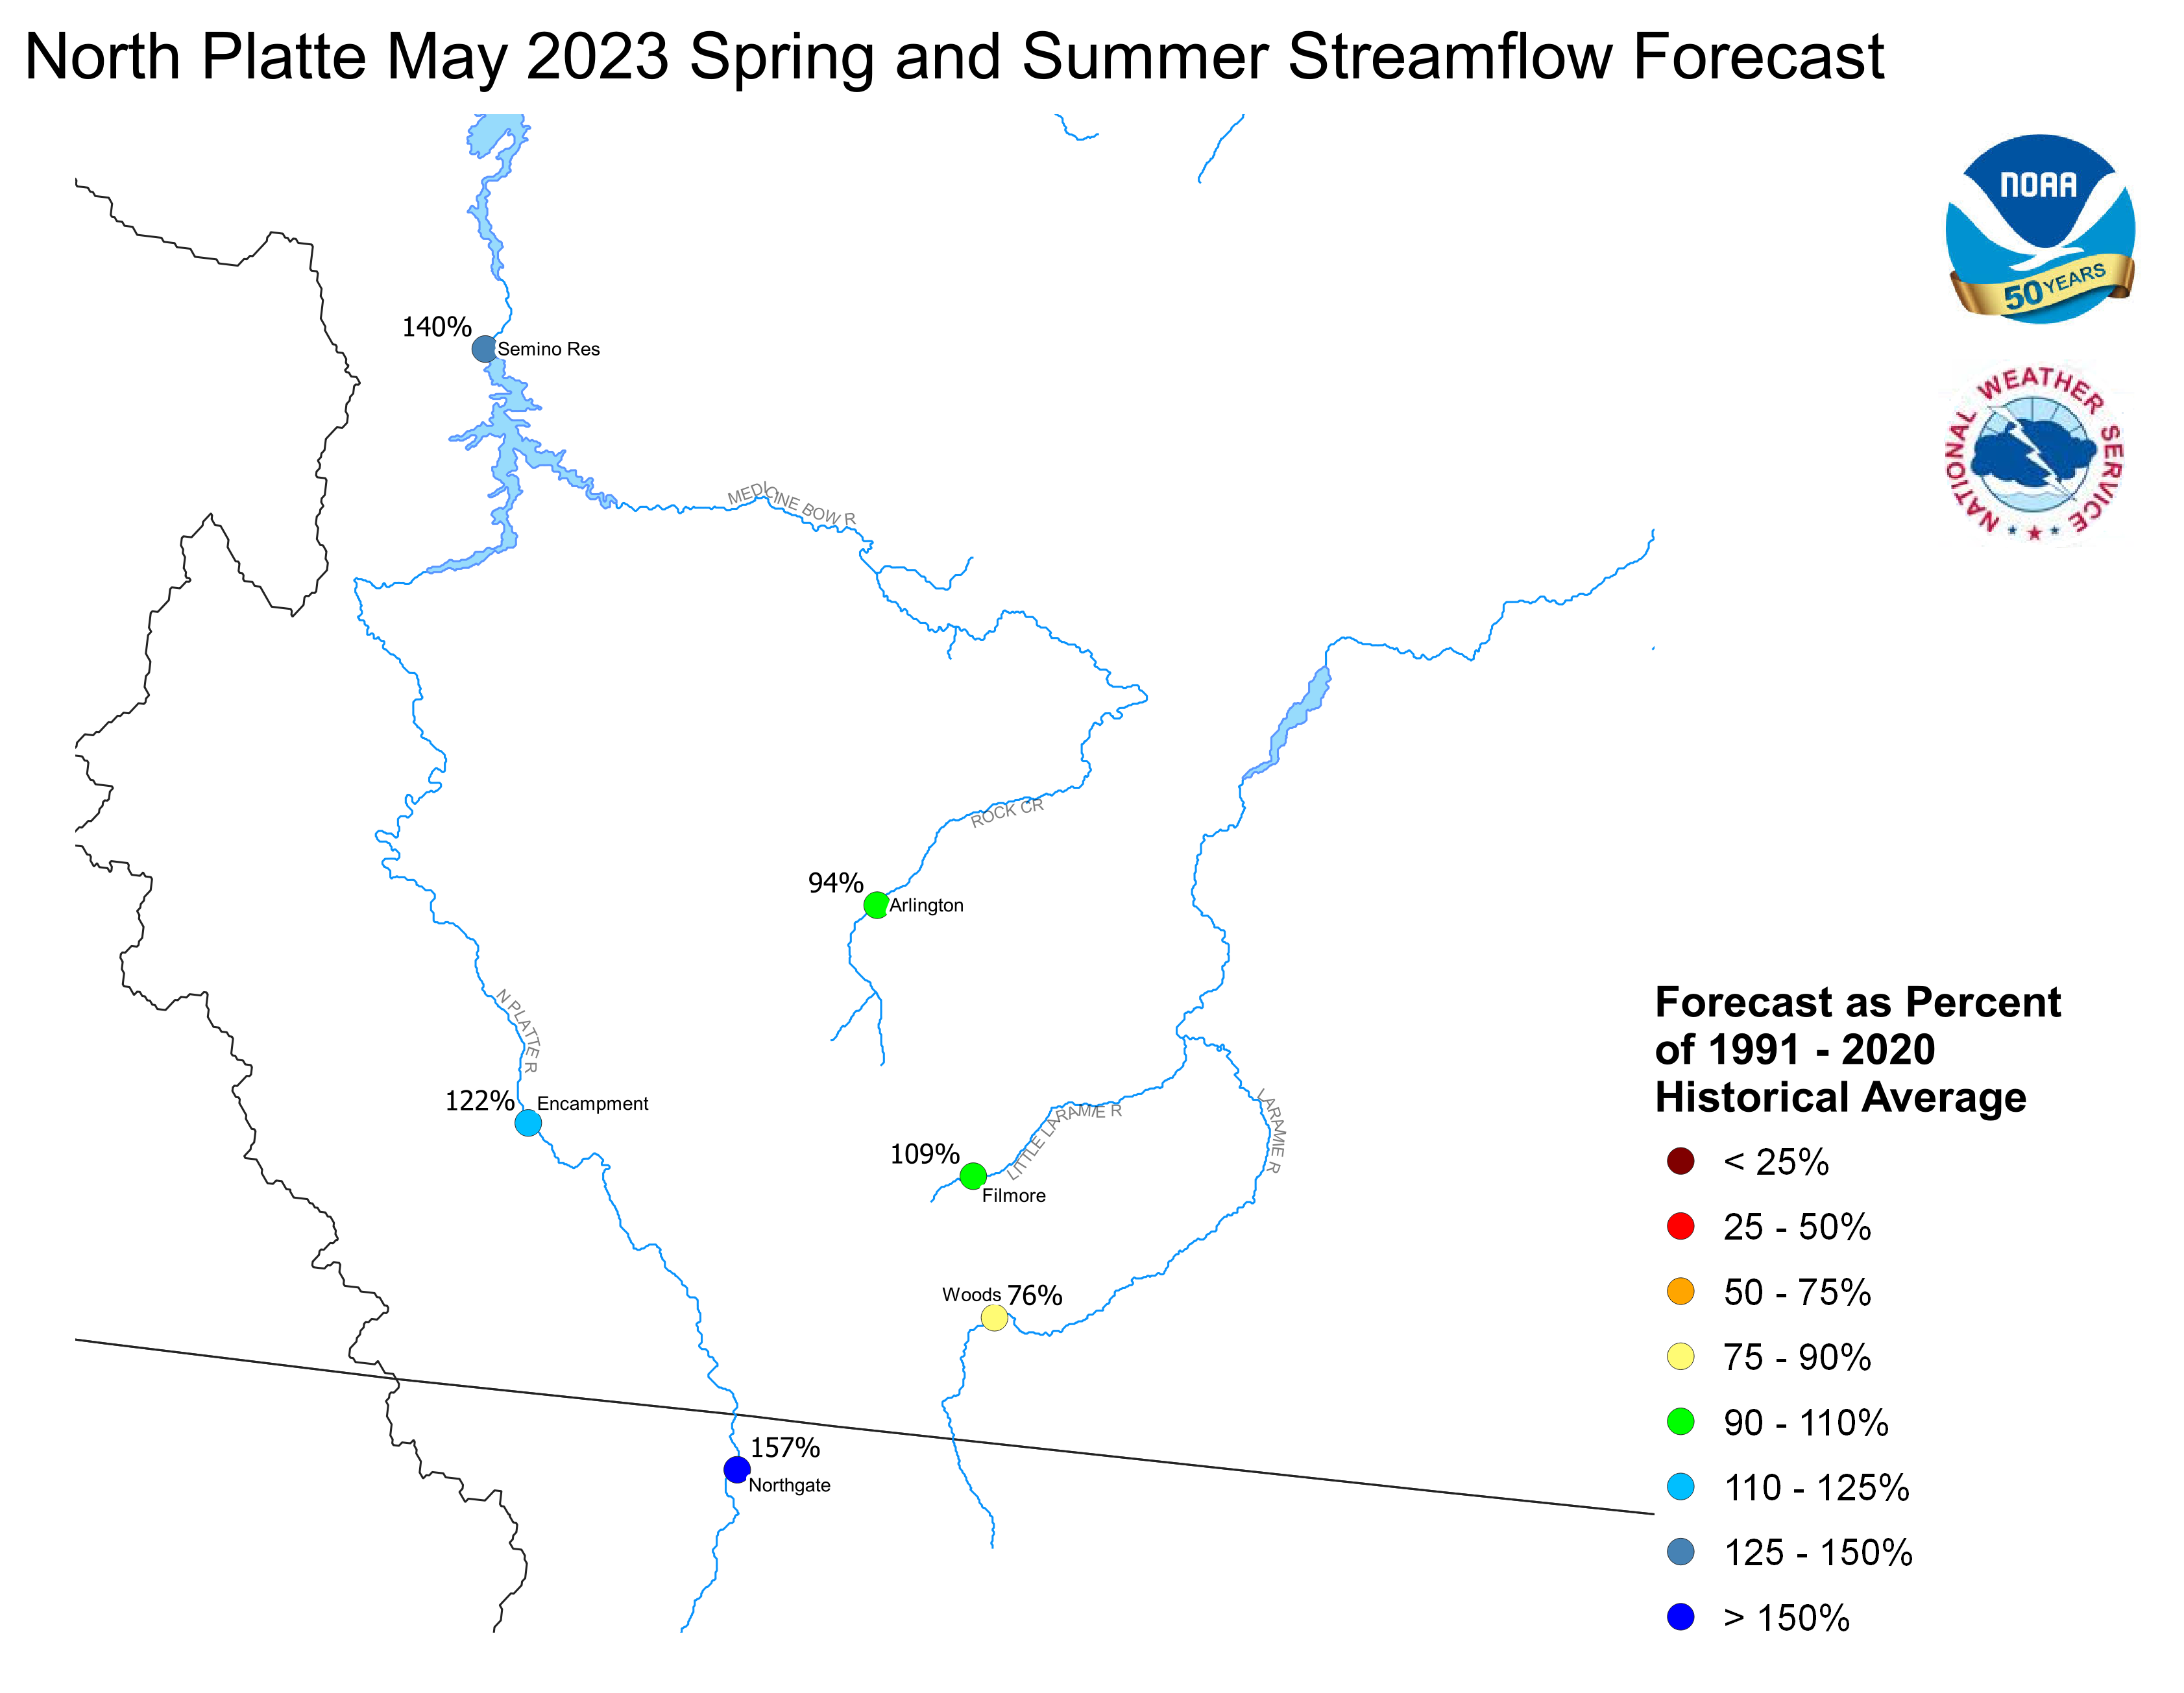
Stream flow in the Platte Basin is forecast to be below
to above average during the upcoming Spring and Summer. Runoff
for streams above Seminoe Reservoir are expected to be
about 120 percent of average. Streams in the South Platte
Basin above South Platte, Colorado can expect 65 percent
of average flow. For the remainder of the South Platte
basin, flows are expected near 70 percent.
Stored water in the South Platte Basin was 96 percent of average
on May 1.
North Platte Streamflow Fcst South Platte Streamflow Fcst
FGUS63 KKRF 081910
ESPKRF
WATER SUPPLY FORECAST
NWS MISSOURI BASIN RIVER FORECAST CENTER
PLEASANT HILL MISSOURI

1402 CDT MONDAY MAY 08, 2023

DATA CURRENT AS OF: MAY 01, 2023

MISSOURI/YELLOWSTONE/PLATTE RIVER BASIN FORECASTS


                                          50%   %   10%   90%   AVG
FORECAST POINT                   PERIOD  (KAF) AVG (KAF) (KAF) (KAF)
--------------------------------------------------------------------

Boysen Resvr Inflow              Apr-Sep  551   77   907  347    720
 SBDW4

Boysen Resvr Inflow              Apr-Sep  917  103  1337  679    890
 SBDW4N

Bighorn R at Kane                Apr-Sep  817   83  1525  593    985
 LVEW4

Bighorn R at Kane                Apr-Sep 1441  100  2215 1091   1440
 LVEW4N

Greybull R at Meeteetse          Apr-Sep  161   82   257  119    196
 MEEW4

Greybull R at Meeteetse          Apr-Sep  161   79   257  119    205
 MEEW4N

Buffalo Bill Resvr Inflow        Apr-Sep  501   61   652  413    815
 CDYW4

Buffalo Bill Resvr Inflow        Apr-Sep  572   63   717  489    910
 CDYW4N

St. Mary R nr Babb               Apr-Sep  257   56   315  216    460
 SMYM8

St. Mary R nr Babb               Apr-Sep  256   48   315  214    535
 SMYM8N

St. Mary R at Intl Boundary      Apr-Sep  181   46   264  130    390
 SMBM8

St. Mary R at Intl Boundary      Apr-Sep  297   45   380  250    660
 SMBM8N

Milk R nr Western Crossing       Apr-Sep    9    8    28    6    113
 PDBM8

Milk R nr Western Crossing       Apr-Sep   15   37    37   10     41
 PDBM8N

Milk R nr Eastern Crossing       Apr-Sep  141   66   218  130    215
 ERNM8

Milk R nr Eastern Crossing       Apr-Sep   54   48   159   37    112
 ERNM8N

North Platte R nr Northgate      Apr-Sep  414  169   536  328    245
 NGTC2

North Platte R nr Northgate      Apr-Sep  463  157   583  378    295
 NGTC2N

Encampment R nr Encampment       Apr-Sep  193  124   222  170    156
 ECRW4

Encampment R nr Encampment       Apr-Sep  203  122   231  180    166
 ECRW4N

Rock Cr nr Arlington             Apr-Sep   50   94    57   43     53
 KCRW4

Rock Cr nr Arlington             Apr-Sep   50   94    57   43     53
 KCRW4N

Seminoe Resvr Inflow             Apr-Sep 1123  147  1365  917    765
 SETW4

Seminoe Resvr Inflow             Apr-Sep 1286  140  1538 1094    920
 SETW4N

Laramie R nr Woods Landing       Apr-Sep   75   69   110   50    108
 WODW4

Laramie R nr Woods Landing       Apr-Sep  108   76   143   84    142
 WODW4N

Little Laramie R nr Filmore      Apr-Sep   60  109    73   49     55
 SMTW4

Little Laramie R nr Filmore      Apr-Sep   62  109    75   51     57
 SMTW4N

Antero Resvr Inflow              Apr-Sep    9   64    12    6     14
 ANRC2

Antero Resvr Inflow              Apr-Sep    9   64    12    6     14
 ANRC2N

Spinney Mountain Resvr Inflow    Apr-Sep   40   70    58   31     57
 SPYC2

Spinney Mountain Resvr Inflow    Apr-Sep   30   67    49   20     45
 SPYC2N

Elevenmile Canyon Resvr Inflow   Apr-Sep   35   59    45   30     59
 EVNC2

Elevenmile Canyon Resvr Inflow   Apr-Sep   33   66    53   21     50
 EVNC2N

Cheesman Lk Inflow               Apr-Sep   55   55    78   41    100
 CHEC2

Cheesman Lk Inflow               Apr-Sep   58   62    93   39     93
 CHEC2N

S Platte R at S Platte           Apr-Sep  245  102   281  230    240
 SPTC2

S Platte R at S Platte           Apr-Sep  108   53   163   75    205
 SPTC2N

Bear Cr at Morrison              Apr-Sep   10   38    19    6     26
 MRRC2

Bear Cr at Morrison              Apr-Sep   10   38    19    6     26
 MRRC2N

Clear Cr at Golden               Apr-Sep   78   66    99   63    118
 GLDC2

Clear Cr at Golden               Apr-Sep   89   68   110   73    131
 GLDC2N

St. Vrain Cr at Lyons            Apr-Sep   41   52    64   31     79
 LNSC2

St. Vrain Cr at Lyons            Apr-Sep   63   58    89   50    109
 LNSC2N

Boulder Cr nr Orodell            Apr-Sep   24   51    38   20     47
 OROC2

Boulder Cr nr Orodell            Apr-Sep   39   75    54   34     52
 OROC2N

S Boulder Cr nr Eldorado Sprgs   Apr-Sep   22   63    28   18     35
 BELC2

S Boulder Cr nr Eldorado Sprgs   Apr-Sep   22   55    34   18     40
 BELC2N

Cache La Poudre at Canyon Mouth  Apr-Sep  203  188   280  164    108
 FTDC2

Cache La Poudre at Canyon Mouth  Apr-Sep  239  114   324  196    210
 FTDC2N

Lima Resvr Inflow                Apr-Sep  205  270   249  172     76
 LRRM8

Lima Resvr Inflow                Apr-Sep  205  259   249  172     79
 LRRM8N

Clark Canyon Resvr Inflow        Apr-Sep  141  128   200  115    110
 CLKM8

Clark Canyon Resvr Inflow        Apr-Sep  280  141   340  239    198
 CLKM8N

Beaverhead R at Barretts         Apr-Sep  184   92   192  178    199
 BARM8

Beaverhead R at Barretts         Apr-Sep  315  112   380  274    280
 BARM8N

Ruby R Resvr Inflow              Apr-Sep   86   98   102   65     88
 ALRM8

Ruby R Resvr Inflow              Apr-Sep   86   89   102   65     97
 ALRM8N

Big Hole R nr Melrose            Apr-Sep  615  103   824  543    595
 MLRM8

Big Hole R nr Melrose            Apr-Sep  679  103   889  604    660
 MLRM8N

Hebgen Resvr Inflow              Apr-Sep  479  103   552  440    465
 HBDM8

Hebgen Resvr Inflow              Apr-Sep  479  103   553  440    465
 HBDM8N

Ennis Resvr Inflow               Apr-Sep  721  101   842  651    715
 ELMM8

Ennis Resvr Inflow               Apr-Sep  825  113   948  755    730
 ELMM8N

Gallatin R nr Gateway            Apr-Sep  464   98   571  399    475
 GLGM8

Gallatin R nr Gateway            Apr-Sep  464   98   571  399    475
 GLGM8N

Gallatin R at Logan              Apr-Sep  445   88   581  368    505
 LOGM8

Gallatin R at Logan              Apr-Sep  604   93   733  541    650
 LOGM8N

Missouri R at Toston             Apr-Sep 2026   98  2546 1823   2060
 TOSM8

Missouri R at Toston             Apr-Sep 3002  106  3541 2781   2830
 TOSM8N

Missouri R at Fort Benton        Apr-Sep 2408   79  3070 2174   3060
 FBNM8

Missouri R at Fort Benton        Apr-Sep 4601  112  5351 4242   4100
 FBNM8N

Missouri R nr Virgelle           Apr-Sep 2638   77  3347 2369   3420
 VRGM8

Missouri R nr Virgelle           Apr-Sep 5023  110  5942 4635   4560
 VRGM8N

Missouri R nr Landusky           Apr-Sep 2919   79  3594 2552   3680
 LDKM8

Missouri R nr Landusky           Apr-Sep 5356  110  6270 4933   4890
 LDKM8N

Missouri R below Fort Peck Dam   Apr-Sep 3186   83  3883 2757   3840
 FPKM8

Missouri R below Fort Peck Dam   Apr-Sep 5684  110  6603 5203   5180
 FPKM8N

Gibson Resvr Inflow              Apr-Sep  365   81   494  309    450
 AGSM8

Gibson Resvr Inflow              Apr-Sep  364   81   493  308    450
 AGSM8N

Marias R nr Shelby               Apr-Sep  221   51   354  160    435
 SHLM8

Marias R nr Shelby               Apr-Sep  269   55   397  200    490
 SHLM8N

Musselshell R at Harlowton       Apr-Sep   60   75    94   36     80
 HLWM8

Musselshell R at Harlowton       Apr-Sep   74   78   106   50     95
 HLWM8N

Yellowstone R at Yellowstone Lk  Apr-Sep  666   82   717  568    815
 YLOW4

Yellowstone R at Yellowstone Lk  Apr-Sep  823   98   912  702    840
 YLOW4N

Yellowstone R at Corwin Sprgs    Apr-Sep 1532   77  1762 1306   1980
 CORM8

Yellowstone R at Corwin Sprgs    Apr-Sep 1789   86  2030 1550   2070
 CORM8N

Yellowstone R at Livingston      Apr-Sep 1702   74  2006 1468   2290
 LIVM8

Yellowstone R at Livingston      Apr-Sep 2026   83  2329 1768   2440
 LIVM8N

Yellowstone R at Billings        Apr-Sep 2767   68  3432 2440   4070
 BILM8

Yellowstone R at Billings        Apr-Sep 3718   78  4385 3362   4790
 BILM8N

Yellowstone R at Miles City      Apr-Sep 4167   71  5464 3620   5850
 MILM8

Yellowstone R at Miles City      Apr-Sep 6435   84  7815 5685   7690
 MILM8N

Yellowstone R at Sidney          Apr-Sep 4296   75  5650 3642   5710
 SIDM8

Yellowstone R at Sidney          Apr-Sep 6892   86  8303 6062   8060
 SIDM8N

Boulder R at Big Timber          Apr-Sep  177   53   218  149    335
 BTMM8

Boulder R at Big Timber          Apr-Sep  218   58   258  191    375
 BTMM8N

Stillwater R nr Absarokee        Apr-Sep  343   64   428  294    540
 SRAM8

Stillwater R nr Absarokee        Apr-Sep  403   68   485  354    595
 SRAM8N

Clks Fk Yellowstone R nr Belfry  Apr-Sep  386   62   490  328    620
 BFYM8

Clks Fk Yellowstone R nr Belfry  Apr-Sep  460   66   561  402    695
 BFYM8N

Bighorn R nr St. Xavier          Apr-Sep  865   60  1616  784   1430
 STXM8

Bighorn R nr St. Xavier          Apr-Sep 2141   87  2986 1665   2460
 STXM8N

Little Bighorn R nr Hardin       Apr-Sep   73   57   149   59    127
 HRDM8

Little Bighorn R nr Hardin       Apr-Sep   74   58   149   59    127
 HRDM8N

Tongue R nr Dayton               Apr-Sep   56   58    79   42     96
 DAYW4

Tongue R nr Dayton               Apr-Sep   62   61    85   47    101
 DAYW4N

Tongue R nr Decker               Apr-Sep  250  106   339  217    235
 DSLM8

Tongue R nr Decker               Apr-Sep  295  123   384  262    240
 DSLM8N

Tongue R Resvr Inflow            Apr-Sep  250  106   342  218    235
 DKRM8

Tongue R Resvr Inflow            Apr-Sep  296  121   387  263    245
 DKRM8N

Powder R at Moorhead             Apr-Sep  127   56   279  108    225
 MHDM8

Powder R at Moorhead             Apr-Sep  154   57   314  129    270
 MHDM8N

Powder R nr Locate               Apr-Sep  203   78   397  174    260
 LOCM8

Powder R nr Locate               Apr-Sep  232   76   426  193    305
 LOCM8N


Locations with an `N` suffix indicate natural flows excluding
stream augmentations.

KAF: Thousands of Acre-feet

%AVG: Current 50%/AVG

AVG: Average(50%) seasonal runoff voulme as simulated by the river
forecast model considering acontinuous simulation of the basin
response to historic climate data (observed precipitation and
temperatures) over the period of 1991-2020.

The 50%, 10% and 90% columns indicate the probability that the
actual volume will exceed the forecast for the valid time period.

Beginning April 1, May and June official forecasts include observed
runoff volume up to official forecast date.

For more information, please visit: www.weather.gov/mbrfc/water


$$

