March 1, 2023 Spring and Summer Streamflow Forecasts
Upper Missouri Basin
The high elevation snow pack in the Upper Missouri Basin as of March 1
was near to above average. The snow pack in the St. Mary Basin was 89 percent,
and the Milk River Basin was 167 percent.
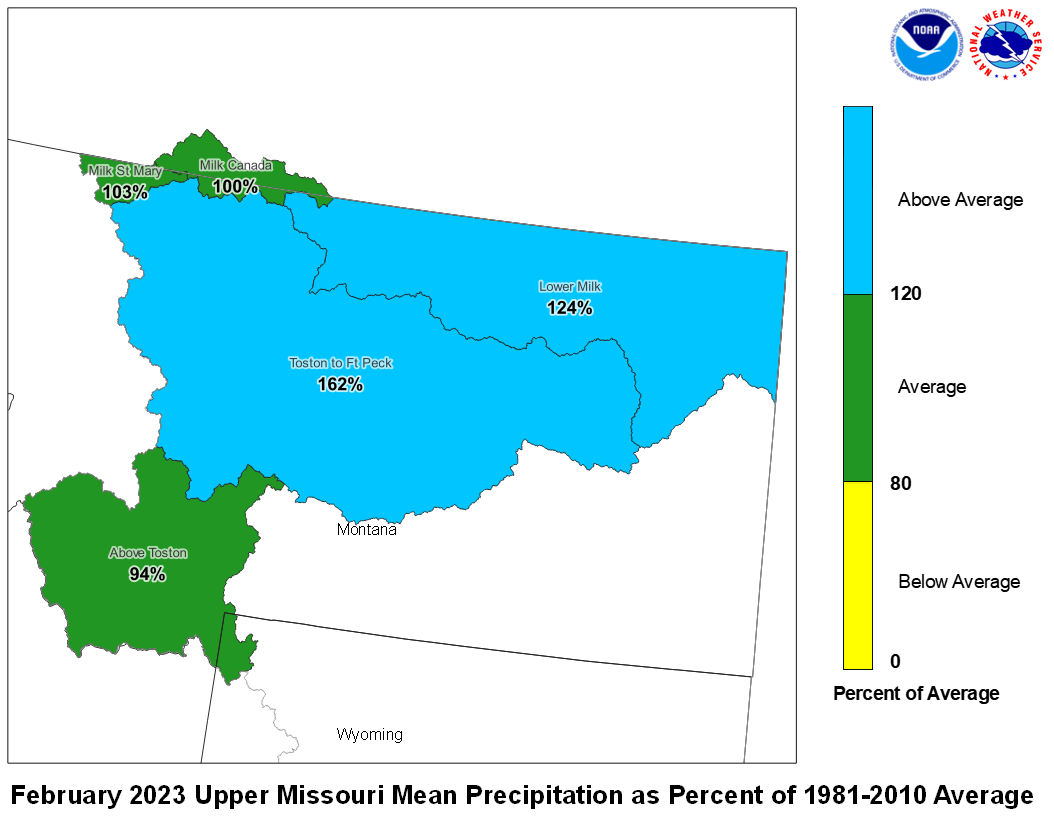
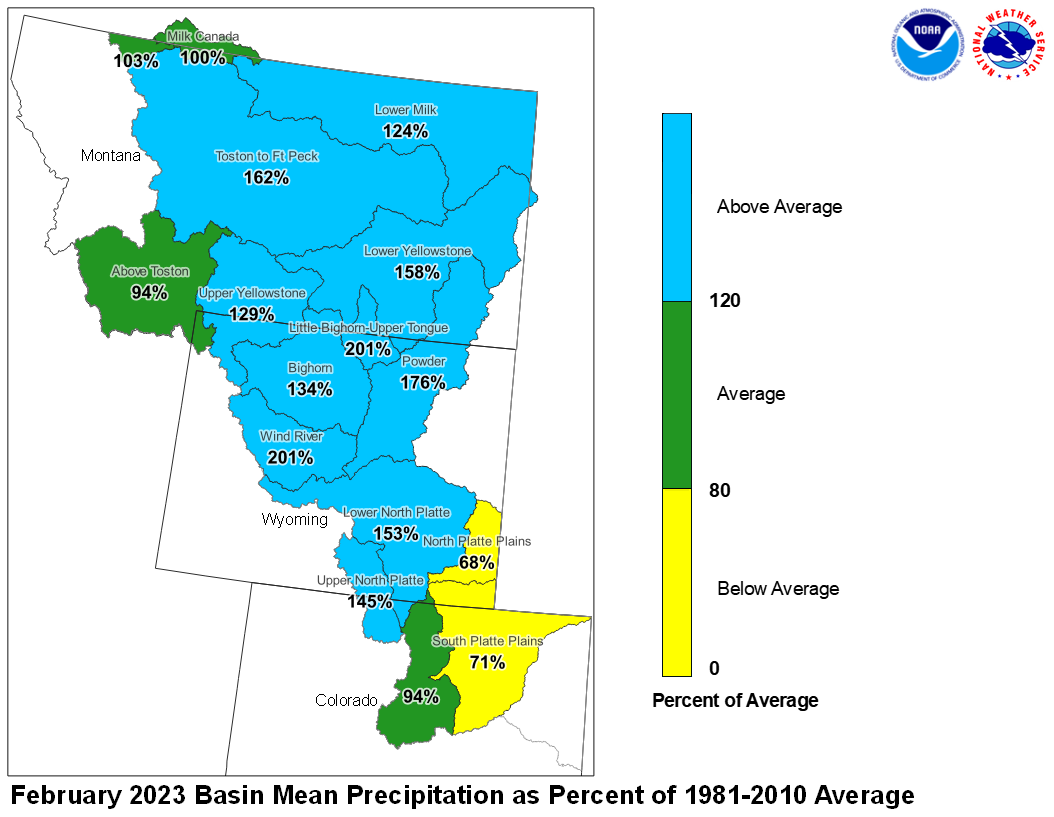
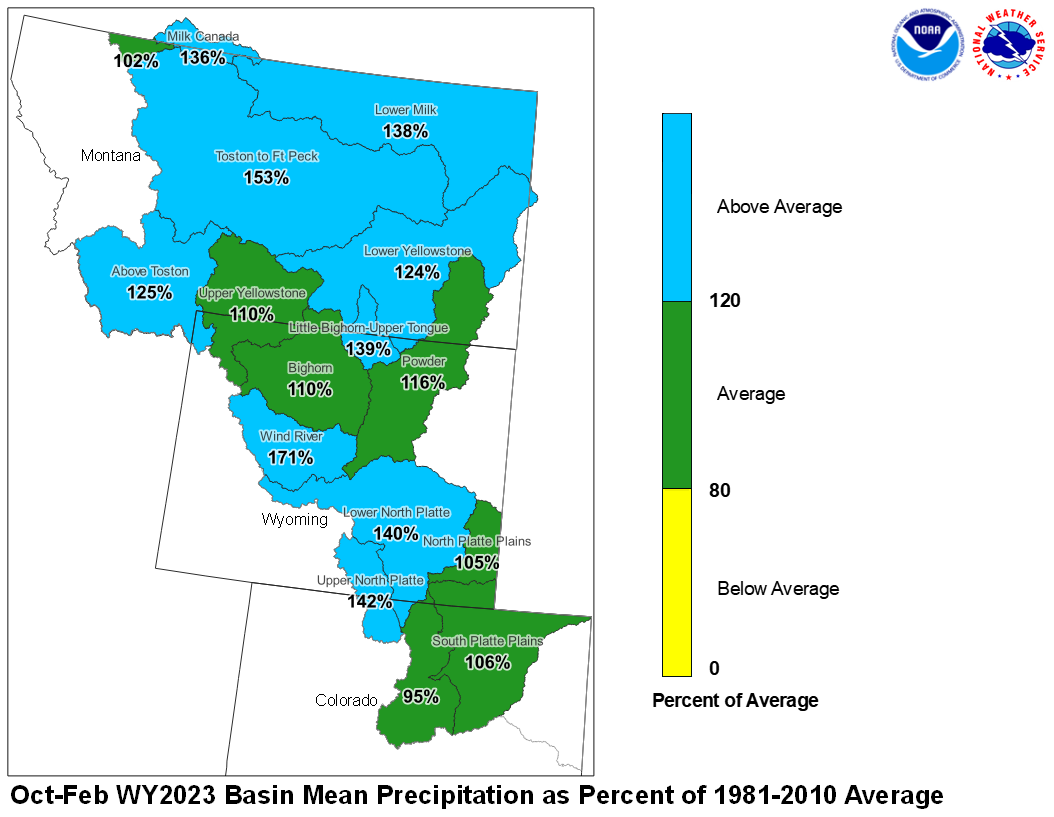
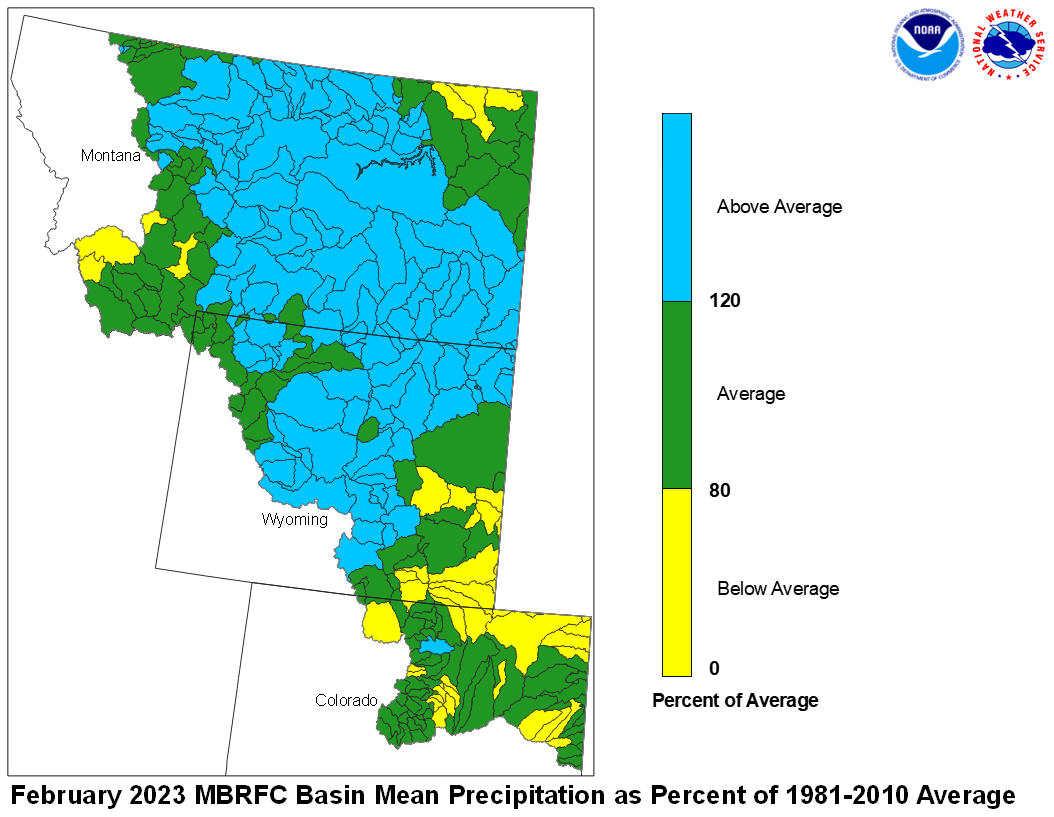
February precipitation across the Upper Missouri Basin was above average.
Basin precipitation summaries for the Missouri Basin include: Milk St. Mary,
103 percent; Milk Canada, 100 percent; Lower Milk, 124 percent; above Toston,
94 percent; Toston to Ft. Peck, 162 percent.
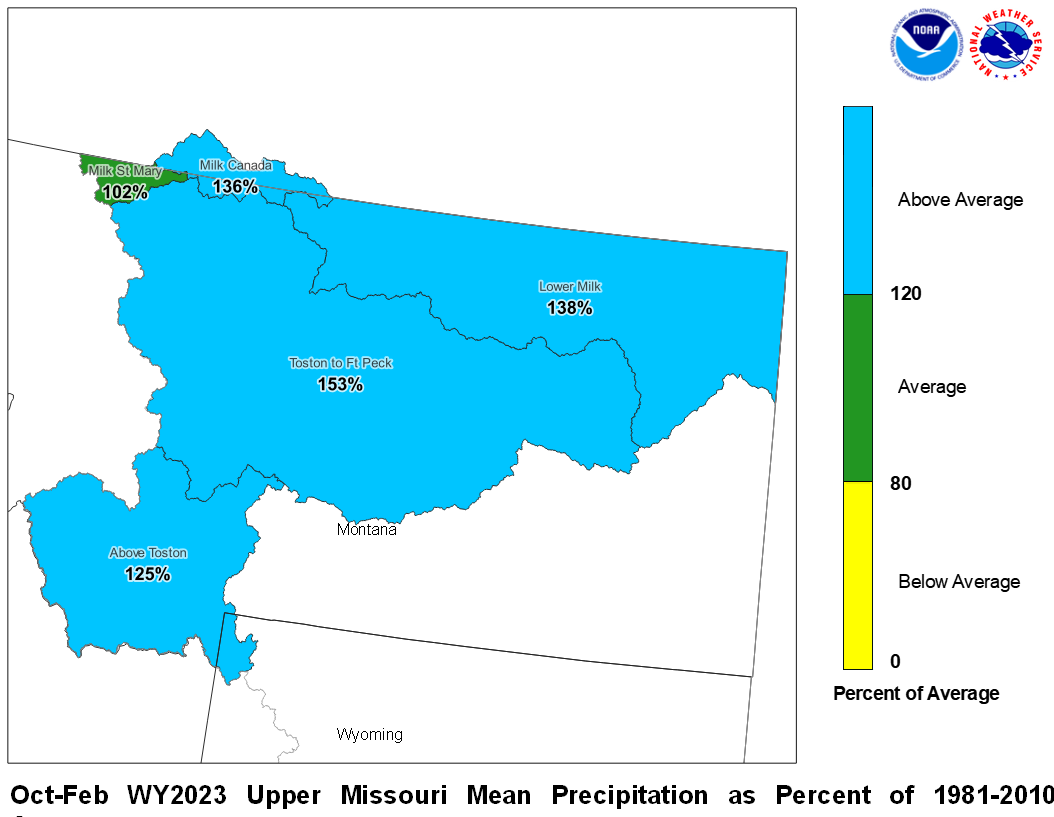
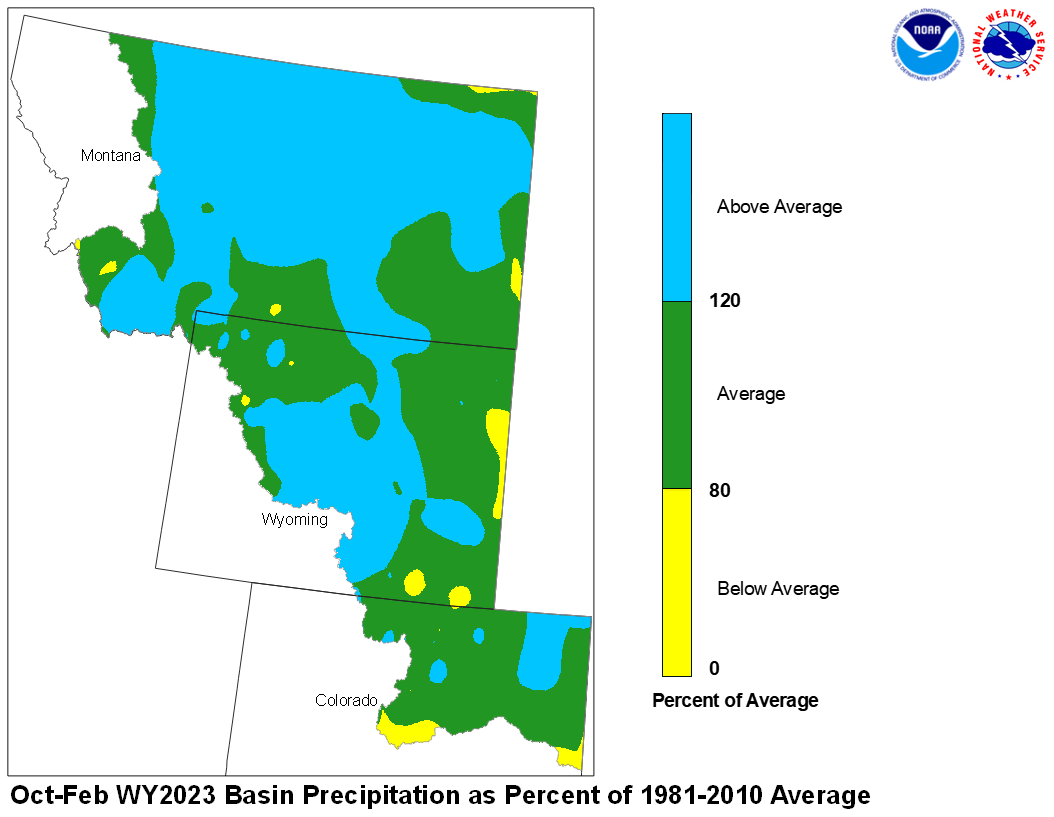
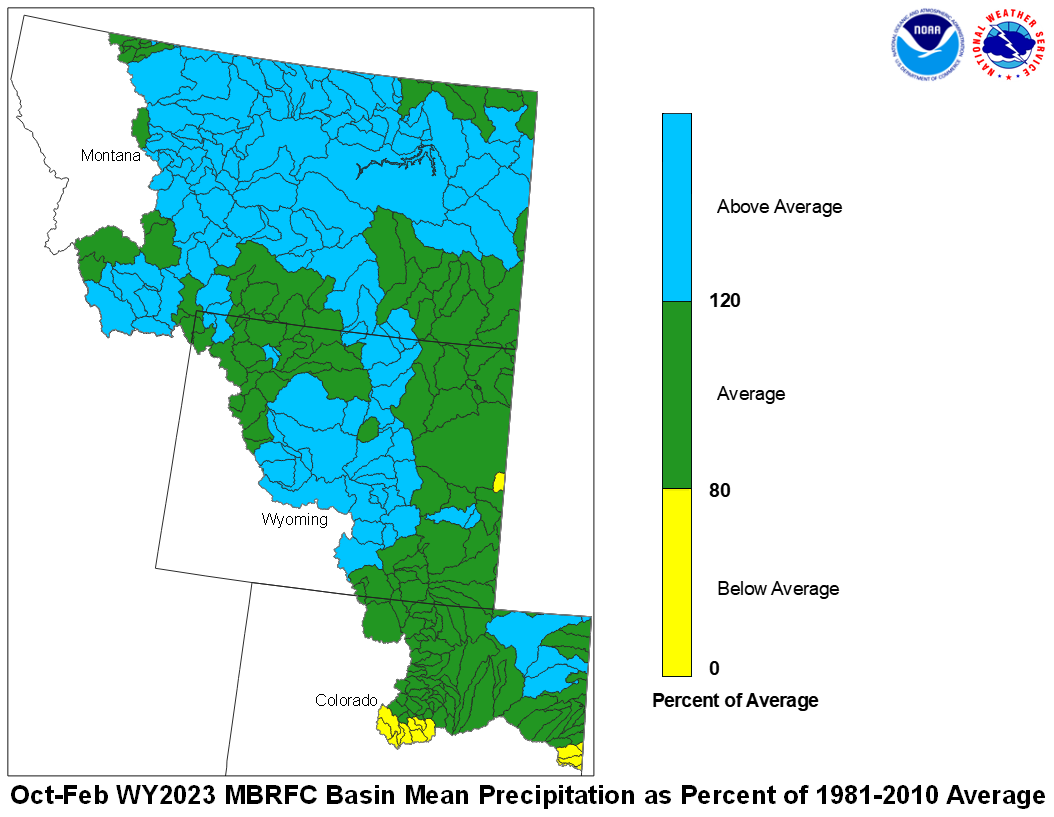
February 2023 Upper Missouri Mean Precip Oct-Feb WY2023 Upper Missouri Mean Precip
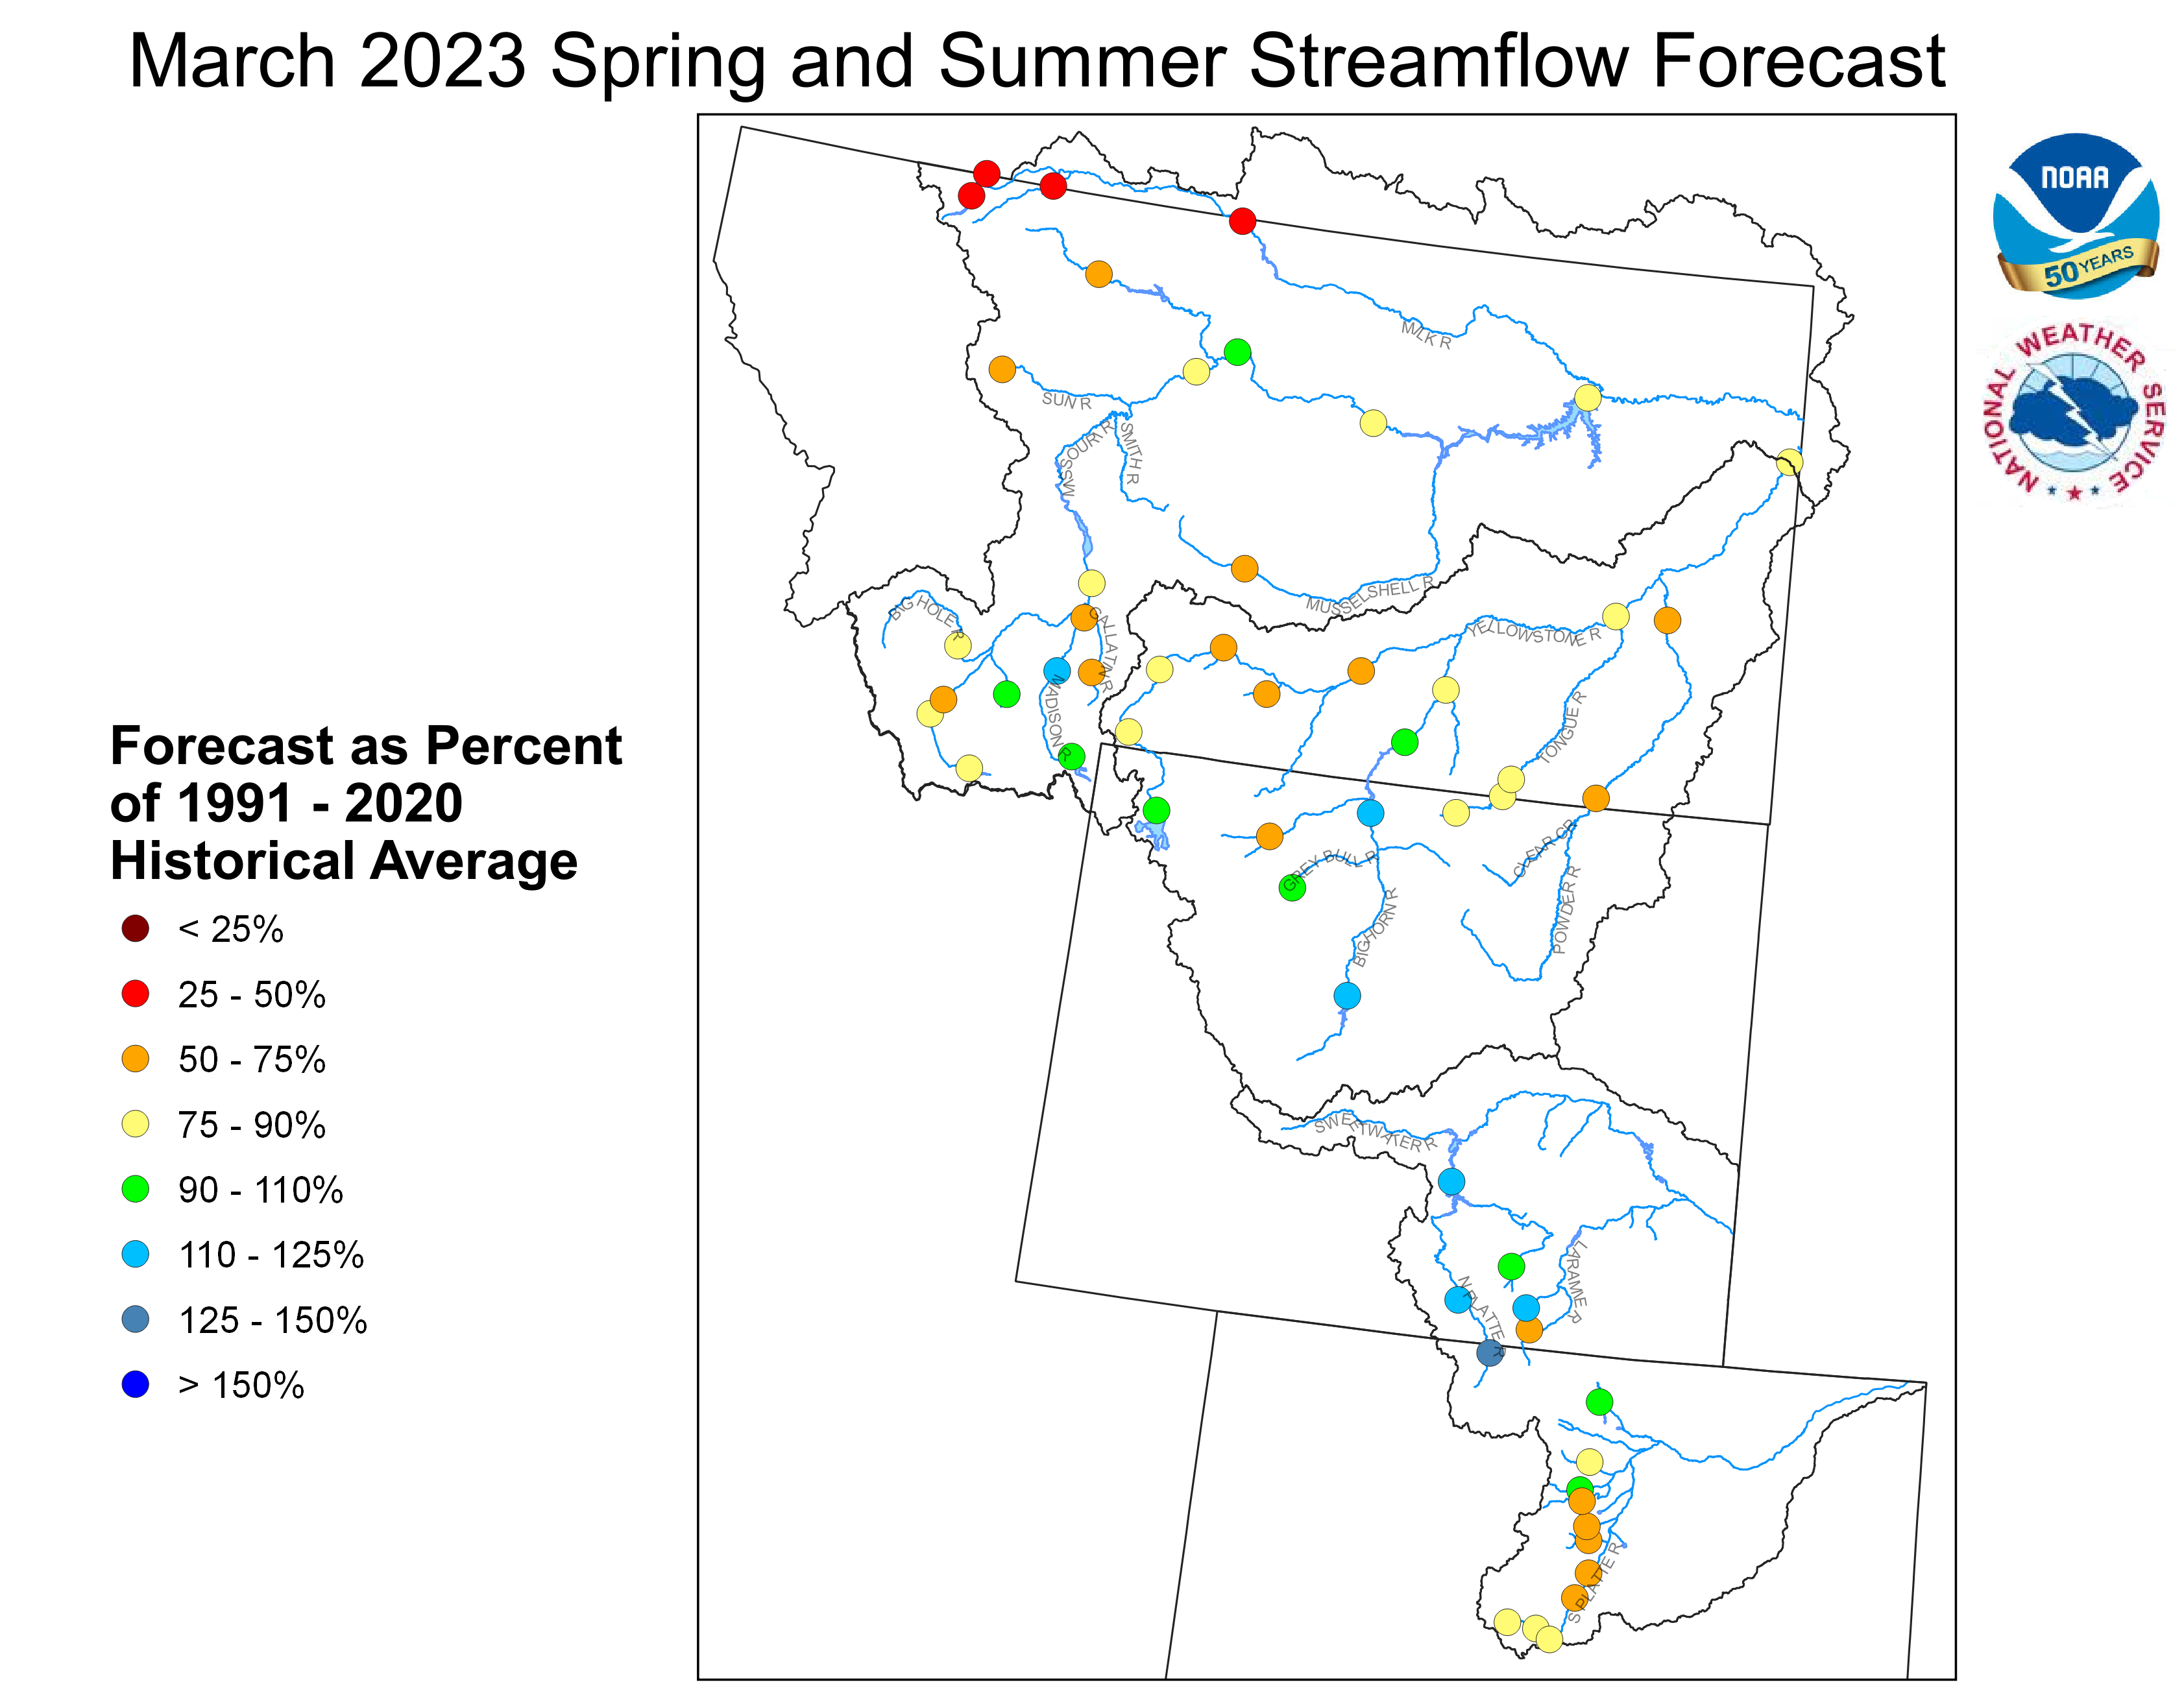
Stream flow in the Upper Missouri Basin is forecast to be
below average during the upcoming Spring and Summer.
The St. Mary River is forecast to have 44 percent of average
April-September flows. Runoff is expected to range around
89 percent of average for the Missouri Basin above Fort Peck,
Montana.
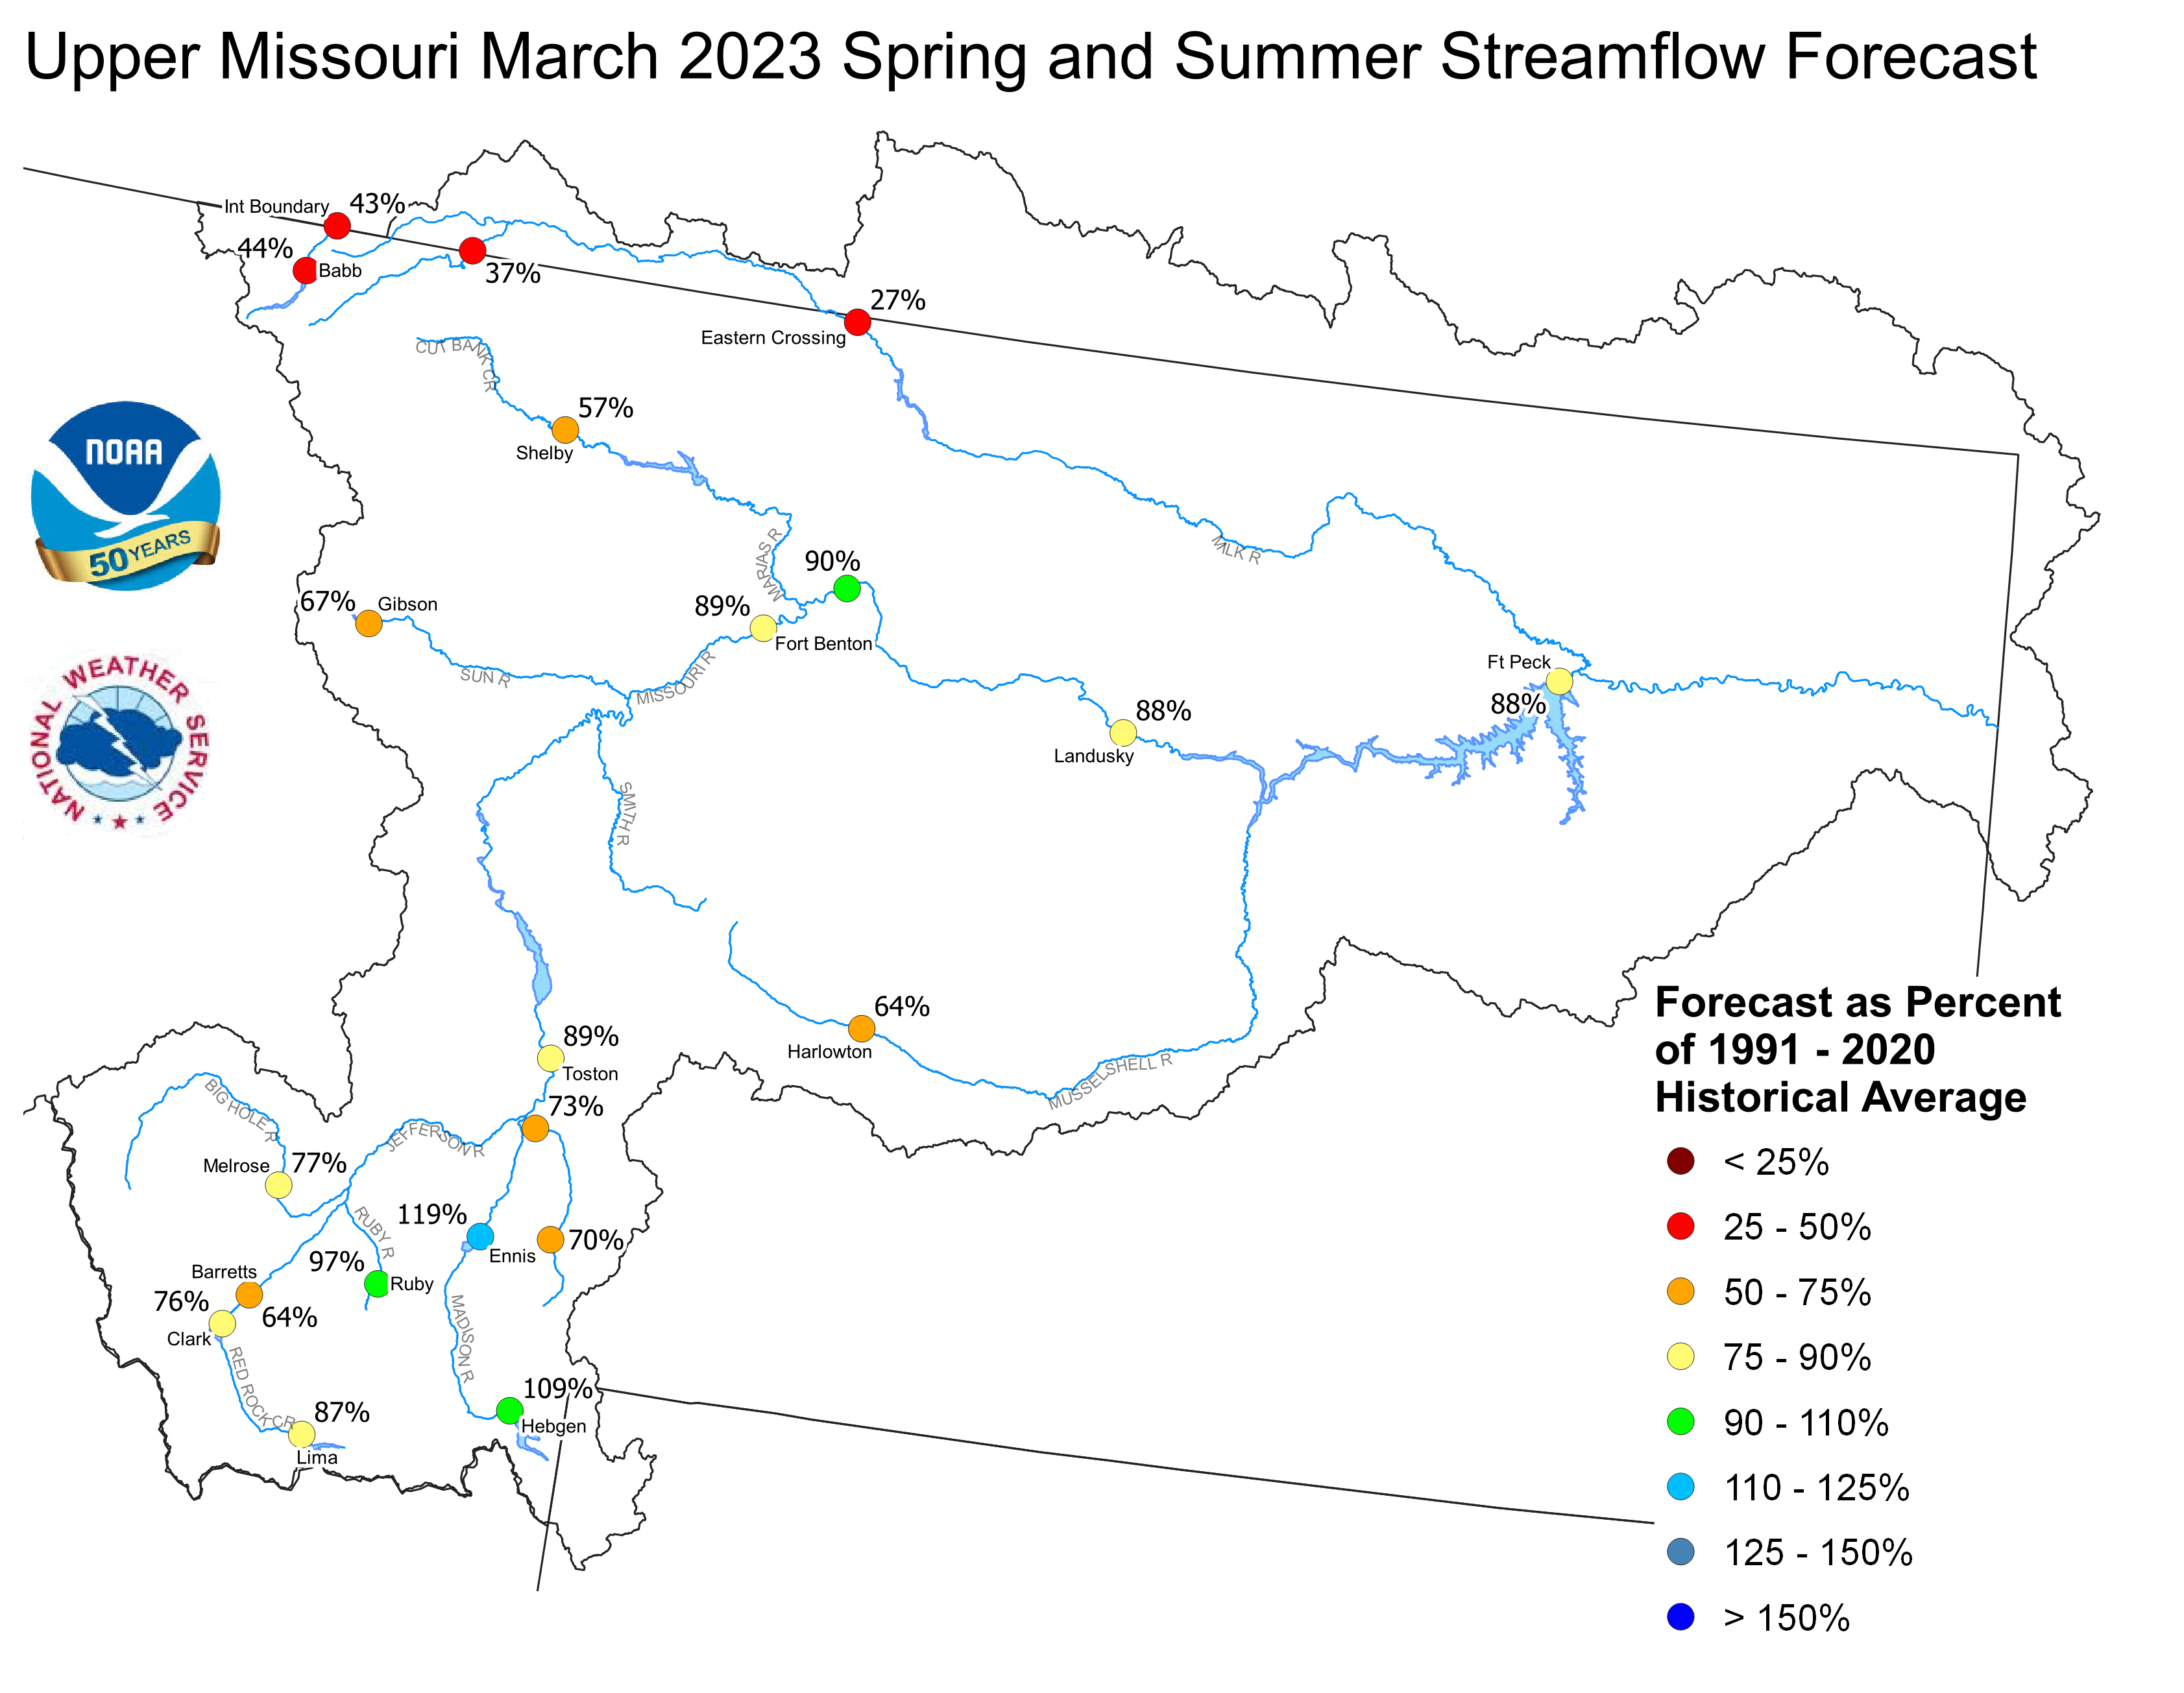
Upper Missouri March 1, 2023 Spring and Summer Streamflow Forecasts
Of the four major irrigation reservoirs in Montana; Lima
Reservoir had 61 percent average storage, Clark Canyon was
holding 83 percent of average water, Gibson Reservoir had 35
percent of average stored water, and Fresno Reservoir had
78 percent of average stored water.
Yellowstone Basin
The high elevation snow pack in the Yellowstone Basin was above average
on March 1. The snow pack in the Upper Yellowstone Basin was 105 percent
of average. The snow packs in the Wind, Bighorn, and Shoshone Basins were 125,
114, and 100 percent of average, respectively. The snow packs in the Tongue
and Powder basins were 115 and 117 percent of average, respectively.
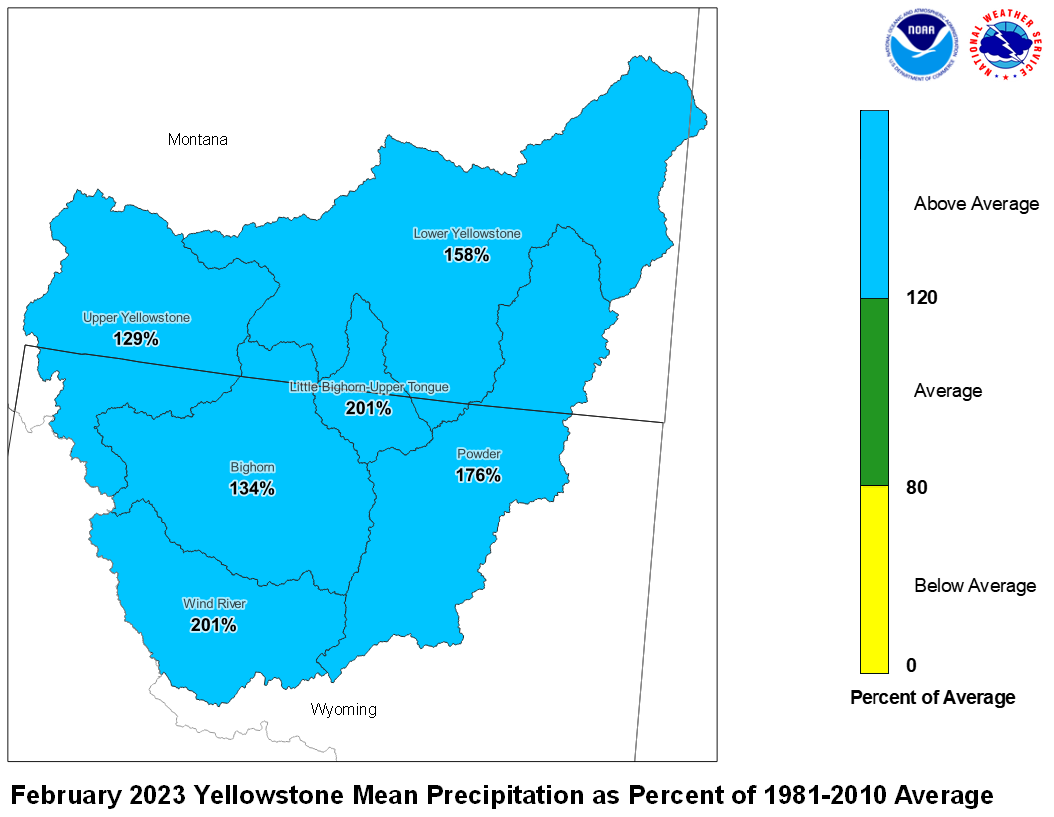
Precipitation during February was above average. The upper Yellowstone
River Basin received 129 percent of average precipitation while the
Lower Yellowstone River Basin reported 158 percent of average. The
Bighorn Basin received 134 percent of average precipitation while the
Wind River Basin received 201 percent of average. The Little Bighorn -
Upper Tongue Basin received 201 percent of average and the Powder River
had 176 percent of average precipitation.
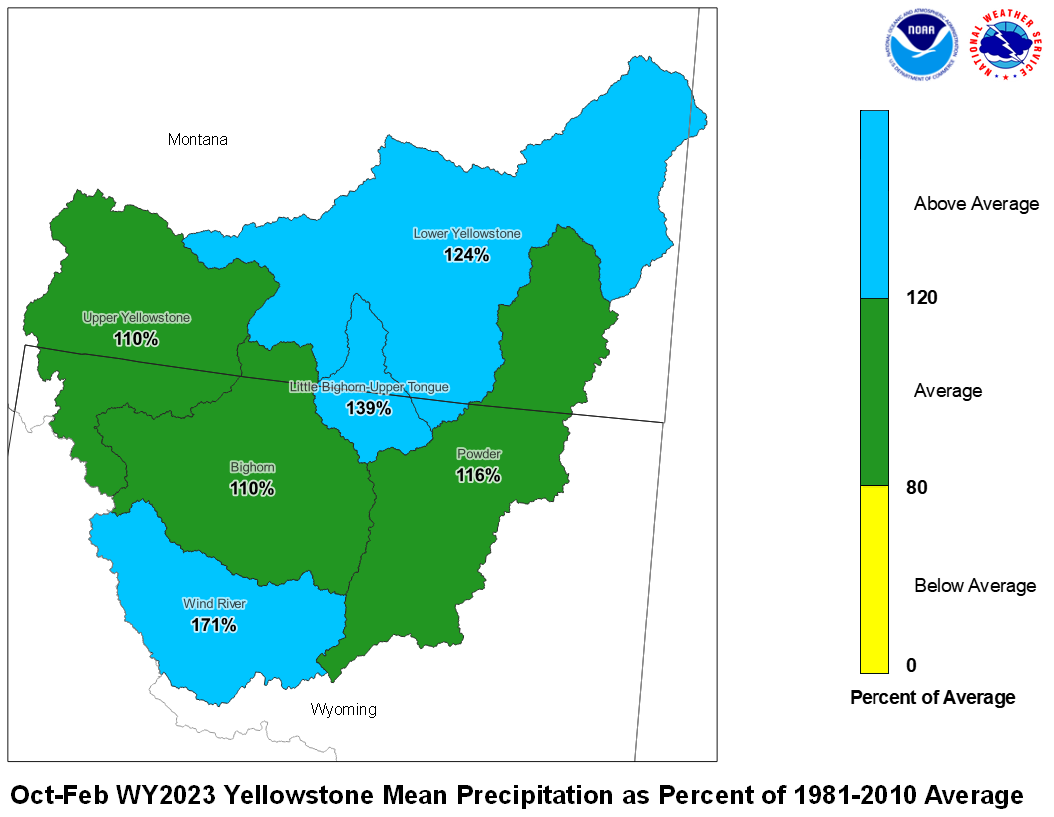
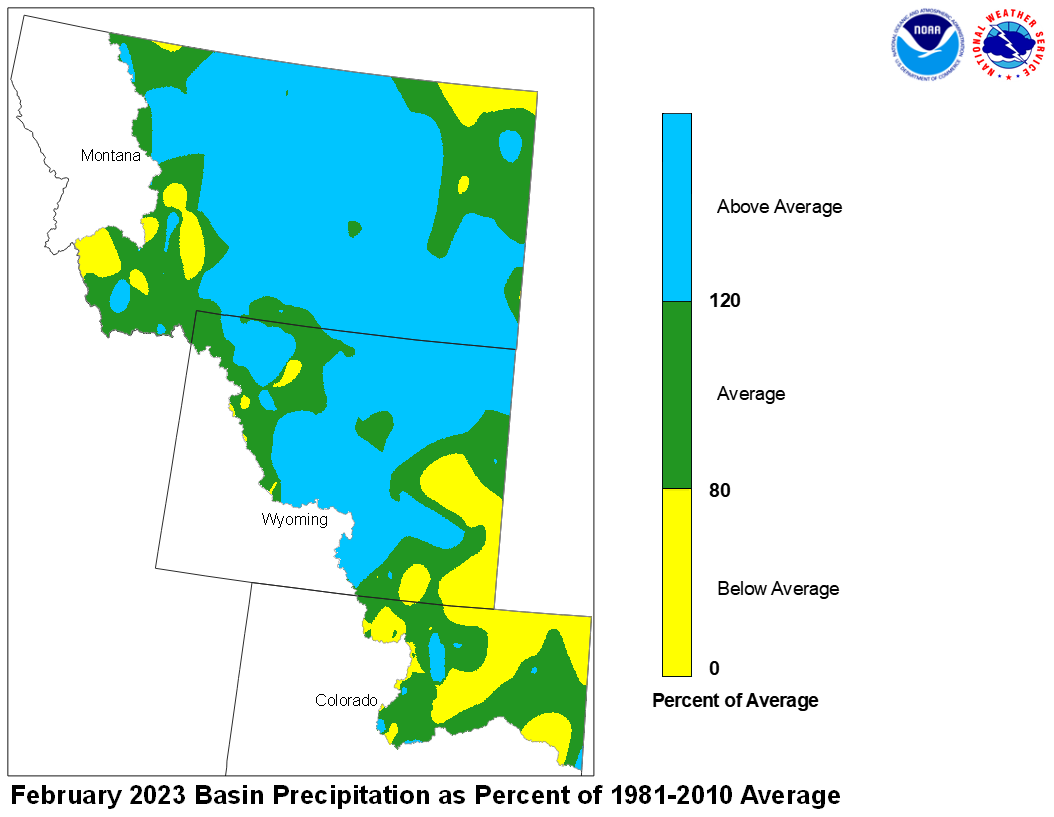
February 2023 Yellowstone Mean Precip Oct-Feb WY2023 Yellowstone Mean Precip
Forecast stream flow in the Yellowstone Basin is below average
for the upcoming Spring and Summer. Stream flow for the
Yellowstone River above Sidney, Montana is forecast to be about
80 percent of average. Flow in the Tongue Basin is expected to be
80 percent of average. Flows in the Powder River are expected
to be about 74 percent of average.
Monthend storage at Boysen Reservoir was 99 percent of average.
Stored water in Buffalo Bill Reservoir was 105 percent of average.
Monthend storage was 95 percent of average at Bighorn Reservoir.
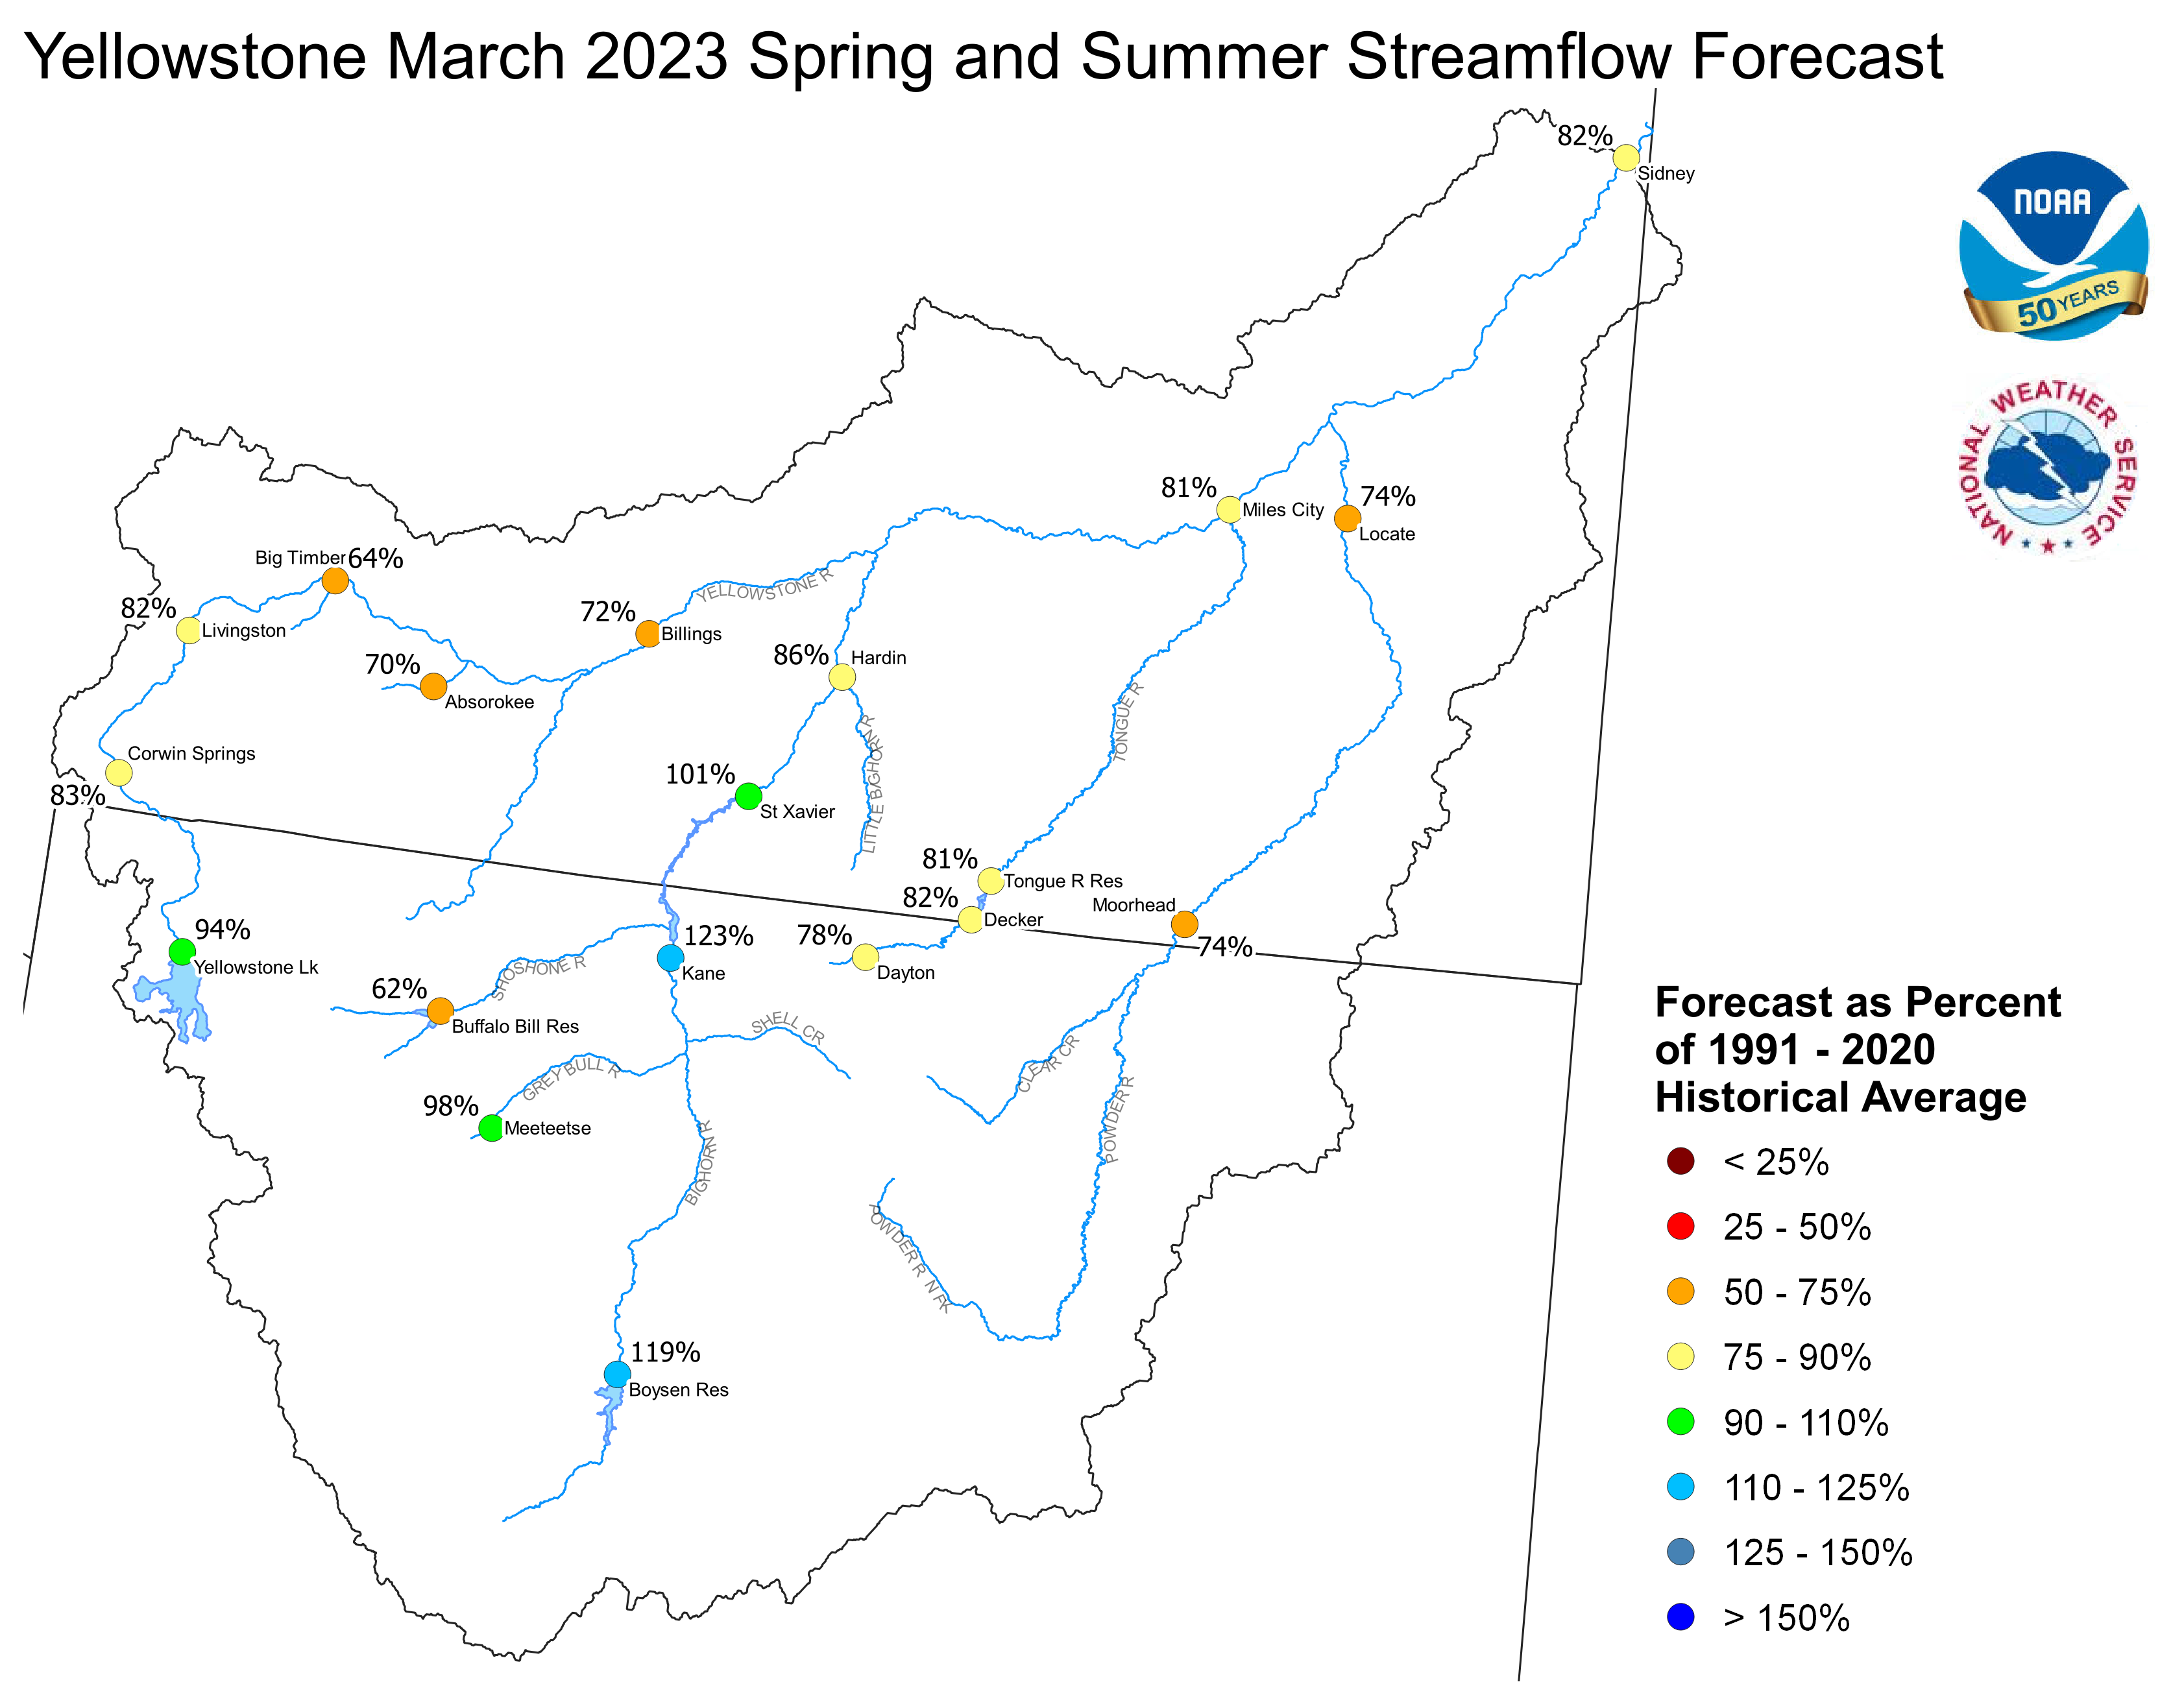
Yellowstone March 1, 2023 Spring and Summer Streamflow Forecasts
Platte Basin
The high elevation snow pack in the Upper North Platte Basin was
91 percent of average on March 1. The snow pack in the North Platte
Basin below Seminoe Reservoir was 97 percent of average. The snow
pack in the South Platte Basin was 101 percent of average.
Precipitation during February in the Upper North Platte Basin was 145
percent of average. In the Lower North Platte Basin, precipitation
was 154 percent of average. The North Platte Plains below Guernsy
Reservoir had 68 percent. The South Platte Mountains had 94
percent whereas the Plains had 71 percent of average February
precipitation.
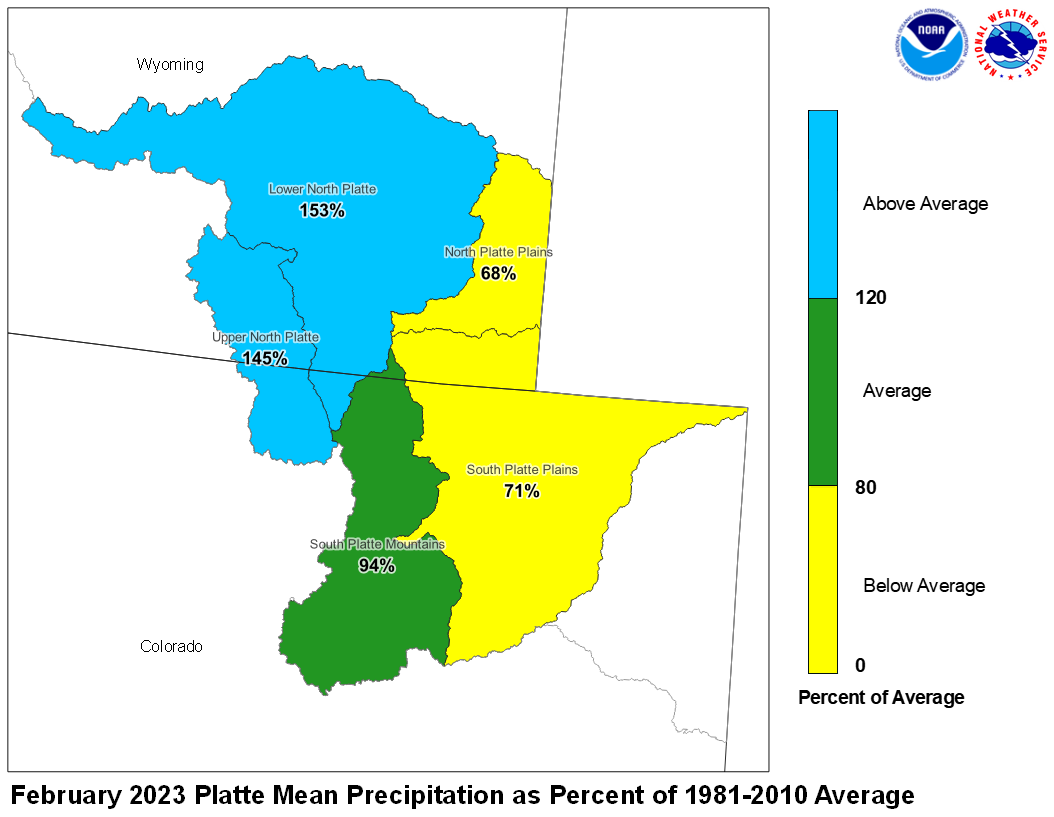
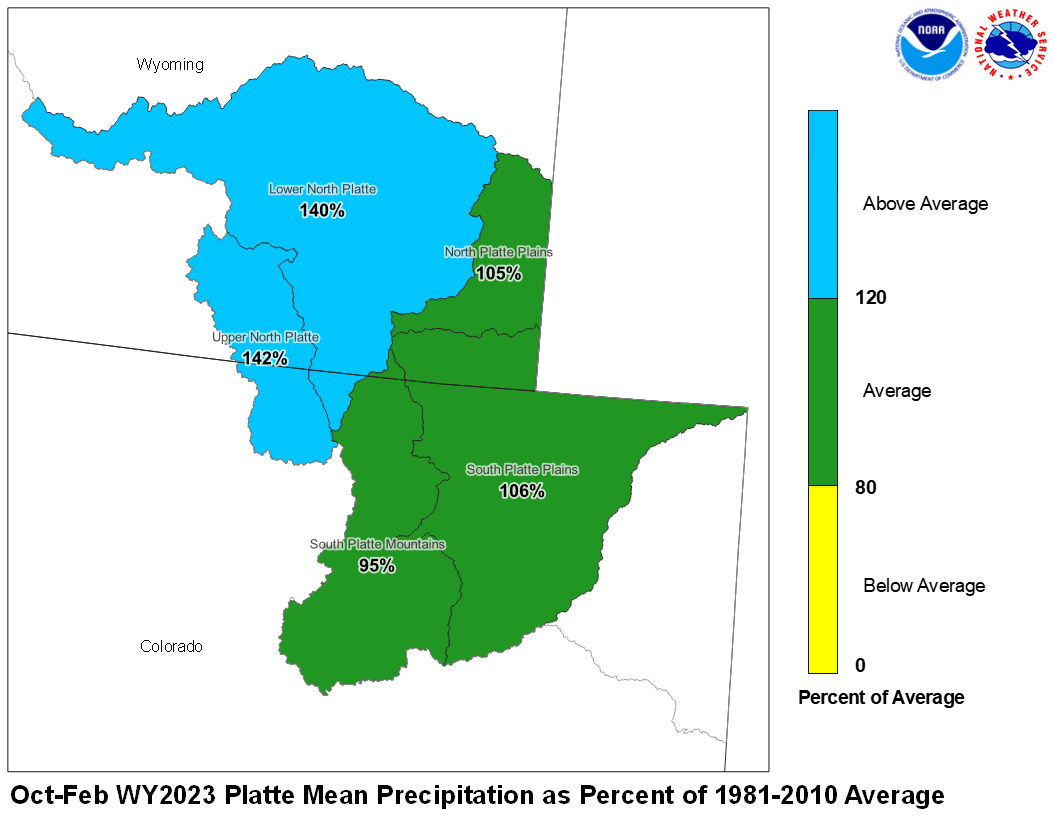
February 2023 Platte Mean Precip Oct-Feb WY2023 Platte Mean Precip
Stream flow in the Platte Basin is forecast to be below
average during the upcoming Spring and Summer. Runoff
for streams above Seminoe Reservoir are expected to be
about 98 percent of average. Streams in the South Platte
Basin above South Platte, Colorado can expect 80 percent
of average flow. For the remainder of the South Platte
basin, flows are expected near 84 percent.
Stored water in the South Platte Basin was 93 percent of average
on March 1.
North Platte Streamflow Fcst South Platte Streamflow Fcst
000
FGUS63 KKRF 051618
ESPKRF
WATER SUPPLY FORECAST
NWS MISSOURI BASIN RIVER FORECAST CENTER
PLEASANT HILL MISSOURI

0954 CST SUNDAY MARCH 05, 2023

DATA CURRENT AS OF: MARCH 01, 2023

MISSOURI/YELLOWSTONE/PLATTE RIVER BASIN FORECASTS


                                          50%   %   10%   90%   AVG
FORECAST POINT                   PERIOD  (KAF) AVG (KAF) (KAF) (KAF)
--------------------------------------------------------------------

Boysen Resvr Inflow              Apr-Sep  602   84  1283  252    720
 SBDW4

Boysen Resvr Inflow              Apr-Sep 1063  119  1838  626    890
 SBDW4N

Bighorn R at Kane                Apr-Sep 1055  107  1886  633    985
 LVEW4

Bighorn R at Kane                Apr-Sep 1773  123  2742 1015   1440
 LVEW4N

Greybull R at Meeteetse          Apr-Sep  200  102   288  108    196
 MEEW4

Greybull R at Meeteetse          Apr-Sep  200   98   288  108    205
 MEEW4N

Buffalo Bill Resvr Inflow        Apr-Sep  487   60   651  356    815
 CDYW4

Buffalo Bill Resvr Inflow        Apr-Sep  562   62   731  428    910
 CDYW4N

St. Mary R nr Babb               Apr-Sep  233   51   294  191    460
 SMYM8

St. Mary R nr Babb               Apr-Sep  238   44   301  198    535
 SMYM8N

St. Mary R at Intl Boundary      Apr-Sep  143   37   239   96    390
 SMBM8

St. Mary R at Intl Boundary      Apr-Sep  285   43   367  236    660
 SMBM8N

Milk R nr Western Crossing       Apr-Sep   10    9    28    5    113
 PDBM8

Milk R nr Western Crossing       Apr-Sep   15   37    40    7     41
 PDBM8N

Milk R nr Eastern Crossing       Apr-Sep  141   66   201  128    215
 ERNM8

Milk R nr Eastern Crossing       Apr-Sep   30   27   132   15    112
 ERNM8N

North Platte R nr Northgate      Apr-Sep  379  155   559  260    245
 NGTC2

North Platte R nr Northgate      Apr-Sep  433  147   612  310    295
 NGTC2N

Encampment R nr Encampment       Apr-Sep  171  110   235  135    156
 ECRW4

Encampment R nr Encampment       Apr-Sep  182  110   246  147    166
 ECRW4N

Rock Cr nr Arlington             Apr-Sep   51   96    64   41     53
 KCRW4

Rock Cr nr Arlington             Apr-Sep   52   98    65   41     53
 KCRW4N

Seminoe Resvr Inflow             Apr-Sep  922  121  1334  697    765
 SETW4

Seminoe Resvr Inflow             Apr-Sep 1097  119  1517  867    920
 SETW4N

Laramie R nr Woods Landing       Apr-Sep   68   63   117   33    108
 WODW4

Laramie R nr Woods Landing       Apr-Sep  103   73   153   66    142
 WODW4N

Little Laramie R nr Filmore      Apr-Sep   62  113    86   45     55
 SMTW4

Little Laramie R nr Filmore      Apr-Sep   64  112    89   47     57
 SMTW4N

Antero Resvr Inflow              Apr-Sep   11   79    18    6     14
 ANRC2

Antero Resvr Inflow              Apr-Sep   11   79    18    6     14
 ANRC2N

Spinney Mountain Resvr Inflow    Apr-Sep   41   72    67   30     57
 SPYC2

Spinney Mountain Resvr Inflow    Apr-Sep   37   82    66   19     45
 SPYC2N

Elevenmile Canyon Resvr Inflow   Apr-Sep   37   63    48   32     59
 EVNC2

Elevenmile Canyon Resvr Inflow   Apr-Sep   40   80    71   21     50
 EVNC2N

Cheesman Lk Inflow               Apr-Sep   61   61    94   43    100
 CHEC2

Cheesman Lk Inflow               Apr-Sep   65   70   119   36     93
 CHEC2N

S Platte R at S Platte           Apr-Sep  303  126   381  285    240
 SPTC2

S Platte R at S Platte           Apr-Sep  135   66   224   69    205
 SPTC2N

Bear Cr at Morrison              Apr-Sep   14   54    30    6     26
 MRRC2

Bear Cr at Morrison              Apr-Sep   14   54    30    6     26
 MRRC2N

Clear Cr at Golden               Apr-Sep   70   59   108   48    118
 GLDC2

Clear Cr at Golden               Apr-Sep   81   62   121   55    131
 GLDC2N

St. Vrain Cr at Lyons            Apr-Sep   63   80   103   43     79
 LNSC2

St. Vrain Cr at Lyons            Apr-Sep   89   82   140   63    109
 LNSC2N

Boulder Cr nr Orodell            Apr-Sep   34   72    53   22     47
 OROC2

Boulder Cr nr Orodell            Apr-Sep   49   94    70   35     52
 OROC2N

S Boulder Cr nr Eldorado Sprgs   Apr-Sep   27   77    36   17     35
 BELC2

S Boulder Cr nr Eldorado Sprgs   Apr-Sep   28   70    45   17     40
 BELC2N

Cache La Poudre at Canyon Mouth  Apr-Sep  179  166   279  103    108
 FTDC2

Cache La Poudre at Canyon Mouth  Apr-Sep  219  104   328  129    210
 FTDC2N

Lima Resvr Inflow                Apr-Sep   69   91   110   47     76
 LRRM8

Lima Resvr Inflow                Apr-Sep   69   87   110   47     79
 LRRM8N

Clark Canyon Resvr Inflow        Apr-Sep   64   58   109   52    110
 CLKM8

Clark Canyon Resvr Inflow        Apr-Sep  150   76   234  114    198
 CLKM8N

Beaverhead R at Barretts         Apr-Sep  141   71   186  131    199
 BARM8

Beaverhead R at Barretts         Apr-Sep  180   64   270  143    280
 BARM8N

Ruby R Resvr Inflow              Apr-Sep   94  107   116   76     88
 ALRM8

Ruby R Resvr Inflow              Apr-Sep   94   97   116   76     97
 ALRM8N

Big Hole R nr Melrose            Apr-Sep  444   75   705  323    595
 MLRM8

Big Hole R nr Melrose            Apr-Sep  509   77   768  387    660
 MLRM8N

Hebgen Resvr Inflow              Apr-Sep  509  109   581  438    465
 HBDM8

Hebgen Resvr Inflow              Apr-Sep  509  109   581  438    465
 HBDM8N

Ennis Resvr Inflow               Apr-Sep  790  110   918  665    715
 ELMM8

Ennis Resvr Inflow               Apr-Sep  868  119   998  733    730
 ELMM8N

Gallatin R nr Gateway            Apr-Sep  334   70   426  287    475
 GLGM8

Gallatin R nr Gateway            Apr-Sep  334   70   426  287    475
 GLGM8N

Gallatin R at Logan              Apr-Sep  325   64   485  252    505
 LOGM8

Gallatin R at Logan              Apr-Sep  477   73   611  400    650
 LOGM8N

Missouri R at Toston             Apr-Sep 1771   86  2536 1365   2060
 TOSM8

Missouri R at Toston             Apr-Sep 2516   89  3265 2073   2830
 TOSM8N

Missouri R at Fort Benton        Apr-Sep 1960   64  2674 1684   3060
 FBNM8

Missouri R at Fort Benton        Apr-Sep 3632   89  4546 2969   4100
 FBNM8N

Missouri R nr Virgelle           Apr-Sep 2085   61  2836 1790   3420
 VRGM8

Missouri R nr Virgelle           Apr-Sep 4082   90  5007 3236   4560
 VRGM8N

Missouri R nr Landusky           Apr-Sep 2236   61  3033 1910   3680
 LDKM8

Missouri R nr Landusky           Apr-Sep 4324   88  5284 3402   4890
 LDKM8N

Missouri R below Fort Peck Dam   Apr-Sep 2406   63  3280 1999   3840
 FPKM8

Missouri R below Fort Peck Dam   Apr-Sep 4542   88  5695 3527   5180
 FPKM8N

Gibson Resvr Inflow              Apr-Sep  302   67   437  226    450
 AGSM8

Gibson Resvr Inflow              Apr-Sep  302   67   437  226    450
 AGSM8N

Marias R nr Shelby               Apr-Sep  227   52   416  162    435
 SHLM8

Marias R nr Shelby               Apr-Sep  278   57   465  201    490
 SHLM8N

Musselshell R at Harlowton       Apr-Sep   48   60    95   27     80
 HLWM8

Musselshell R at Harlowton       Apr-Sep   61   64   104   35     95
 HLWM8N

Yellowstone R at Yellowstone Lk  Apr-Sep  640   79   791  523    815
 YLOW4

Yellowstone R at Yellowstone Lk  Apr-Sep  793   94   967  658    840
 YLOW4N

Yellowstone R at Corwin Sprgs    Apr-Sep 1464   74  1751 1197   1980
 CORM8

Yellowstone R at Corwin Sprgs    Apr-Sep 1710   83  2022 1409   2070
 CORM8N

Yellowstone R at Livingston      Apr-Sep 1664   73  2037 1385   2290
 LIVM8

Yellowstone R at Livingston      Apr-Sep 1994   82  2362 1656   2440
 LIVM8N

Yellowstone R at Billings        Apr-Sep 2446   60  3123 1926   4070
 BILM8

Yellowstone R at Billings        Apr-Sep 3427   72  4098 2832   4790
 BILM8N

Yellowstone R at Miles City      Apr-Sep 3861   66  5136 3279   5850
 MILM8

Yellowstone R at Miles City      Apr-Sep 6264   81  7790 5201   7690
 MILM8N

Yellowstone R at Sidney          Apr-Sep 3974   70  5290 3117   5710
 SIDM8

Yellowstone R at Sidney          Apr-Sep 6587   82  8274 5386   8060
 SIDM8N

Boulder R at Big Timber          Apr-Sep  197   59   262  152    335
 BTMM8

Boulder R at Big Timber          Apr-Sep  240   64   302  193    375
 BTMM8N

Stillwater R nr Absarokee        Apr-Sep  356   66   442  291    540
 SRAM8

Stillwater R nr Absarokee        Apr-Sep  415   70   495  350    595
 SRAM8N

Clks Fk Yellowstone R nr Belfry  Apr-Sep  395   64   484  300    620
 BFYM8

Clks Fk Yellowstone R nr Belfry  Apr-Sep  467   67   555  374    695
 BFYM8N

Bighorn R nr St. Xavier          Apr-Sep 1183   83  2010  866   1430
 STXM8

Bighorn R nr St. Xavier          Apr-Sep 2492  101  3497 1628   2460
 STXM8N

Little Bighorn R nr Hardin       Apr-Sep  109   86   240   70    127
 HRDM8

Little Bighorn R nr Hardin       Apr-Sep  109   86   240   70    127
 HRDM8N

Tongue R nr Dayton               Apr-Sep   73   76    97   49     96
 DAYW4

Tongue R nr Dayton               Apr-Sep   79   78   103   54    101
 DAYW4N

Tongue R nr Decker               Apr-Sep  147   63   230   72    235
 DSLM8

Tongue R nr Decker               Apr-Sep  196   82   280  119    240
 DSLM8N

Tongue R Resvr Inflow            Apr-Sep  150   64   245   74    235
 DKRM8

Tongue R Resvr Inflow            Apr-Sep  198   81   293  121    245
 DKRM8N

Powder R at Moorhead             Apr-Sep  156   69   333   67    225
 MHDM8

Powder R at Moorhead             Apr-Sep  199   74   377   99    270
 MHDM8N

Powder R nr Locate               Apr-Sep  181   70   388   80    260
 LOCM8

Powder R nr Locate               Apr-Sep  225   74   444  115    305
 LOCM8N


Locations with an `N` suffix indicate natural flows excluding
stream augmentations.

KAF: Thousands of Acre-feet

%AVG: Current 50%/AVG

AVG: Average(50%) seasonal runoff voulme as simulated by the river
forecast model considering acontinuous simulation of the basin
response to historic climate data (observed precipitation and
temperatures) over the period of 1991-2020.

The 50%, 10% and 90% columns indicate the probability that the
actual volume will exceed the forecast for the valid time period.

Beginning April 1, May and June official forecasts include observed
runoff volume up to official forecast date.

For more information, please visit: www.weather.gov/mbrfc/water


$$


