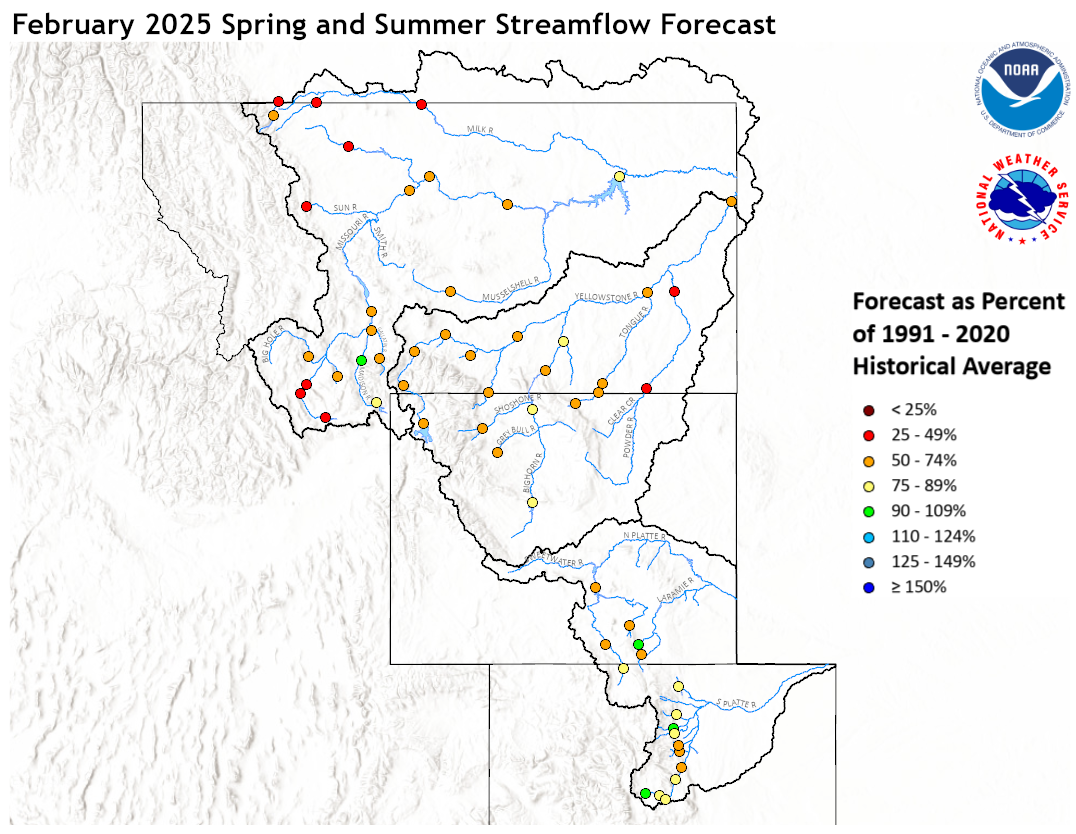
February 1, 2025 Spring and Summer Streamflow Forecasts
Upper Missouri Basin
The high elevation snow pack in the Upper Missouri Basin as of February 1
was below average. The snow pack in the St. Mary Basin was 67 percent,
and the Milk River Basin was 77 percent.
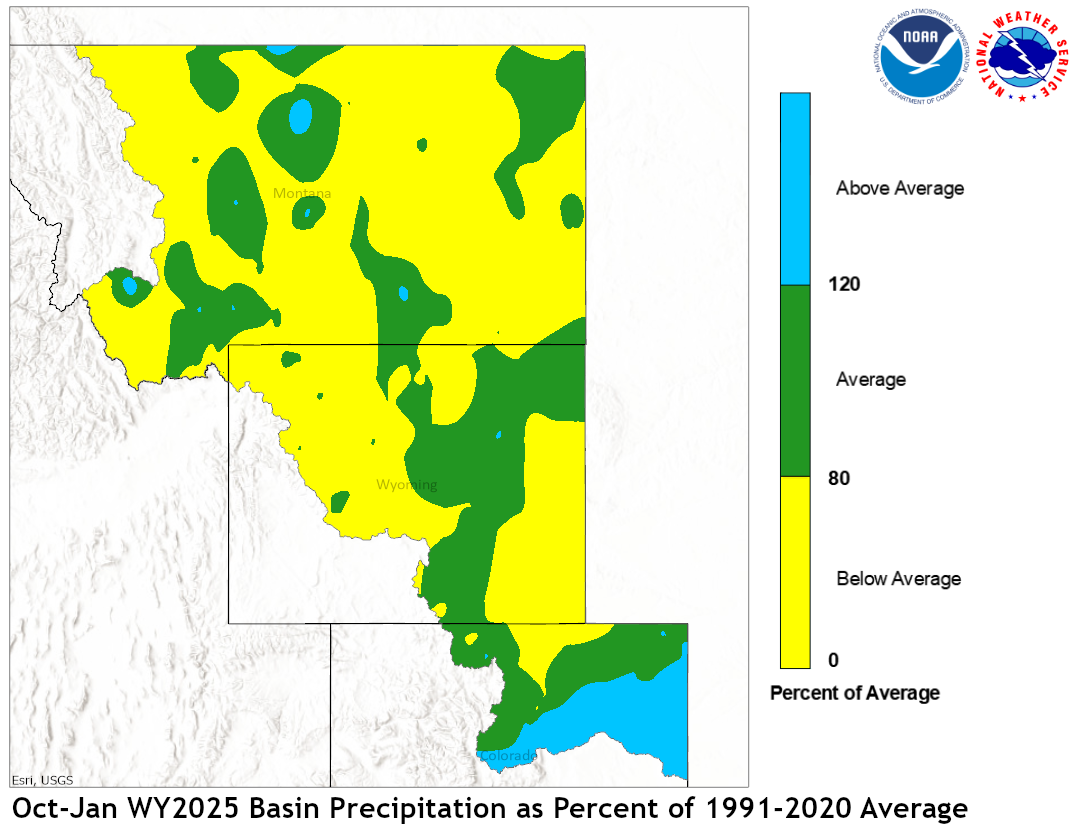
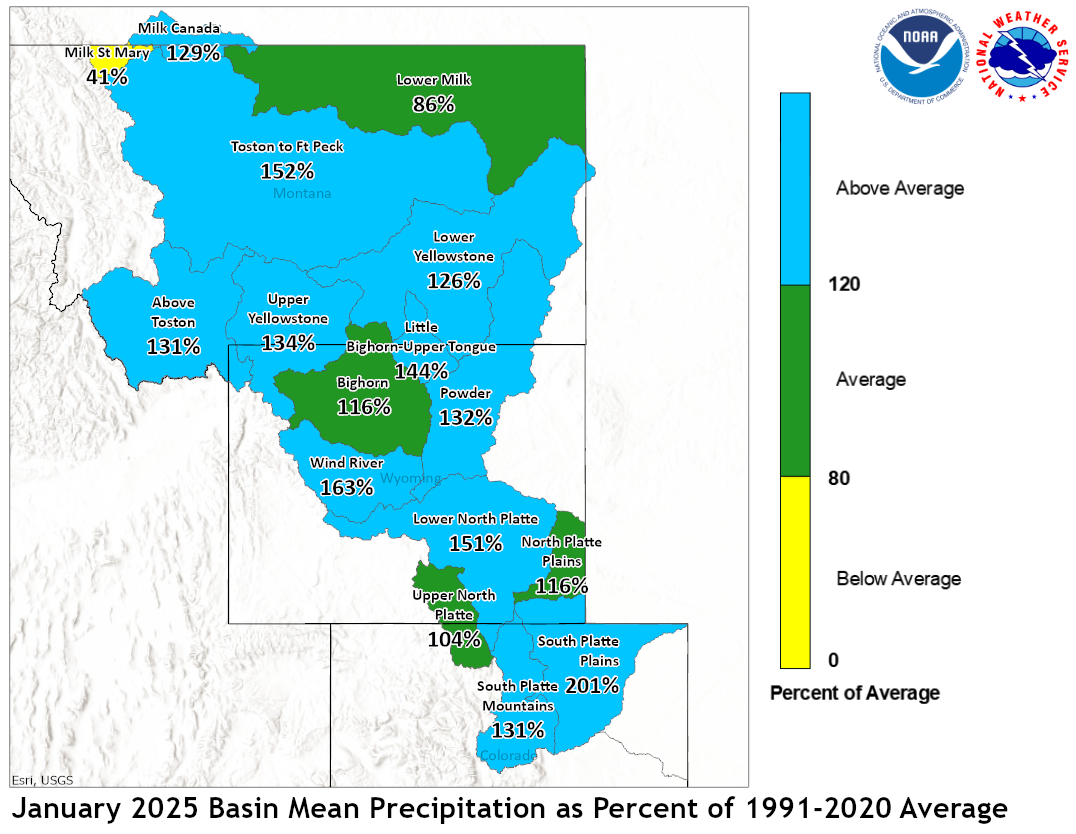
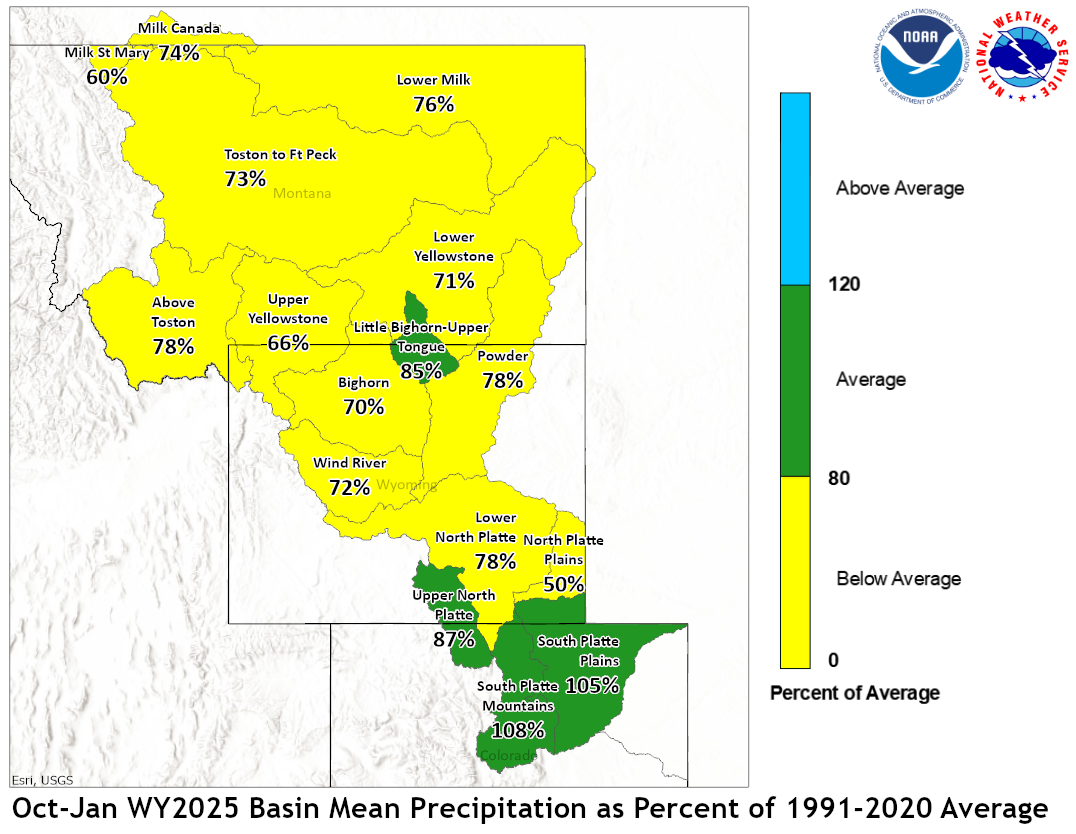
January precipitation across the Upper Missouri Basin was mostly below to above
average. Basin precipitation summaries for the Missouri Basin include: Milk St.
Mary, 41 percent; Milk Canada, 129 percent; Lower Milk, 86 percent; above Toston,
131 percent; Toston to Ft. Peck, 152 percent.
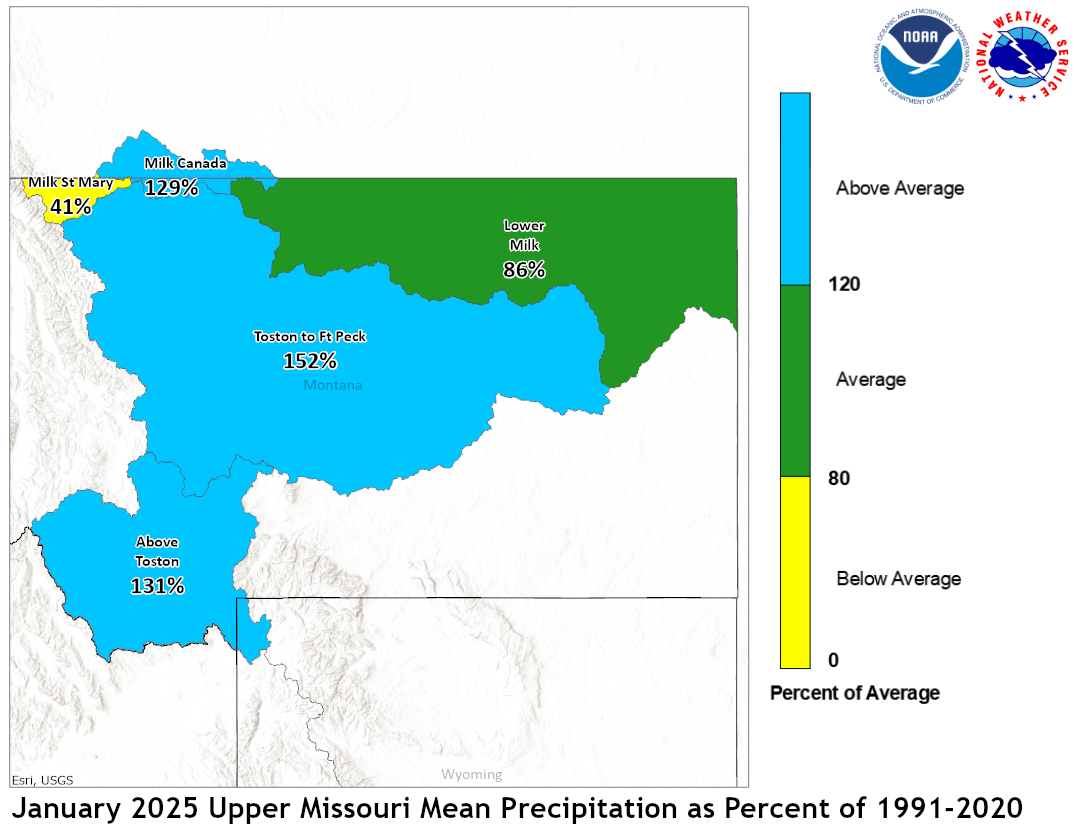
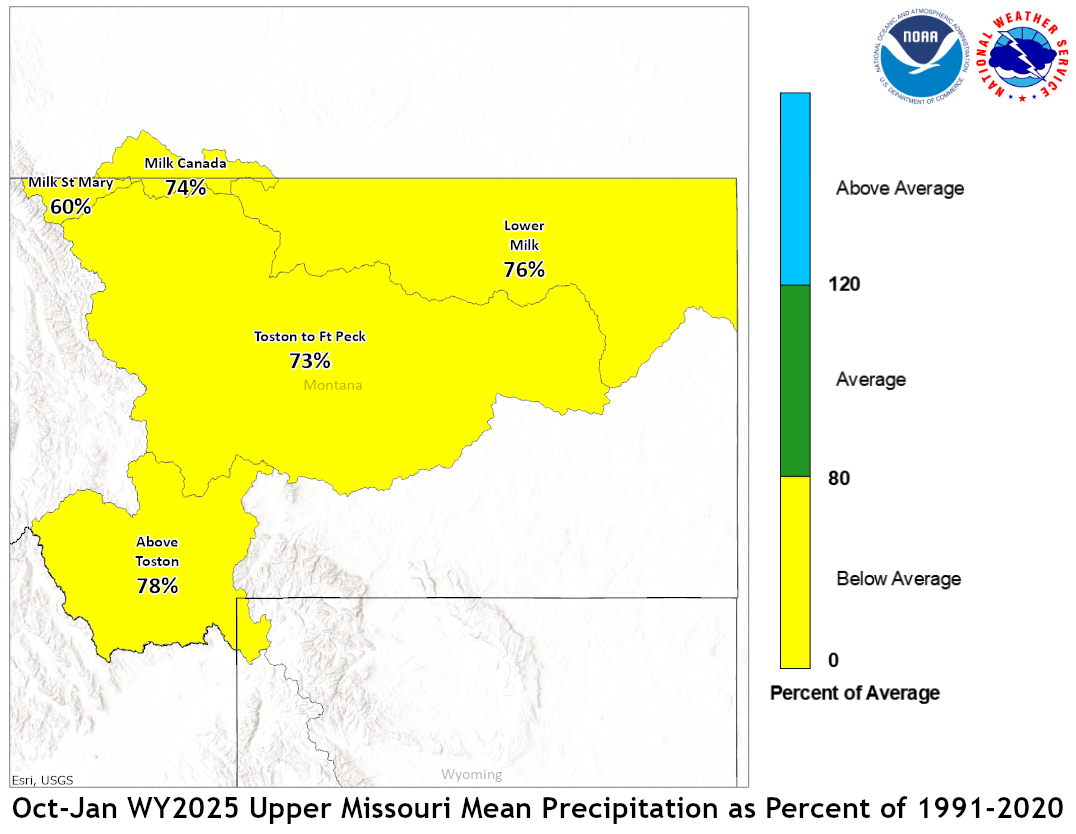
January 2025 Upper Missouri Mean Precip Oct-Jan WY2025 Upper Missouri Mean Precip
Stream flow in the Upper Missouri Basin is forecast to be
below average during the upcoming Spring and Summer.
The St. Mary River is forecast to have 49 percent of average
April-September flows. Runoff is expected to range around
74 percent of average for the Missouri Basin above Fort Peck,
Montana.
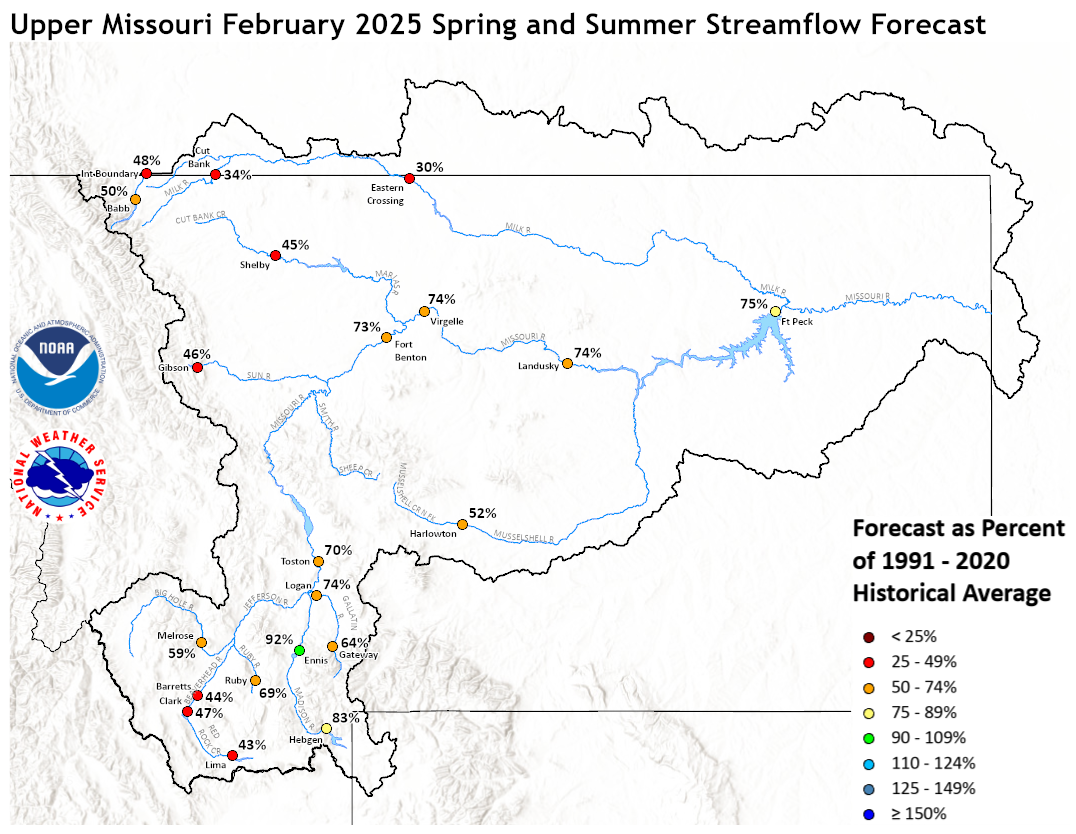
Upper Missouri February 1, 2025 Spring and Summer Streamflow Forecasts
Of the four major irrigation reservoirs in Montana; Lima
Reservoir had 101 percent average storage, Clark Canyon was
holding 120 percent of average water, Gibson Reservoir had 21
percent of average stored water, and Fresno Reservoir had
24 percent of average stored water.
Yellowstone Basin
The high elevation snow pack in the Yellowstone Basin was below average
on February 1. The snow pack in the Upper Yellowstone Basin was 79 percent
of average. The snow packs in the Wind, Bighorn, and Shoshone Basins were 79,
81, and 67 percent of average, respectively. The snow packs in the Tongue
and Powder basins were 95 and 81 percent of average, respectively.
Precipitation during January was above average. The upper Yellowstone
River Basin received 134 percent of average precipitation while the
Lower Yellowstone River Basin reported 126 percent of average. The
Bighorn Basin received 116 percent of average precipitation while the
Wind River Basin received 163 percent of average. The Little Bighorn -
Upper Tongue Basin received 144 percent of average and the Powder River
had 132 percent of average precipitation.
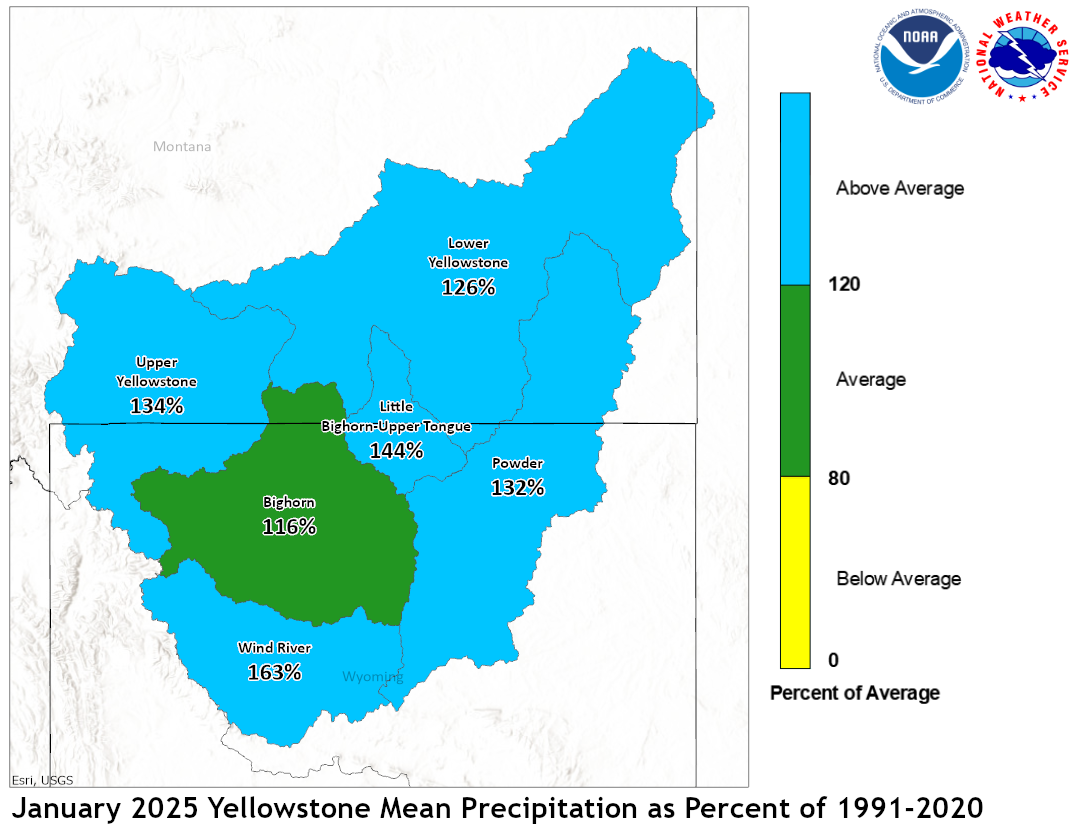
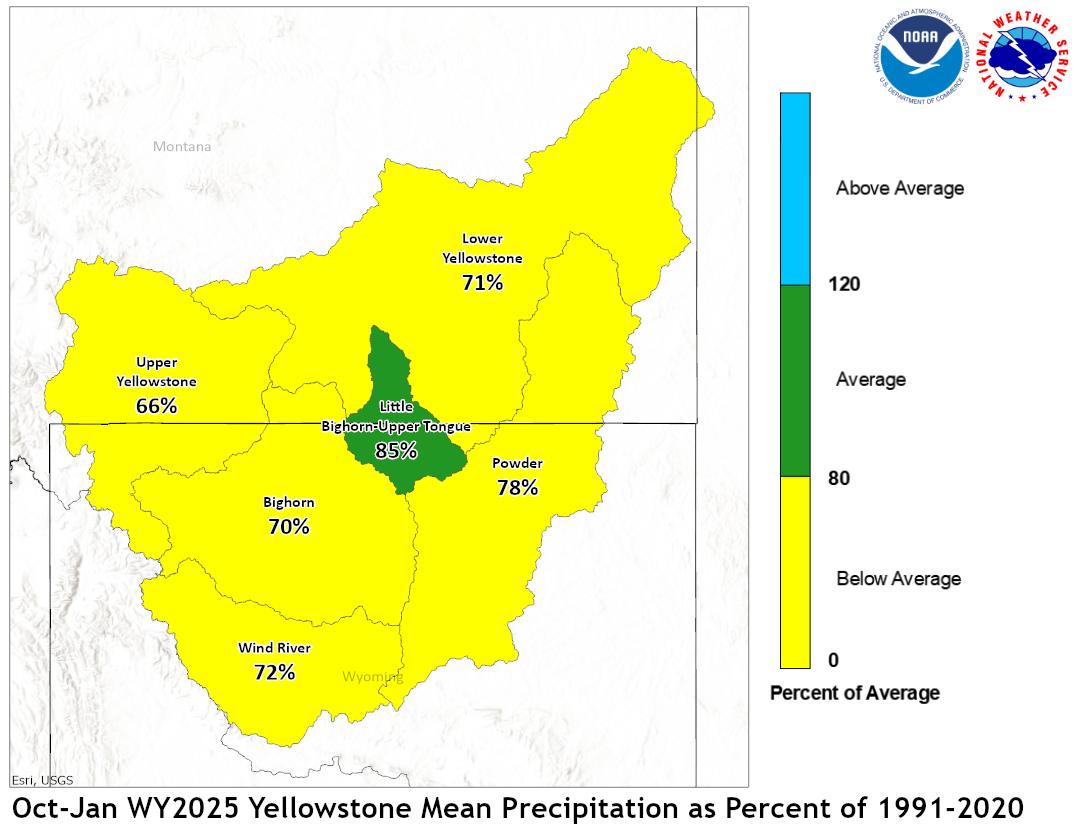
January 2025 Yellowstone Mean Precip Oct-Jan WY2025 Yellowstone Mean Precip
Forecast stream flow in the Yellowstone Basin is below average
for the upcoming Spring and Summer. Stream flow for the
Yellowstone River above Sidney, Montana is forecast to be about
66 percent of average. Flow in the Tongue Basin is expected to be
68 percent of average. Flows in the Powder River are expected
to be about 48 percent of average.
Monthend storage at Boysen Reservoir was 87 percent of average.
Stored water in Buffalo Bill Reservoir was 83 percent of average.
Monthend storage was 96 percent of average at Bighorn Reservoir.
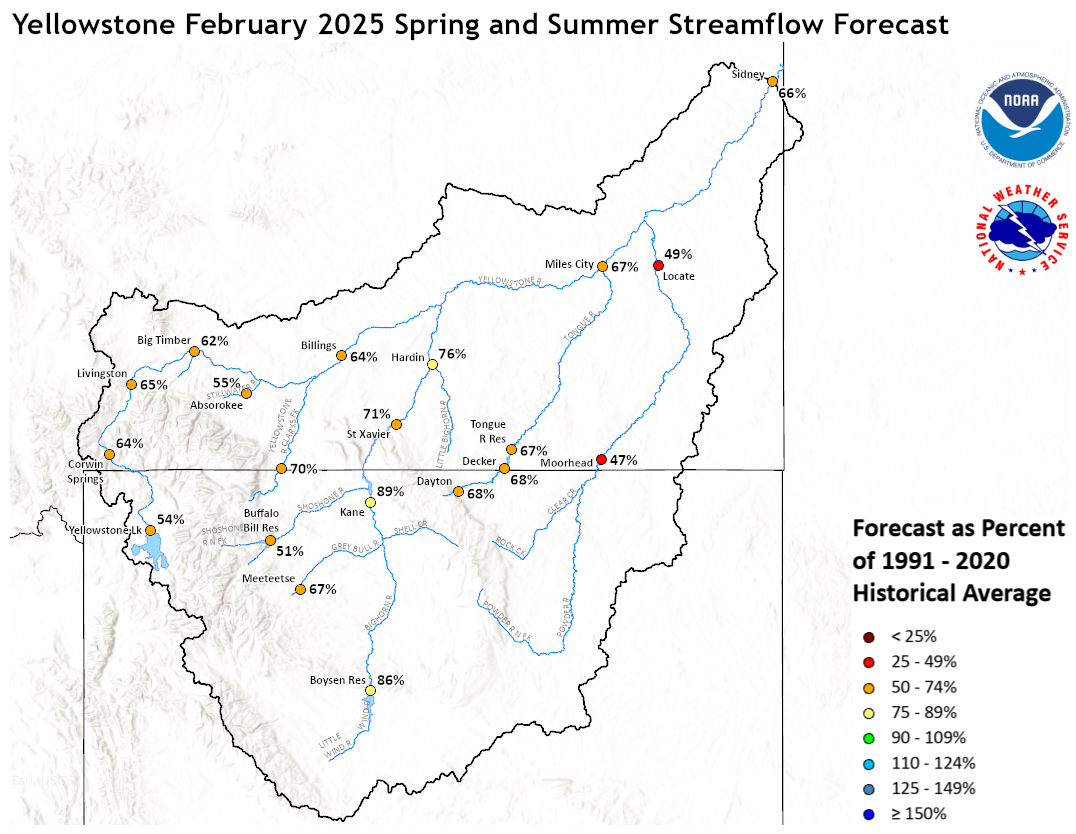
Yellowstone February 1, 2025 Spring and Summer Streamflow Forecasts
Platte Basin
The high elevation snow pack in the Upper North Platte Basin was
91 percent of average on February 1. The snow pack in the North Platte
Basin below Seminoe Reservoir was 85 percent of average. The snow
pack in the South Platte Basin was 105 percent of average.
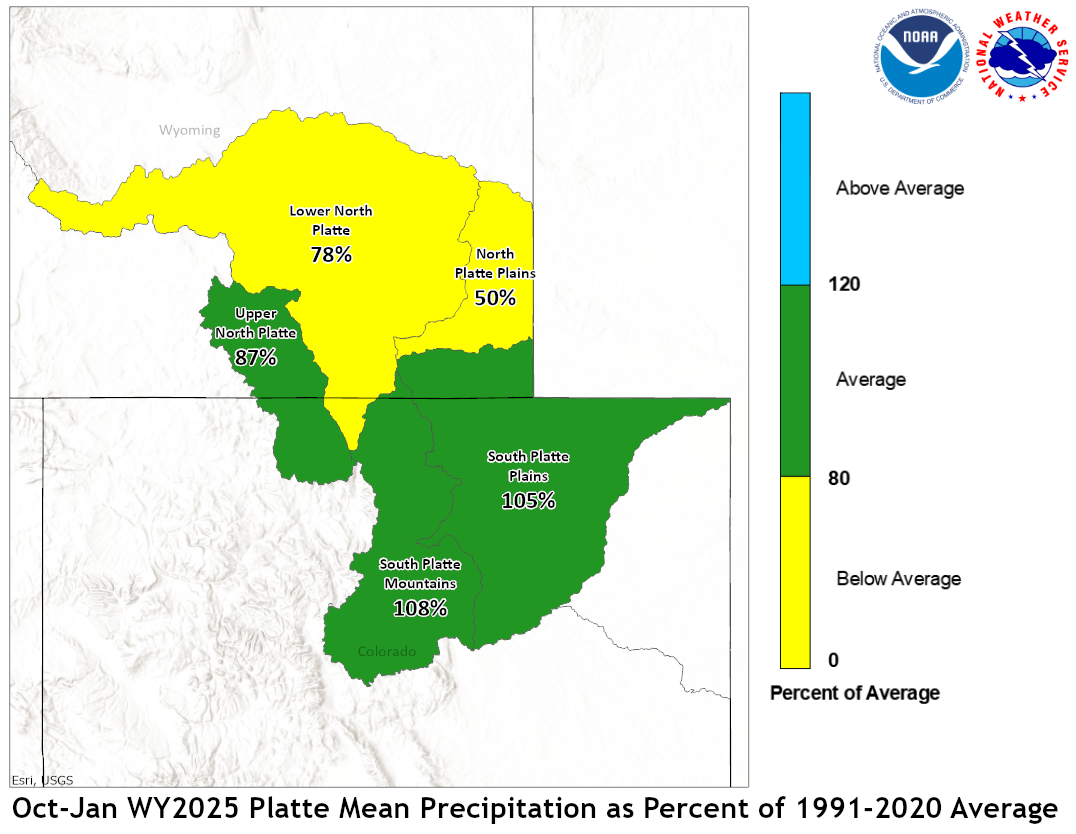
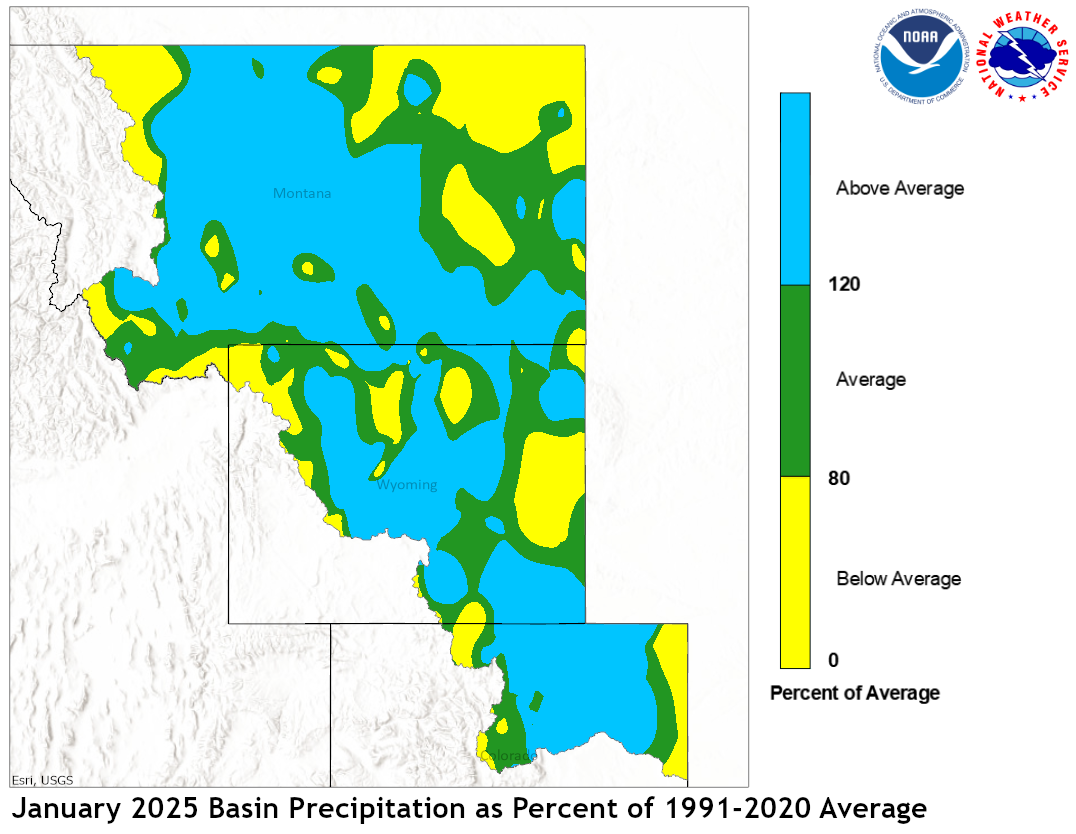
Precipitation during January in the Upper North Platte Basin was 104
percent of average. In the Lower North Platte Basin, precipitation
was 151 percent of average. The North Platte Plains below Guernsy
Reservoir had 116 percent. The South Platte Mountains had 131
percent whereas the Plains had 201 percent of average January
precipitation.

January 2025 Platte Mean Precip Oct-Jan WY2025 Platte Mean Precip
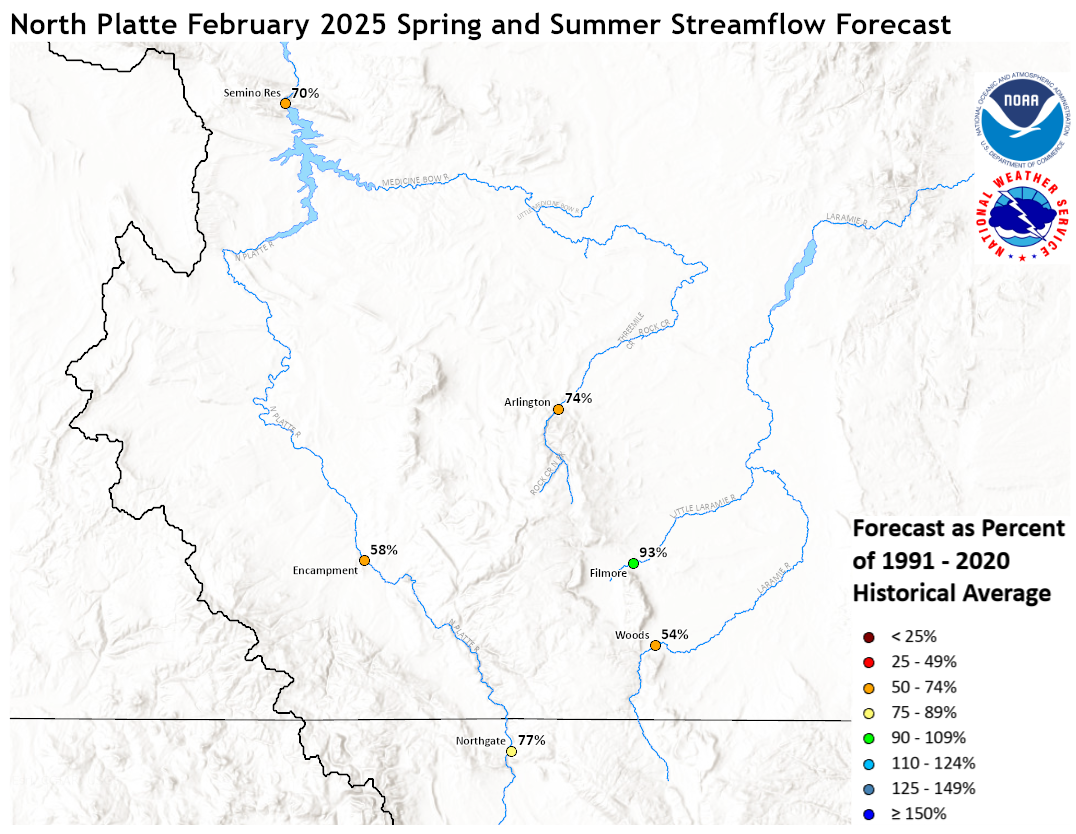
Stream flow in the Platte Basin is forecast to be near
average during the upcoming Spring and Summer. Runoff
for streams above Seminoe Reservoir are expected to be
about 70 percent of average. Streams in the South Platte
Basin above South Platte, Colorado can expect 79 percent
of average flow. For the remainder of the South Platte
basin, flows are expected near 89 percent.
Stored water in the South Platte Basin was 100 percent of average
on February 1.
North Platte Streamflow Fcst South Platte Streamflow Fcst
WATER SUPPLY FORECAST
NWS MISSOURI BASIN RIVER FORECAST CENTER
PLEASANT HILL MISSOURI

1408 CST THURSDAY FEBRUARY 06, 2025

DATA CURRENT AS OF: FEBRUARY 01, 2025

MISSOURI/YELLOWSTONE/PLATTE RIVER BASIN FORECASTS


                                          50%   %   10%   90%   AVG
FORECAST POINT                   PERIOD  (KAF) AVG (KAF) (KAF) (KAF)
--------------------------------------------------------------------

Boysen Resvr Inflow              Apr-Sep  353   49   834  126    720
 SBDW4

Boysen Resvr Inflow              Apr-Sep  764   86  1304  394    890
 SBDW4N

Bighorn R at Kane                Apr-Sep  692   70  1196  412    985
 LVEW4

Bighorn R at Kane                Apr-Sep 1277   89  2079  722   1440
 LVEW4N

Greybull R at Meeteetse          Apr-Sep  137   70   221   58    196
 MEEW4

Greybull R at Meeteetse          Apr-Sep  137   67   221   58    205
 MEEW4N

Buffalo Bill Resvr Inflow        Apr-Sep  386   47   660  276    815
 CDYW4

Buffalo Bill Resvr Inflow        Apr-Sep  467   51   753  342    910
 CDYW4N

Keyhole Resvr Inflow             Apr-Sep    6  150    16    2      4
 KEYW4

St. Mary R nr Babb               Apr-Sep  275   60   371  231    460
 SMYM8

St. Mary R nr Babb               Apr-Sep  268   50   365  222    535
 SMYM8N

St. Mary R at Intl Boundary      Apr-Sep  192   49   328  135    390
 SMBM8

St. Mary R at Intl Boundary      Apr-Sep  319   48   446  261    660
 SMBM8N

Milk R nr Western Crossing       Apr-Sep    9    8    27    4    113
 PDBM8

Milk R nr Western Crossing       Apr-Sep   14   34    38    5     41
 PDBM8N

Milk R nr Eastern Crossing       Apr-Sep  144   67   213  134    215
 ERNM8

Milk R nr Eastern Crossing       Apr-Sep   34   30   137   15    112
 ERNM8N

North Platte R nr Northgate      Apr-Sep  174   71   360   74    245
 NGTC2

North Platte R nr Northgate      Apr-Sep  227   77   413  124    295
 NGTC2N

Encampment R nr Encampment       Apr-Sep   85   54   130   51    156
 ECRW4

Encampment R nr Encampment       Apr-Sep   96   58   141   63    166
 ECRW4N

Rock Cr nr Arlington             Apr-Sep   39   74    55   27     53
 KCRW4

Rock Cr nr Arlington             Apr-Sep   39   74    55   28     53
 KCRW4N

Seminoe Resvr Inflow             Apr-Sep  491   64   770  252    765
 SETW4

Seminoe Resvr Inflow             Apr-Sep  647   70   925  403    920
 SETW4N

Laramie R nr Woods Landing       Apr-Sep   41   38   101   21    108
 WODW4

Laramie R nr Woods Landing       Apr-Sep   77   54   136   45    142
 WODW4N

Little Laramie R nr Filmore      Apr-Sep   51   93    86   35     55
 SMTW4

Little Laramie R nr Filmore      Apr-Sep   53   93    88   37     57
 SMTW4N

Antero Resvr Inflow              Apr-Sep   14  100    22    8     14
 ANRC2

Antero Resvr Inflow              Apr-Sep   14  100    22    8     14
 ANRC2N

Spinney Mountain Resvr Inflow    Apr-Sep   44   77    84   28     57
 SPYC2

Spinney Mountain Resvr Inflow    Apr-Sep   39   87    79   20     45
 SPYC2N

Elevenmile Canyon Resvr Inflow   Apr-Sep   37   63    57   31     59
 EVNC2

Elevenmile Canyon Resvr Inflow   Apr-Sep   41   82    82   22     50
 EVNC2N

Cheesman Lk Inflow               Apr-Sep   41   41    73   27    100
 CHEC2

Cheesman Lk Inflow               Apr-Sep   72   77   130   41     93
 CHEC2N

S Platte R at S Platte           Apr-Sep  297  124   372  264    240
 SPTC2

S Platte R at S Platte           Apr-Sep  136   66   229   75    205
 SPTC2N

Bear Cr at Morrison              Apr-Sep   14   54    28    7     26
 MRRC2

Bear Cr at Morrison              Apr-Sep   14   54    28    7     26
 MRRC2N

Clear Cr at Golden               Apr-Sep   84   71   128   51    118
 GLDC2

Clear Cr at Golden               Apr-Sep   96   73   141   59    131
 GLDC2N

St. Vrain Cr at Lyons            Apr-Sep   57   72    93   36     79
 LNSC2

St. Vrain Cr at Lyons            Apr-Sep   82   75   127   54    109
 LNSC2N

Boulder Cr nr Orodell            Apr-Sep   36   77    59   25     47
 OROC2

Boulder Cr nr Orodell            Apr-Sep   51   98    76   34     52
 OROC2N

S Boulder Cr nr Eldorado Sprgs   Apr-Sep   28   80    40   14     35
 BELC2

S Boulder Cr nr Eldorado Sprgs   Apr-Sep   31   78    48   14     40
 BELC2N

Cache La Poudre at Canyon Mouth  Apr-Sep  147  136   248   88    108
 FTDC2

Cache La Poudre at Canyon Mouth  Apr-Sep  187   89   288  102    210
 FTDC2N

Lima Resvr Inflow                Apr-Sep   34   45    61   22     76
 LRRM8

Lima Resvr Inflow                Apr-Sep   34   43    61   22     79
 LRRM8N

Clark Canyon Resvr Inflow        Apr-Sep   48   44    70   37    110
 CLKM8

Clark Canyon Resvr Inflow        Apr-Sep   94   47   142   61    198
 CLKM8N

Beaverhead R at Barretts         Apr-Sep  133   67   152  123    199
 BARM8

Beaverhead R at Barretts         Apr-Sep  123   44   173   86    280
 BARM8N

Ruby R Resvr Inflow              Apr-Sep   67   76    82   51     88
 ALRM8

Ruby R Resvr Inflow              Apr-Sep   67   69    82   51     97
 ALRM8N

Big Hole R nr Melrose            Apr-Sep  325   55   488  183    595
 MLRM8

Big Hole R nr Melrose            Apr-Sep  389   59   557  242    660
 MLRM8N

Hebgen Resvr Inflow              Apr-Sep  384   83   467  298    465
 HBDM8

Hebgen Resvr Inflow              Apr-Sep  384   83   467  298    465
 HBDM8N

Ennis Resvr Inflow               Apr-Sep  622   87   724  522    715
 ELMM8

Ennis Resvr Inflow               Apr-Sep  668   92   805  533    730
 ELMM8N

Gallatin R nr Gateway            Apr-Sep  304   64   391  245    475
 GLGM8

Gallatin R nr Gateway            Apr-Sep  304   64   391  245    475
 GLGM8N

Gallatin R at Logan              Apr-Sep  332   66   461  227    505
 LOGM8

Gallatin R at Logan              Apr-Sep  483   74   611  376    650
 LOGM8N

Missouri R at Toston             Apr-Sep 1331   65  1821  950   2060
 TOSM8

Missouri R at Toston             Apr-Sep 1990   70  2573 1514   2830
 TOSM8N

Missouri R at Fort Benton        Apr-Sep 1884   62  2045 1686   3060
 FBNM8

Missouri R at Fort Benton        Apr-Sep 3012   73  3747 2310   4100
 FBNM8N

Missouri R nr Virgelle           Apr-Sep 2014   59  2245 1793   3420
 VRGM8

Missouri R nr Virgelle           Apr-Sep 3354   74  4288 2510   4560
 VRGM8N

Missouri R nr Landusky           Apr-Sep 2214   60  2509 1929   3680
 LDKM8

Missouri R nr Landusky           Apr-Sep 3604   74  4641 2691   4890
 LDKM8N

Missouri R below Fort Peck Dam   Apr-Sep 2465   64  2812 2078   3840
 FPKM8

Missouri R below Fort Peck Dam   Apr-Sep 3880   75  4936 2848   5180
 FPKM8N

Gibson Resvr Inflow              Apr-Sep  206   46   358  144    450
 AGSM8

Gibson Resvr Inflow              Apr-Sep  206   46   358  144    450
 AGSM8N

Marias R nr Shelby               Apr-Sep  184   42   385  110    435
 SHLM8

Marias R nr Shelby               Apr-Sep  221   45   434  137    490
 SHLM8N

Musselshell R at Harlowton       Apr-Sep   40   50    74   20     80
 HLWM8

Musselshell R at Harlowton       Apr-Sep   49   52    83   26     95
 HLWM8N

Yellowstone R at Yellowstone Lk  Apr-Sep  263   32   360  203    815
 YLOW4

Yellowstone R at Yellowstone Lk  Apr-Sep  457   54   580  331    840
 YLOW4N

Yellowstone R at Corwin Sprgs    Apr-Sep 1085   55  1327  832   1980
 CORM8

Yellowstone R at Corwin Sprgs    Apr-Sep 1319   64  1613 1000   2070
 CORM8N

Yellowstone R at Livingston      Apr-Sep 1275   56  1547  991   2290
 LIVM8

Yellowstone R at Livingston      Apr-Sep 1577   65  1896 1239   2440
 LIVM8N

Yellowstone R at Billings        Apr-Sep 2123   52  2529 1406   4070
 BILM8

Yellowstone R at Billings        Apr-Sep 3073   64  3536 2331   4790
 BILM8N

Yellowstone R at Miles City      Apr-Sep 3093   53  4485 2388   5850
 MILM8

Yellowstone R at Miles City      Apr-Sep 5140   67  7090 3915   7690
 MILM8N

Yellowstone R at Sidney          Apr-Sep 3044   53  4432 2174   5710
 SIDM8

Yellowstone R at Sidney          Apr-Sep 5328   66  7348 3999   8060
 SIDM8N

Boulder R at Big Timber          Apr-Sep  192   57   254  129    335
 BTMM8

Boulder R at Big Timber          Apr-Sep  233   62   296  171    375
 BTMM8N

Stillwater R nr Absarokee        Apr-Sep  270   50   373  183    540
 SRAM8

Stillwater R nr Absarokee        Apr-Sep  328   55   427  242    595
 SRAM8N

Clks Fk Yellowstone R nr Belfry  Apr-Sep  415   67   543  304    620
 BFYM8

Clks Fk Yellowstone R nr Belfry  Apr-Sep  488   70   614  377    695
 BFYM8N

Bighorn R nr St. Xavier          Apr-Sep  802   56  1082  608   1430
 STXM8

Bighorn R nr St. Xavier          Apr-Sep 1746   71  2710 1147   2460
 STXM8N

Little Bighorn R nr Hardin       Apr-Sep   97   76   279   64    127
 HRDM8

Little Bighorn R nr Hardin       Apr-Sep   97   76   279   64    127
 HRDM8N

Tongue R nr Dayton               Apr-Sep   64   67    80   41     96
 DAYW4

Tongue R nr Dayton               Apr-Sep   69   68    86   47    101
 DAYW4N

Tongue R nr Decker               Apr-Sep  116   49   175   55    235
 DSLM8

Tongue R nr Decker               Apr-Sep  162   68   225   95    240
 DSLM8N

Tongue R Resvr Inflow            Apr-Sep  117   50   183   55    235
 DKRM8

Tongue R Resvr Inflow            Apr-Sep  164   67   233   96    245
 DKRM8N

Powder R at Moorhead             Apr-Sep   98   44   235   35    225
 MHDM8

Powder R at Moorhead             Apr-Sep  127   47   274   47    270
 MHDM8N

Powder R nr Locate               Apr-Sep  116   45   277   38    260
 LOCM8

Powder R nr Locate               Apr-Sep  148   49   314   51    305
 LOCM8N


Locations with an `N` suffix indicate natural flows excluding
stream augmentations.

KAF: Thousands of Acre-feet

%AVG: Current 50%/AVG

AVG: Average(50%) seasonal runoff voulme as simulated by the river
forecast model considering acontinuous simulation of the basin
response to historic climate data (observed precipitation and
temperatures) over the period of 1991-2020.

The 50%, 10% and 90% columns indicate the probability that the
actual volume will exceed the forecast for the valid time period.

Beginning April 1, May and June official forecasts include observed
runoff volume up to official forecast date.

For more information, please visit: www.weather.gov/mbrfc/water

