February 1, 2023 Spring and Summer Streamflow Forecasts
Upper Missouri Basin
The high elevation snow pack in the Upper Missouri Basin as of February 1
was near to above average. The snow pack in the St. Mary Basin was 85 percent,
and the Milk River Basin was 172 percent.
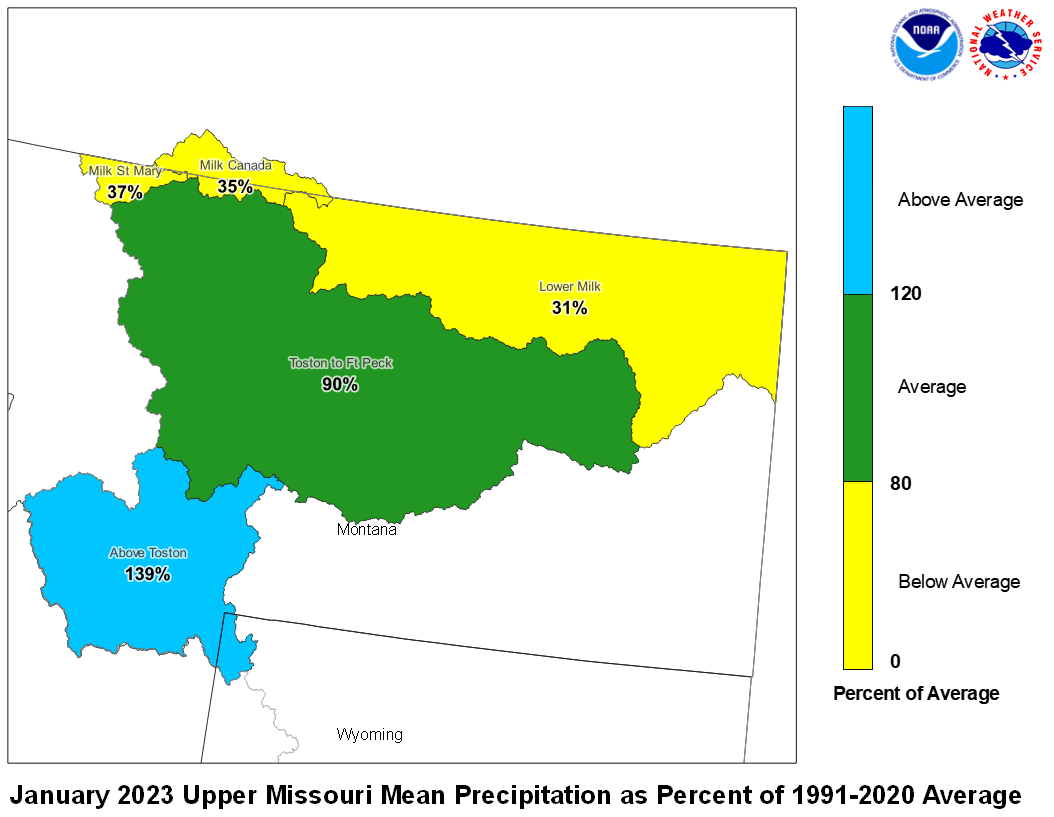
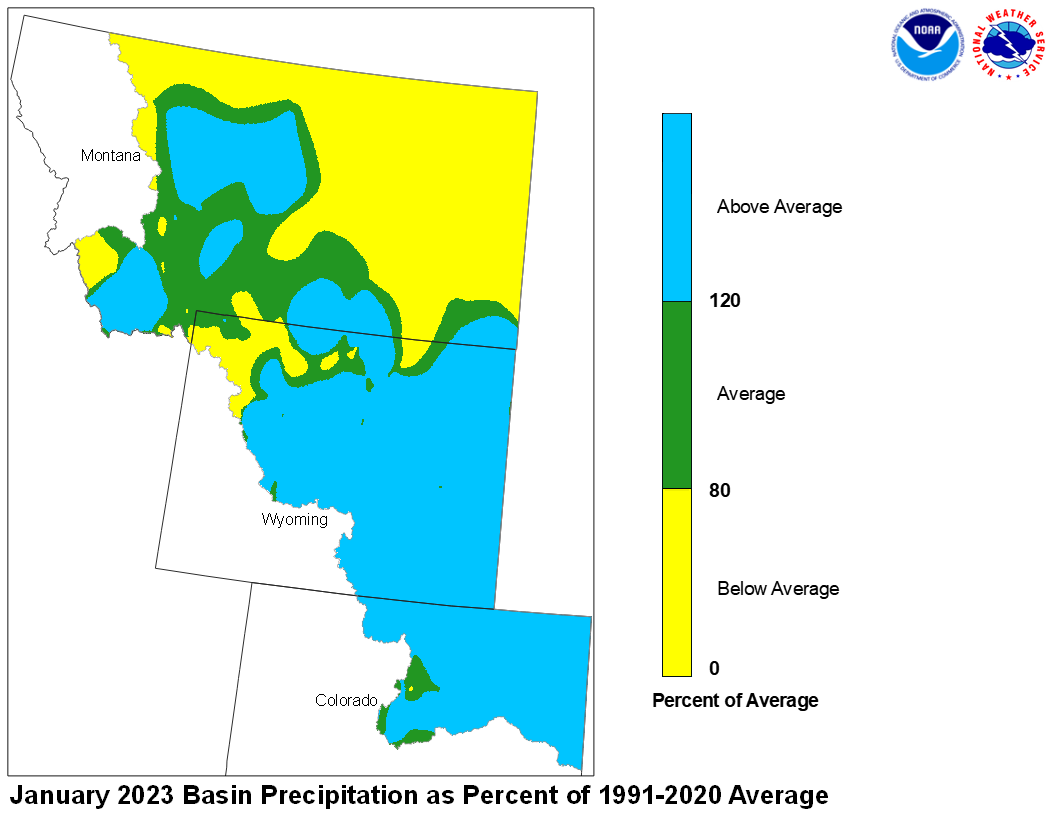
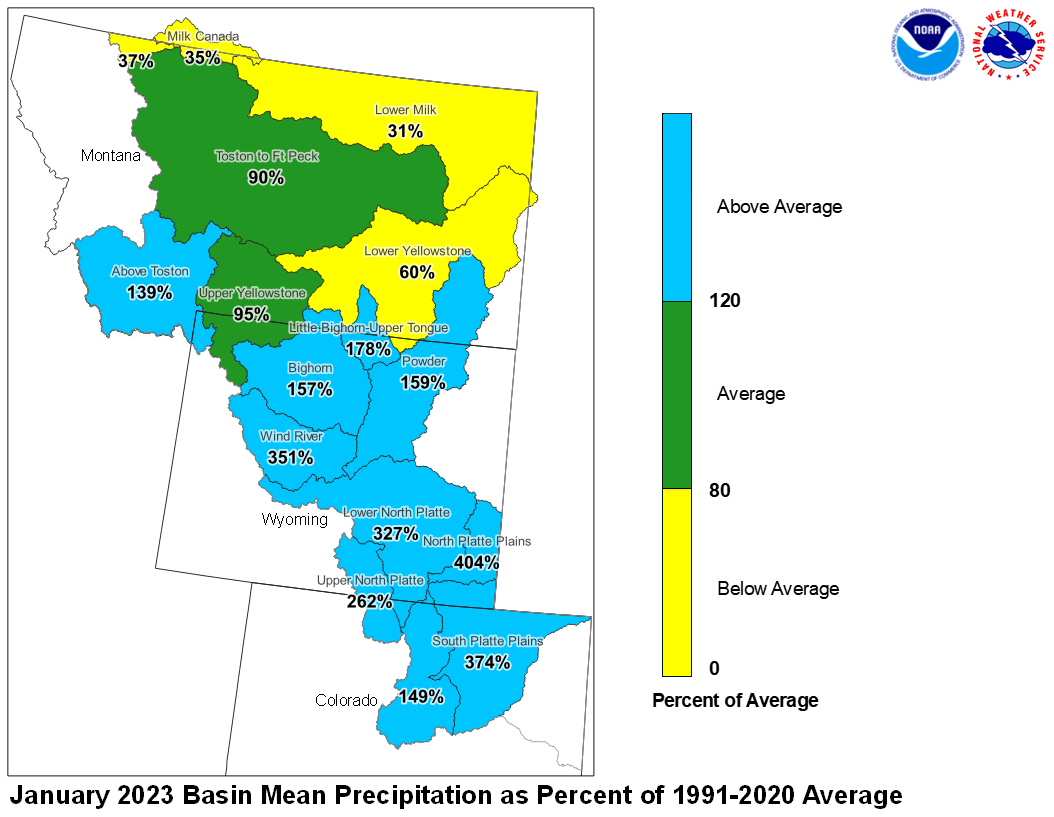
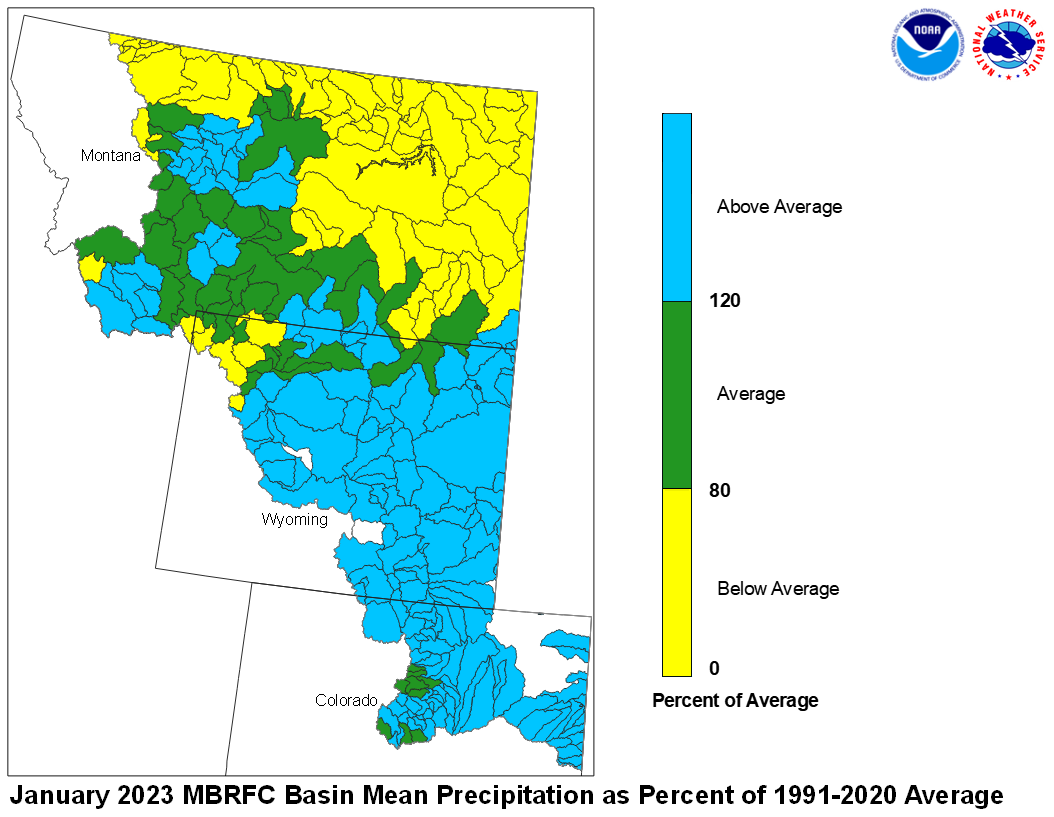
January precipitation across the Upper Missouri Basin was mostly below average.
Basin precipitation summaries for the Missouri Basin include: Milk St. Mary,
37 percent; Milk Canada, 35 percent; Lower Milk, 31 percent; above Toston,
139 percent; Toston to Ft. Peck, 90 percent.
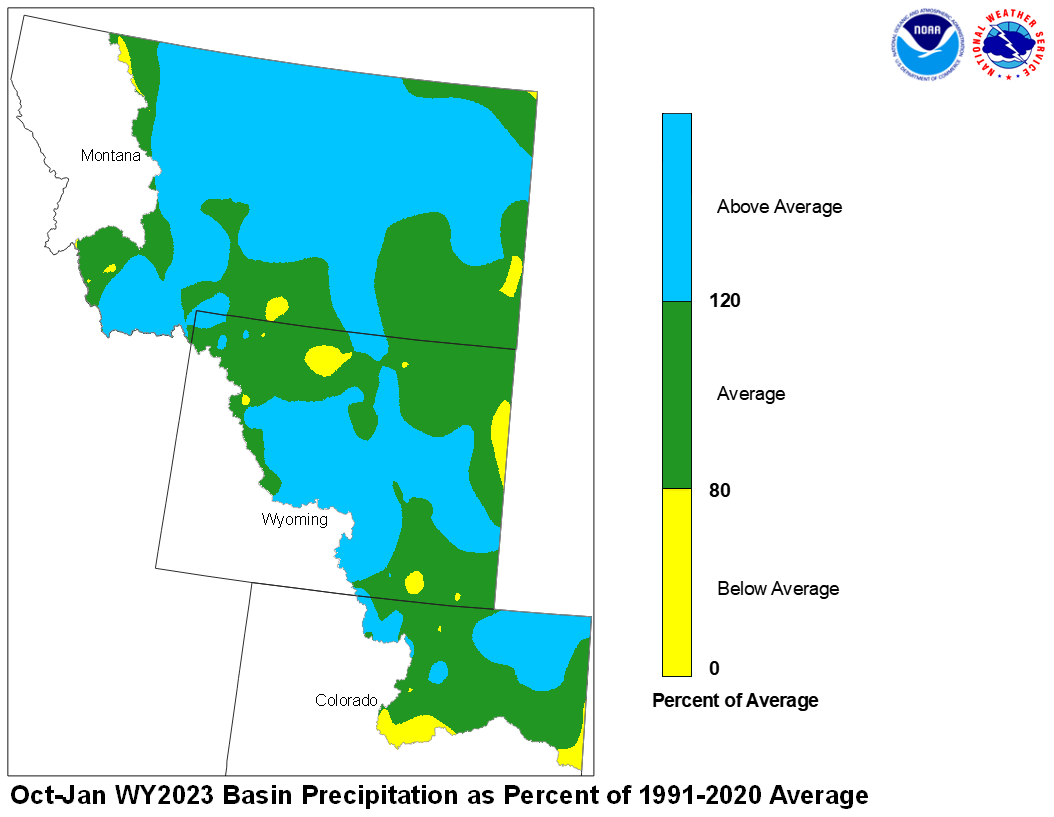
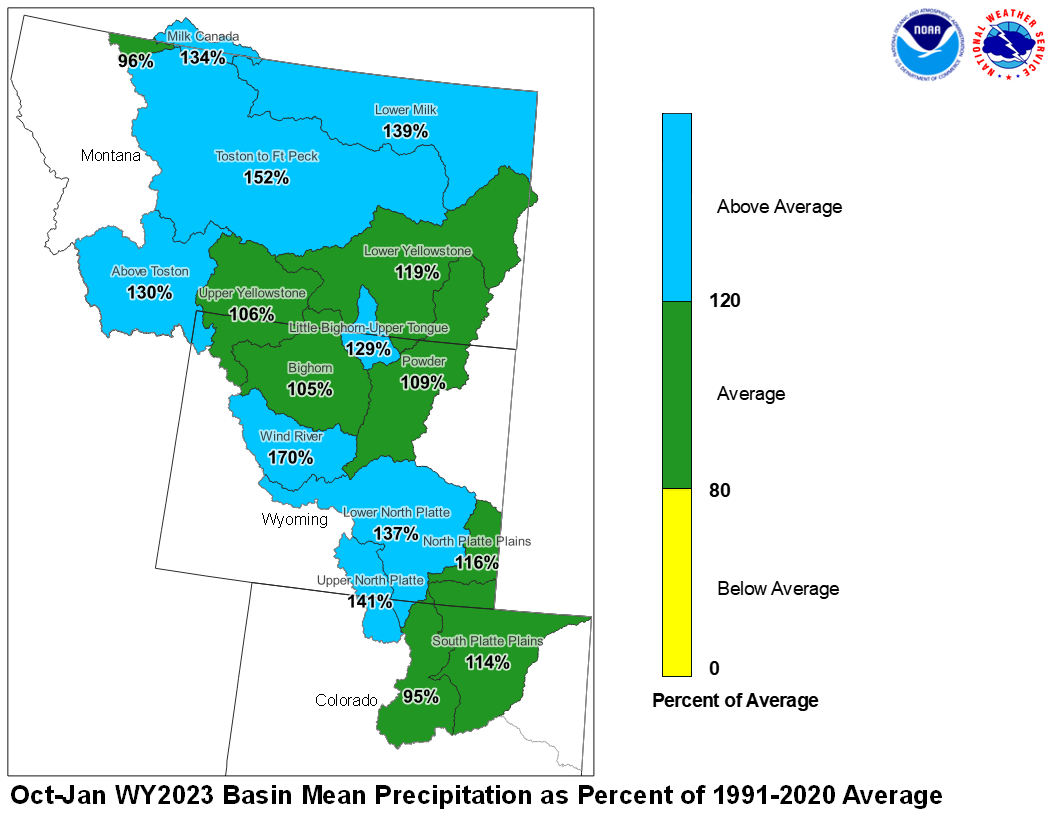
January 2023 Upper Missouri Mean Precip Oct-Jan WY2023 Upper Missouri Mean Precip
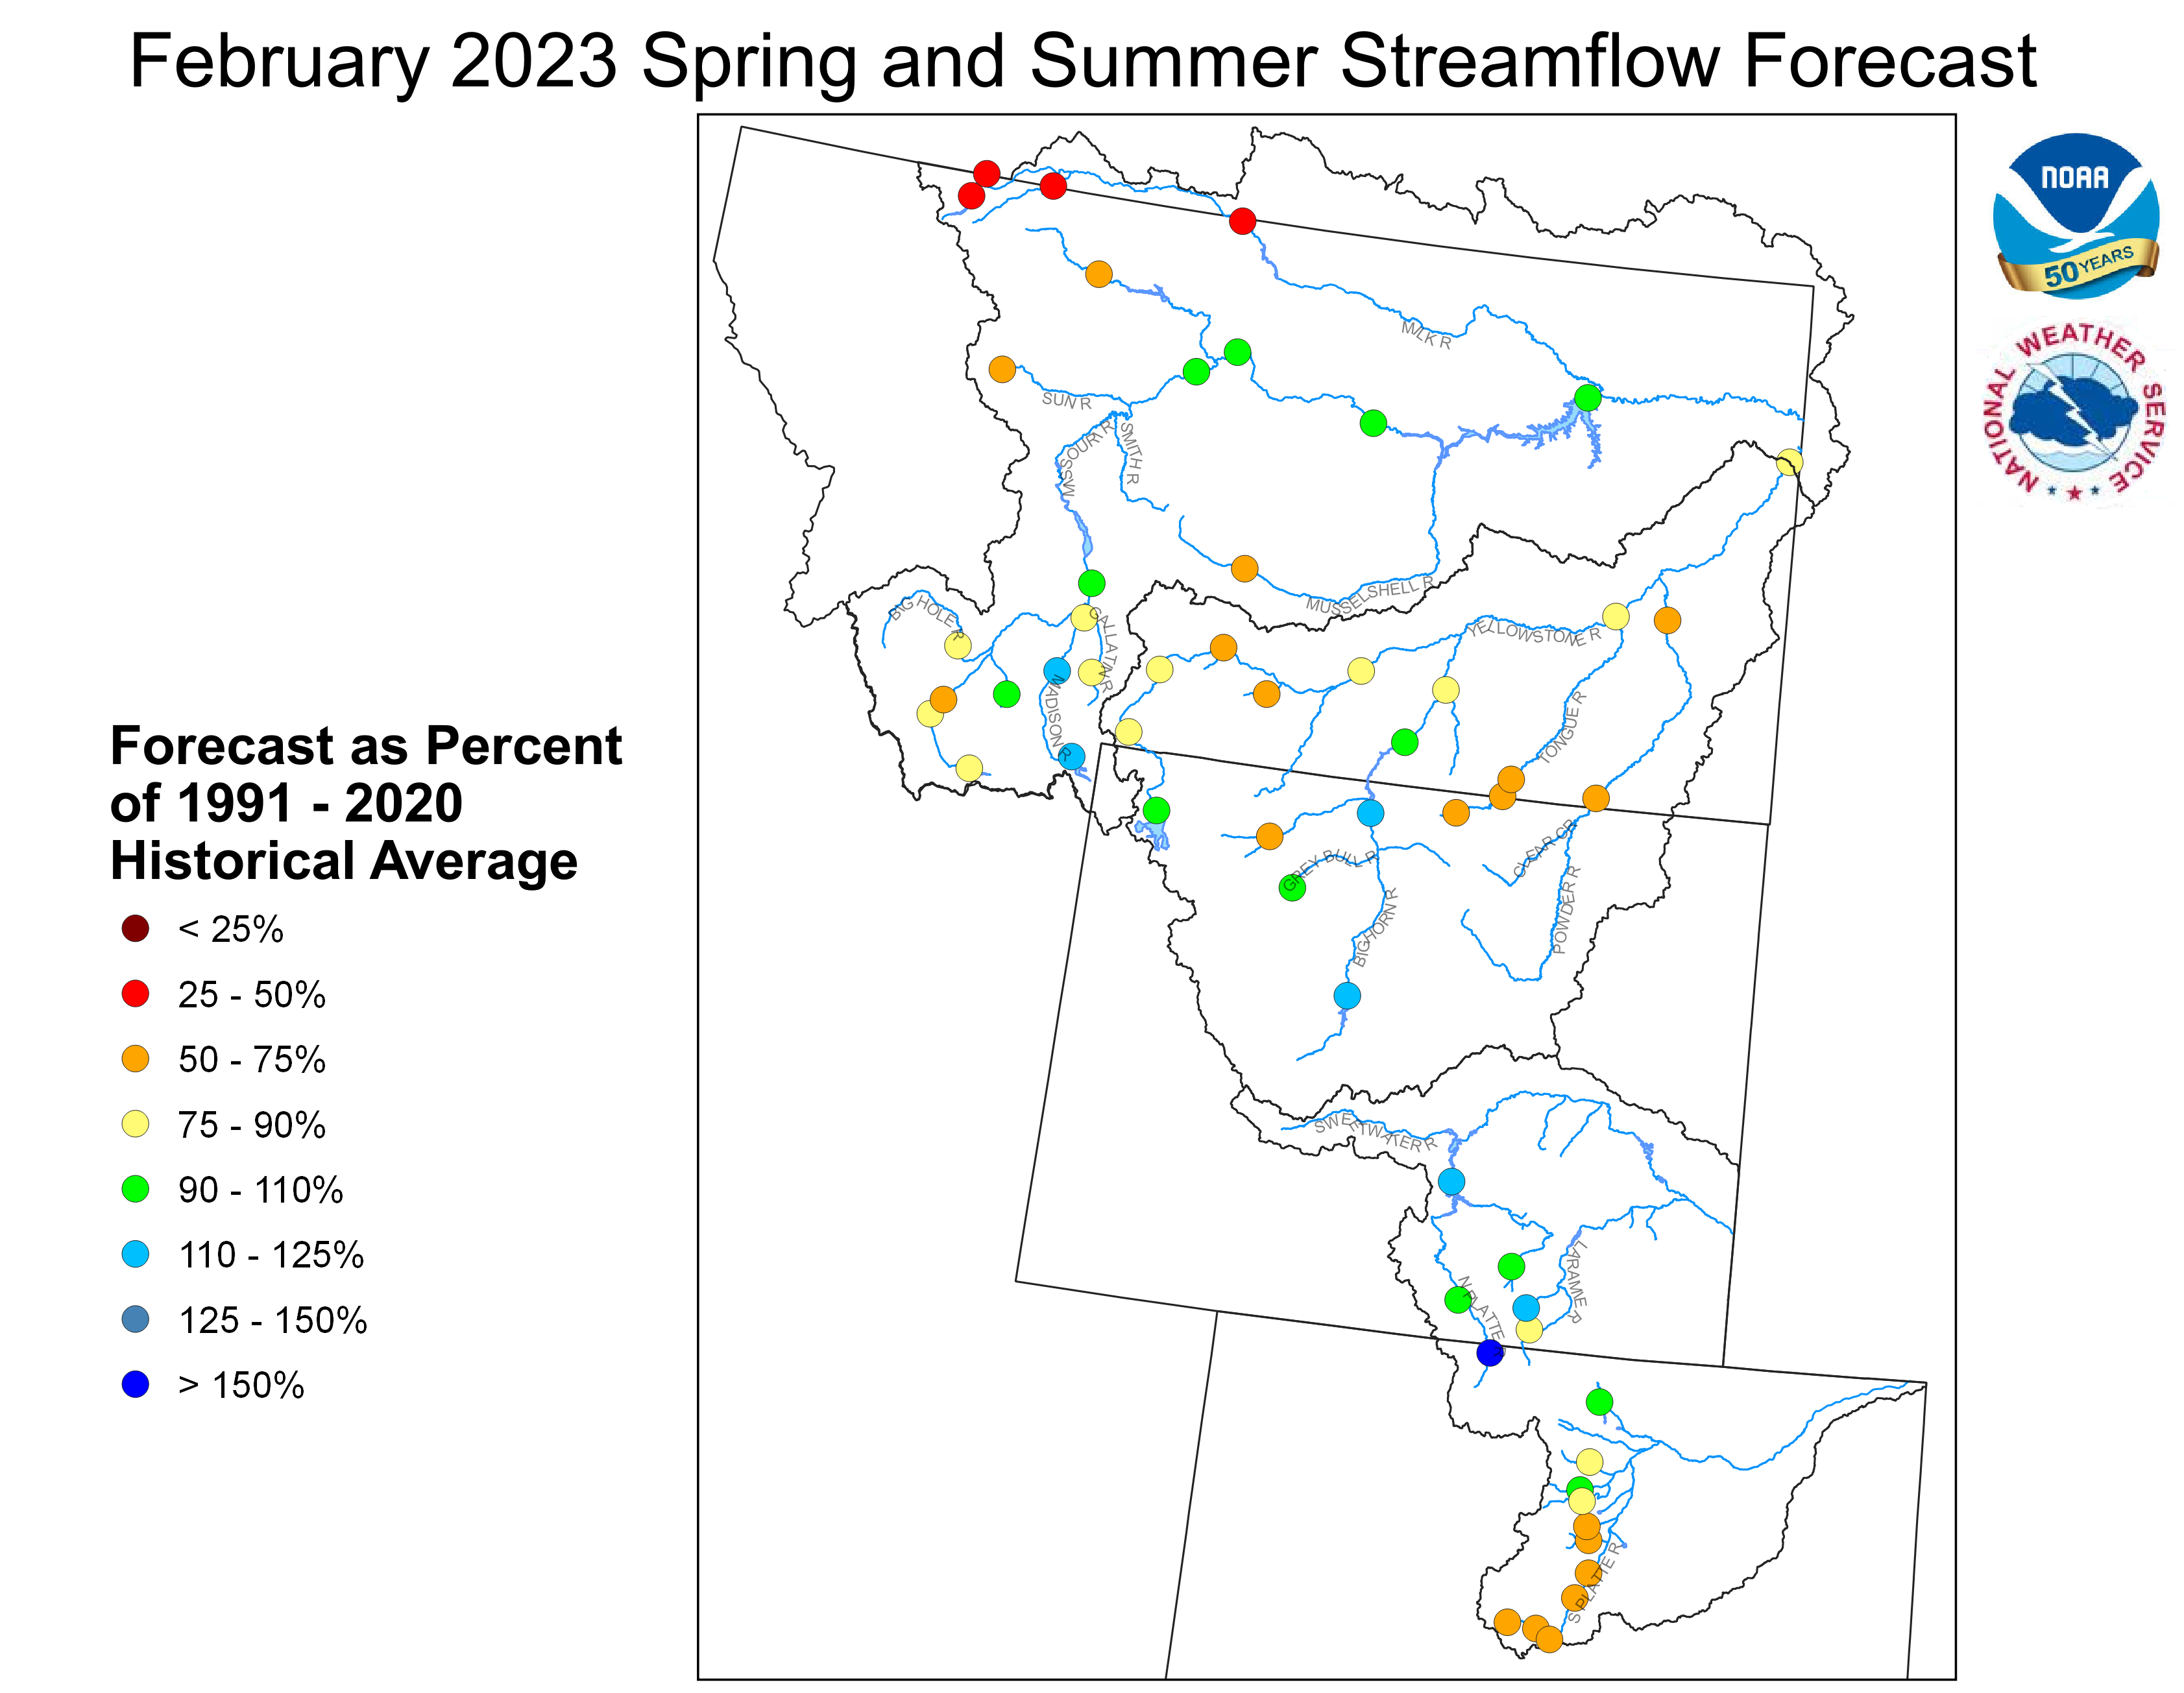
Stream flow in the Upper Missouri Basin is forecast to be
below to near average during the upcoming Spring and Summer.
The St. Mary River is forecast to have 46 percent of average
April-September flows. Runoff is expected to range around
92 percent of average for the Missouri Basin above Fort Peck,
Montana.
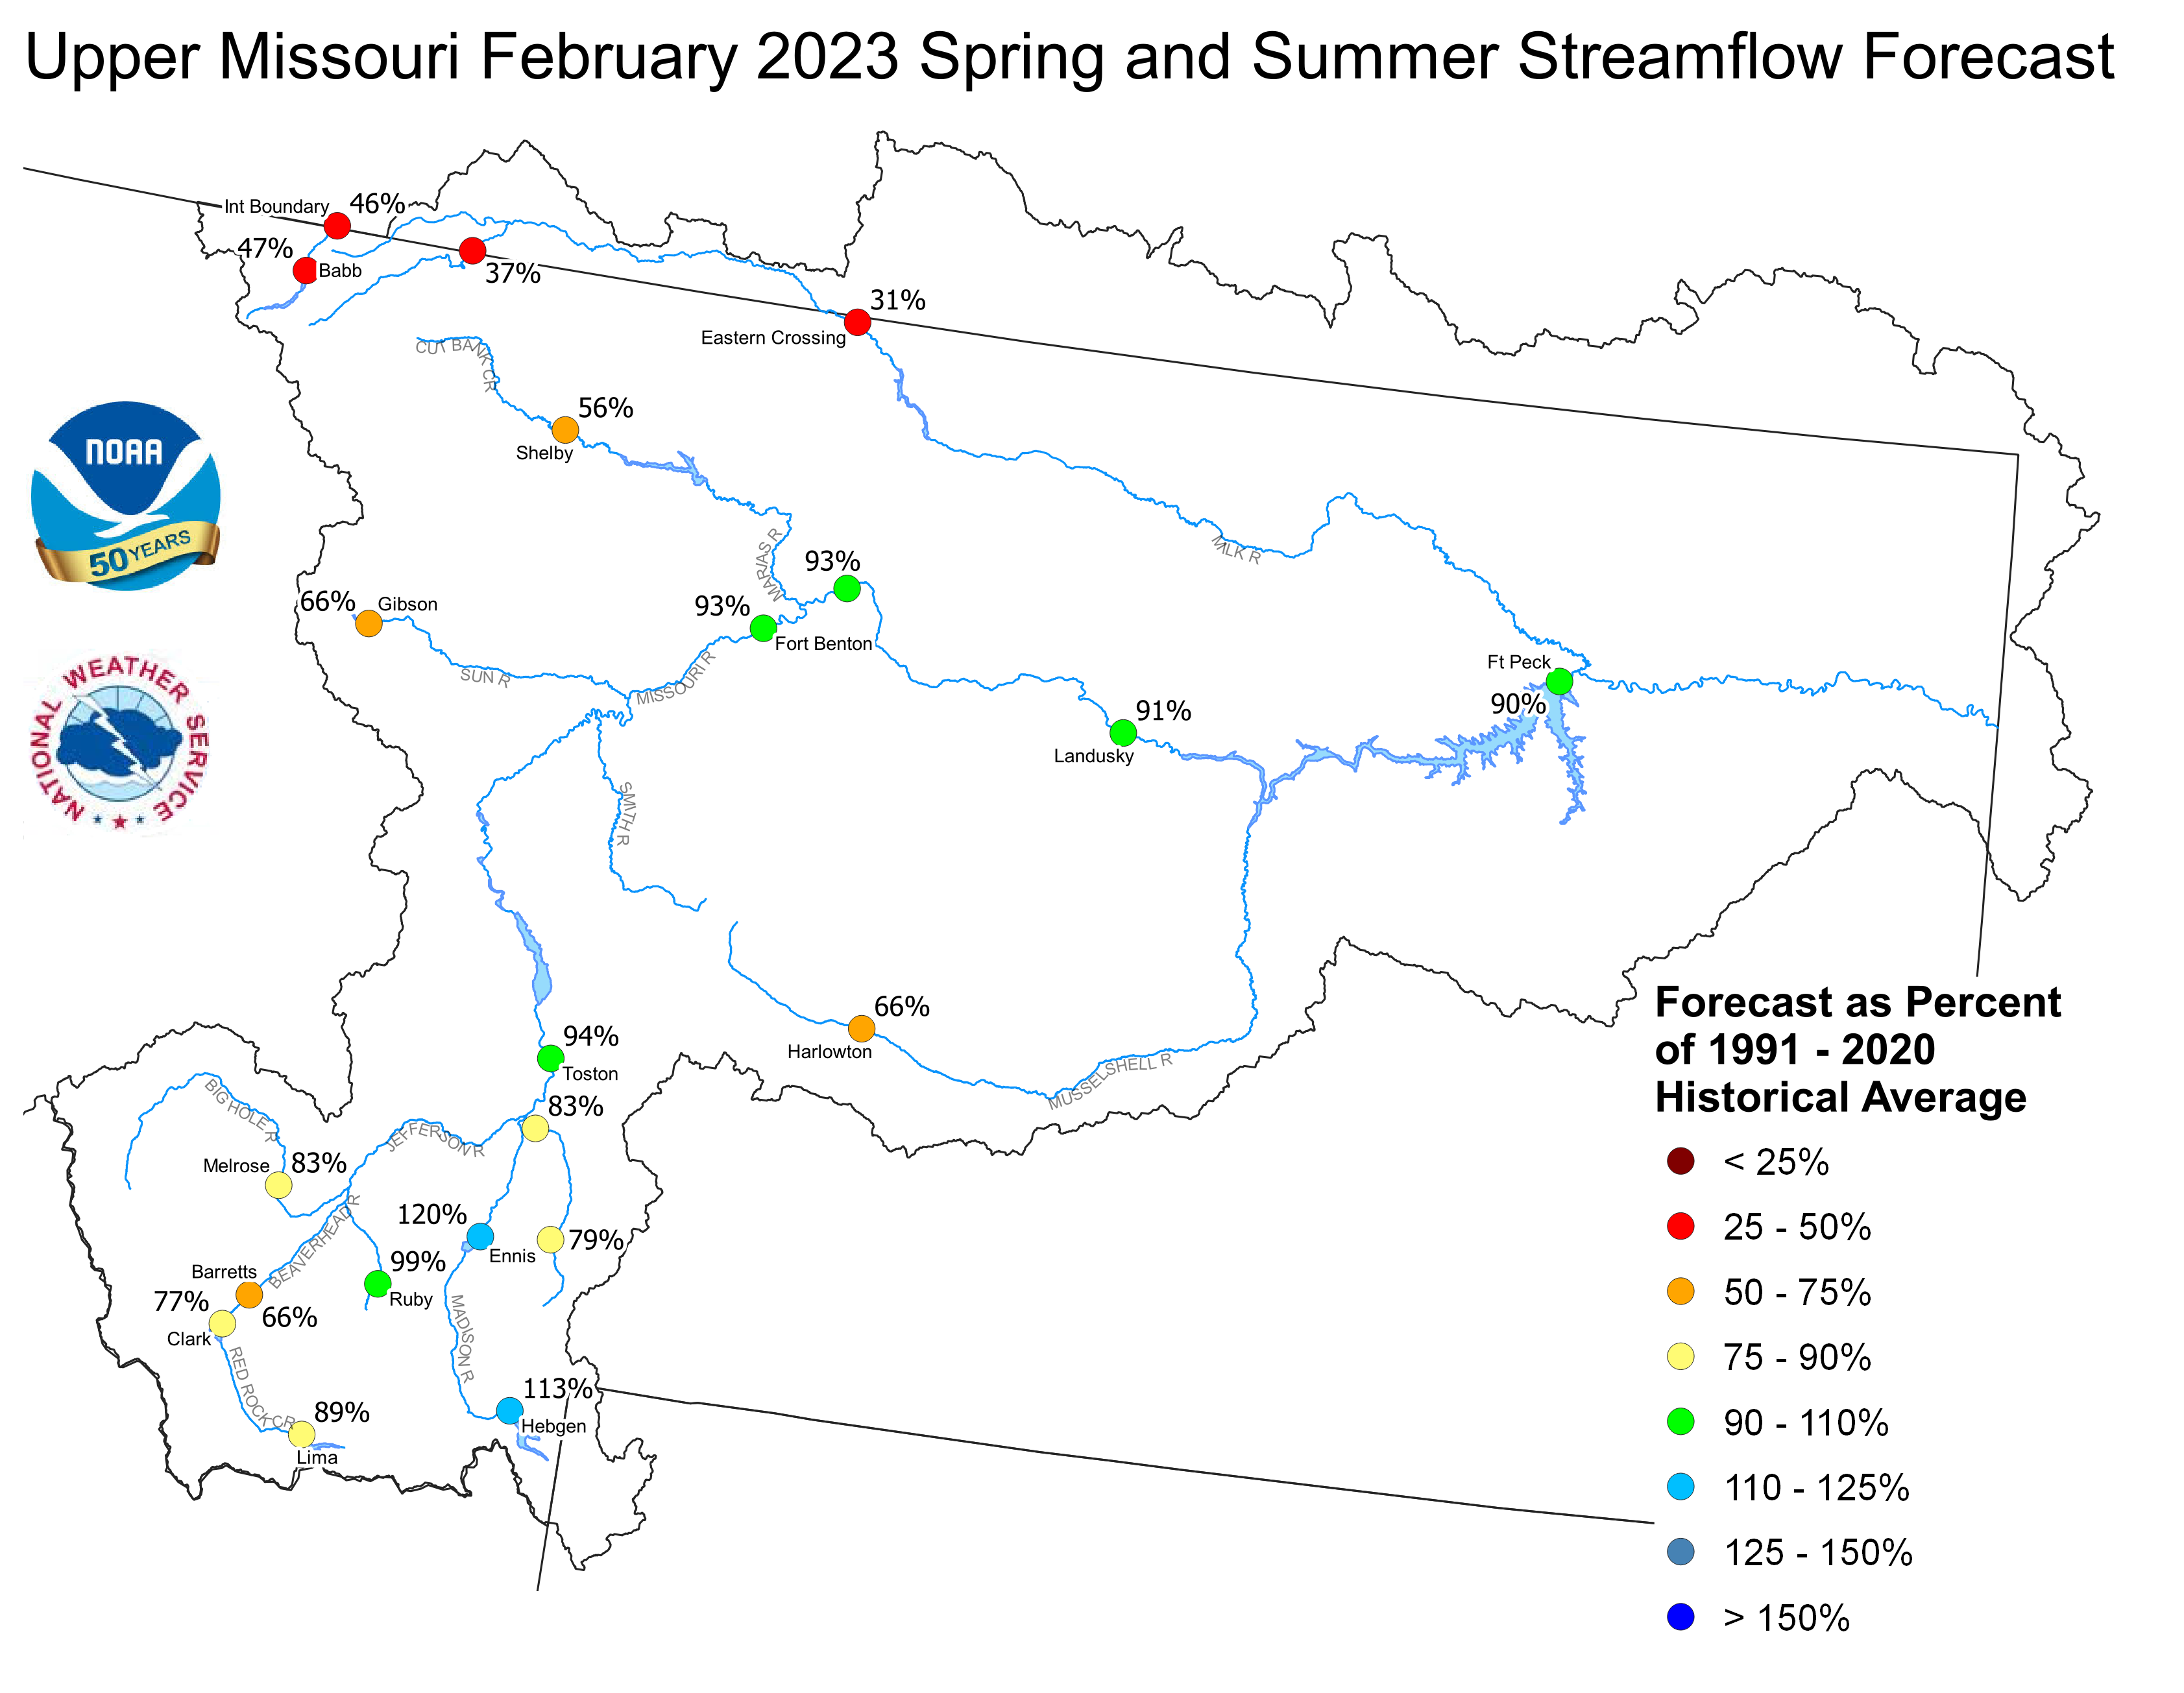
Upper Missouri February 1, 2023 Spring and Summer Streamflow Forecasts
Of the four major irrigation reservoirs in Montana; Lima
Reservoir had 60 percent average storage, Clark Canyon was
holding 84 percent of average water, Gibson Reservoir had 39
percent of average stored water, and Fresno Reservoir had
75 percent of average stored water.
Yellowstone Basin
The high elevation snow pack in the Yellowstone Basin was near to below average
on February 1. The snow pack in the Upper Yellowstone Basin was 85 percent
of average. The snow packs in the Wind, Bighorn, and Shoshone Basins were 135,
108, and 94 percent of average, respectively. The snow packs in the Tongue
and Powder basins were 108 and 114 percent of average, respectively.
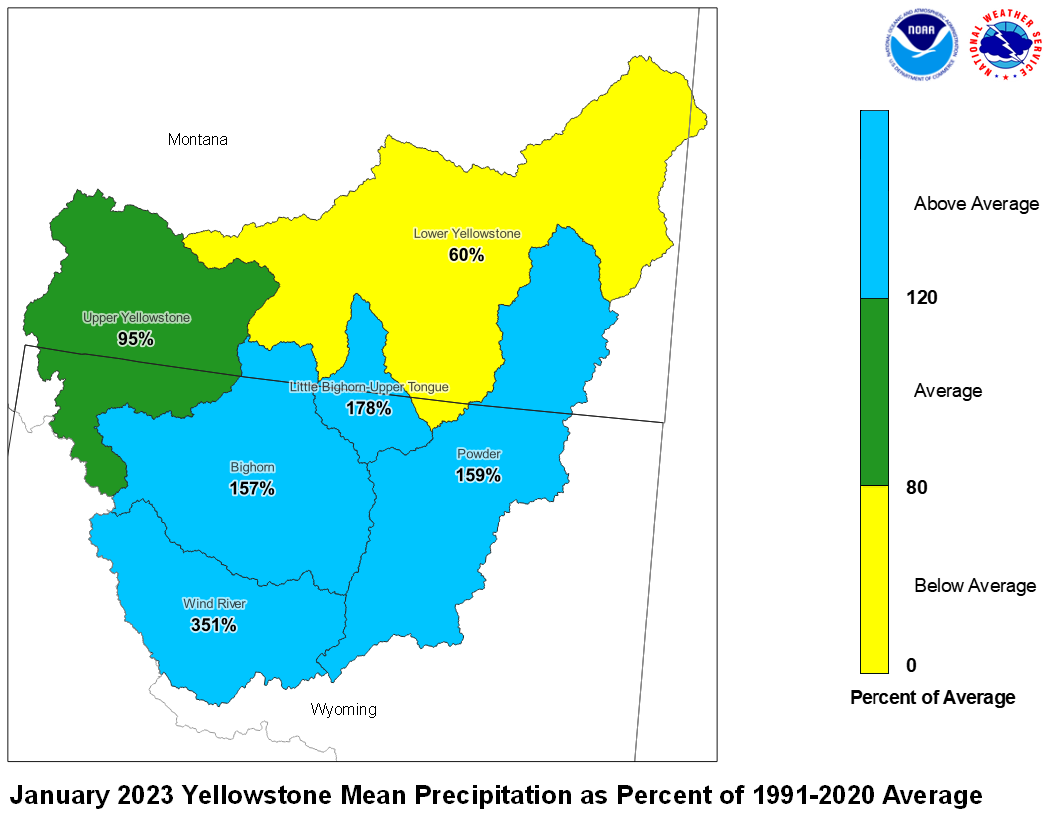
Precipitation during January was above average. The upper Yellowstone
River Basin received 95 percent of average precipitation while the
Lower Yellowstone River Basin reported 60 percent of average. The
Bighorn Basin received 157 percent of average precipitation while the
Wind River Basin received 351 percent of average. The Little Bighorn -
Upper Tongue Basin received 178 percent of average and the Powder River
had 159 percent of average precipitation.
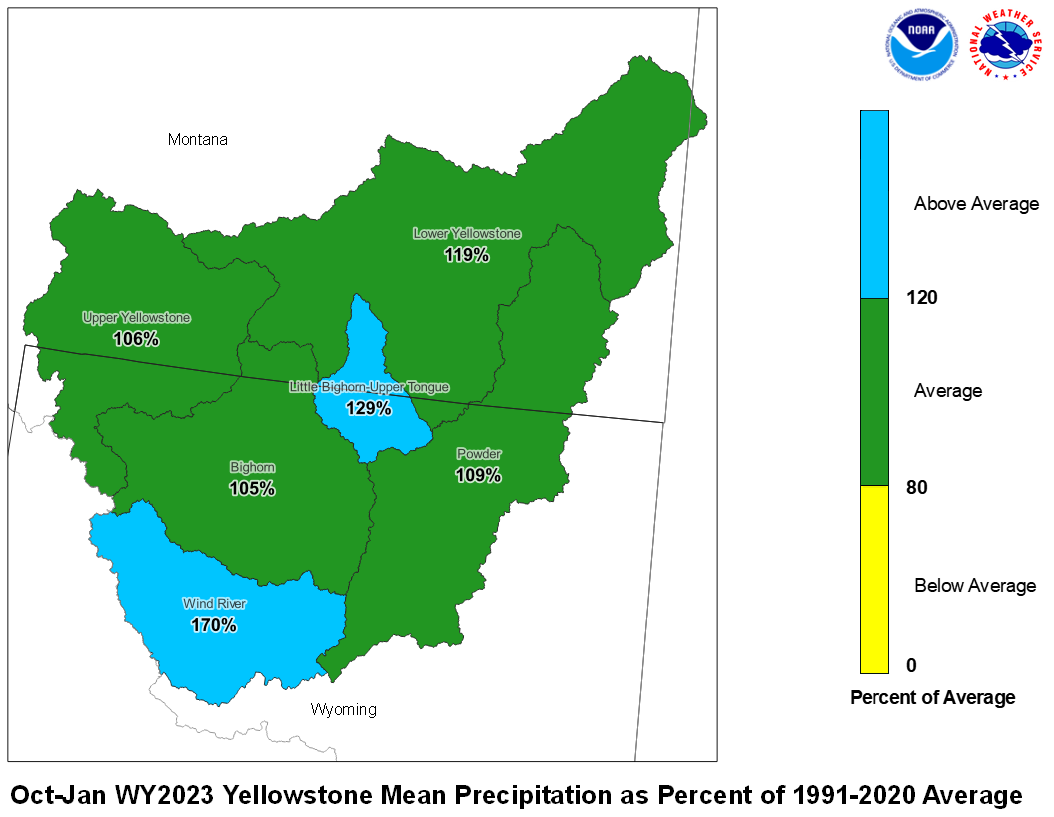
January 2023 Yellowstone Mean Precip Oct-Jan WY2023 Yellowstone Mean Precip
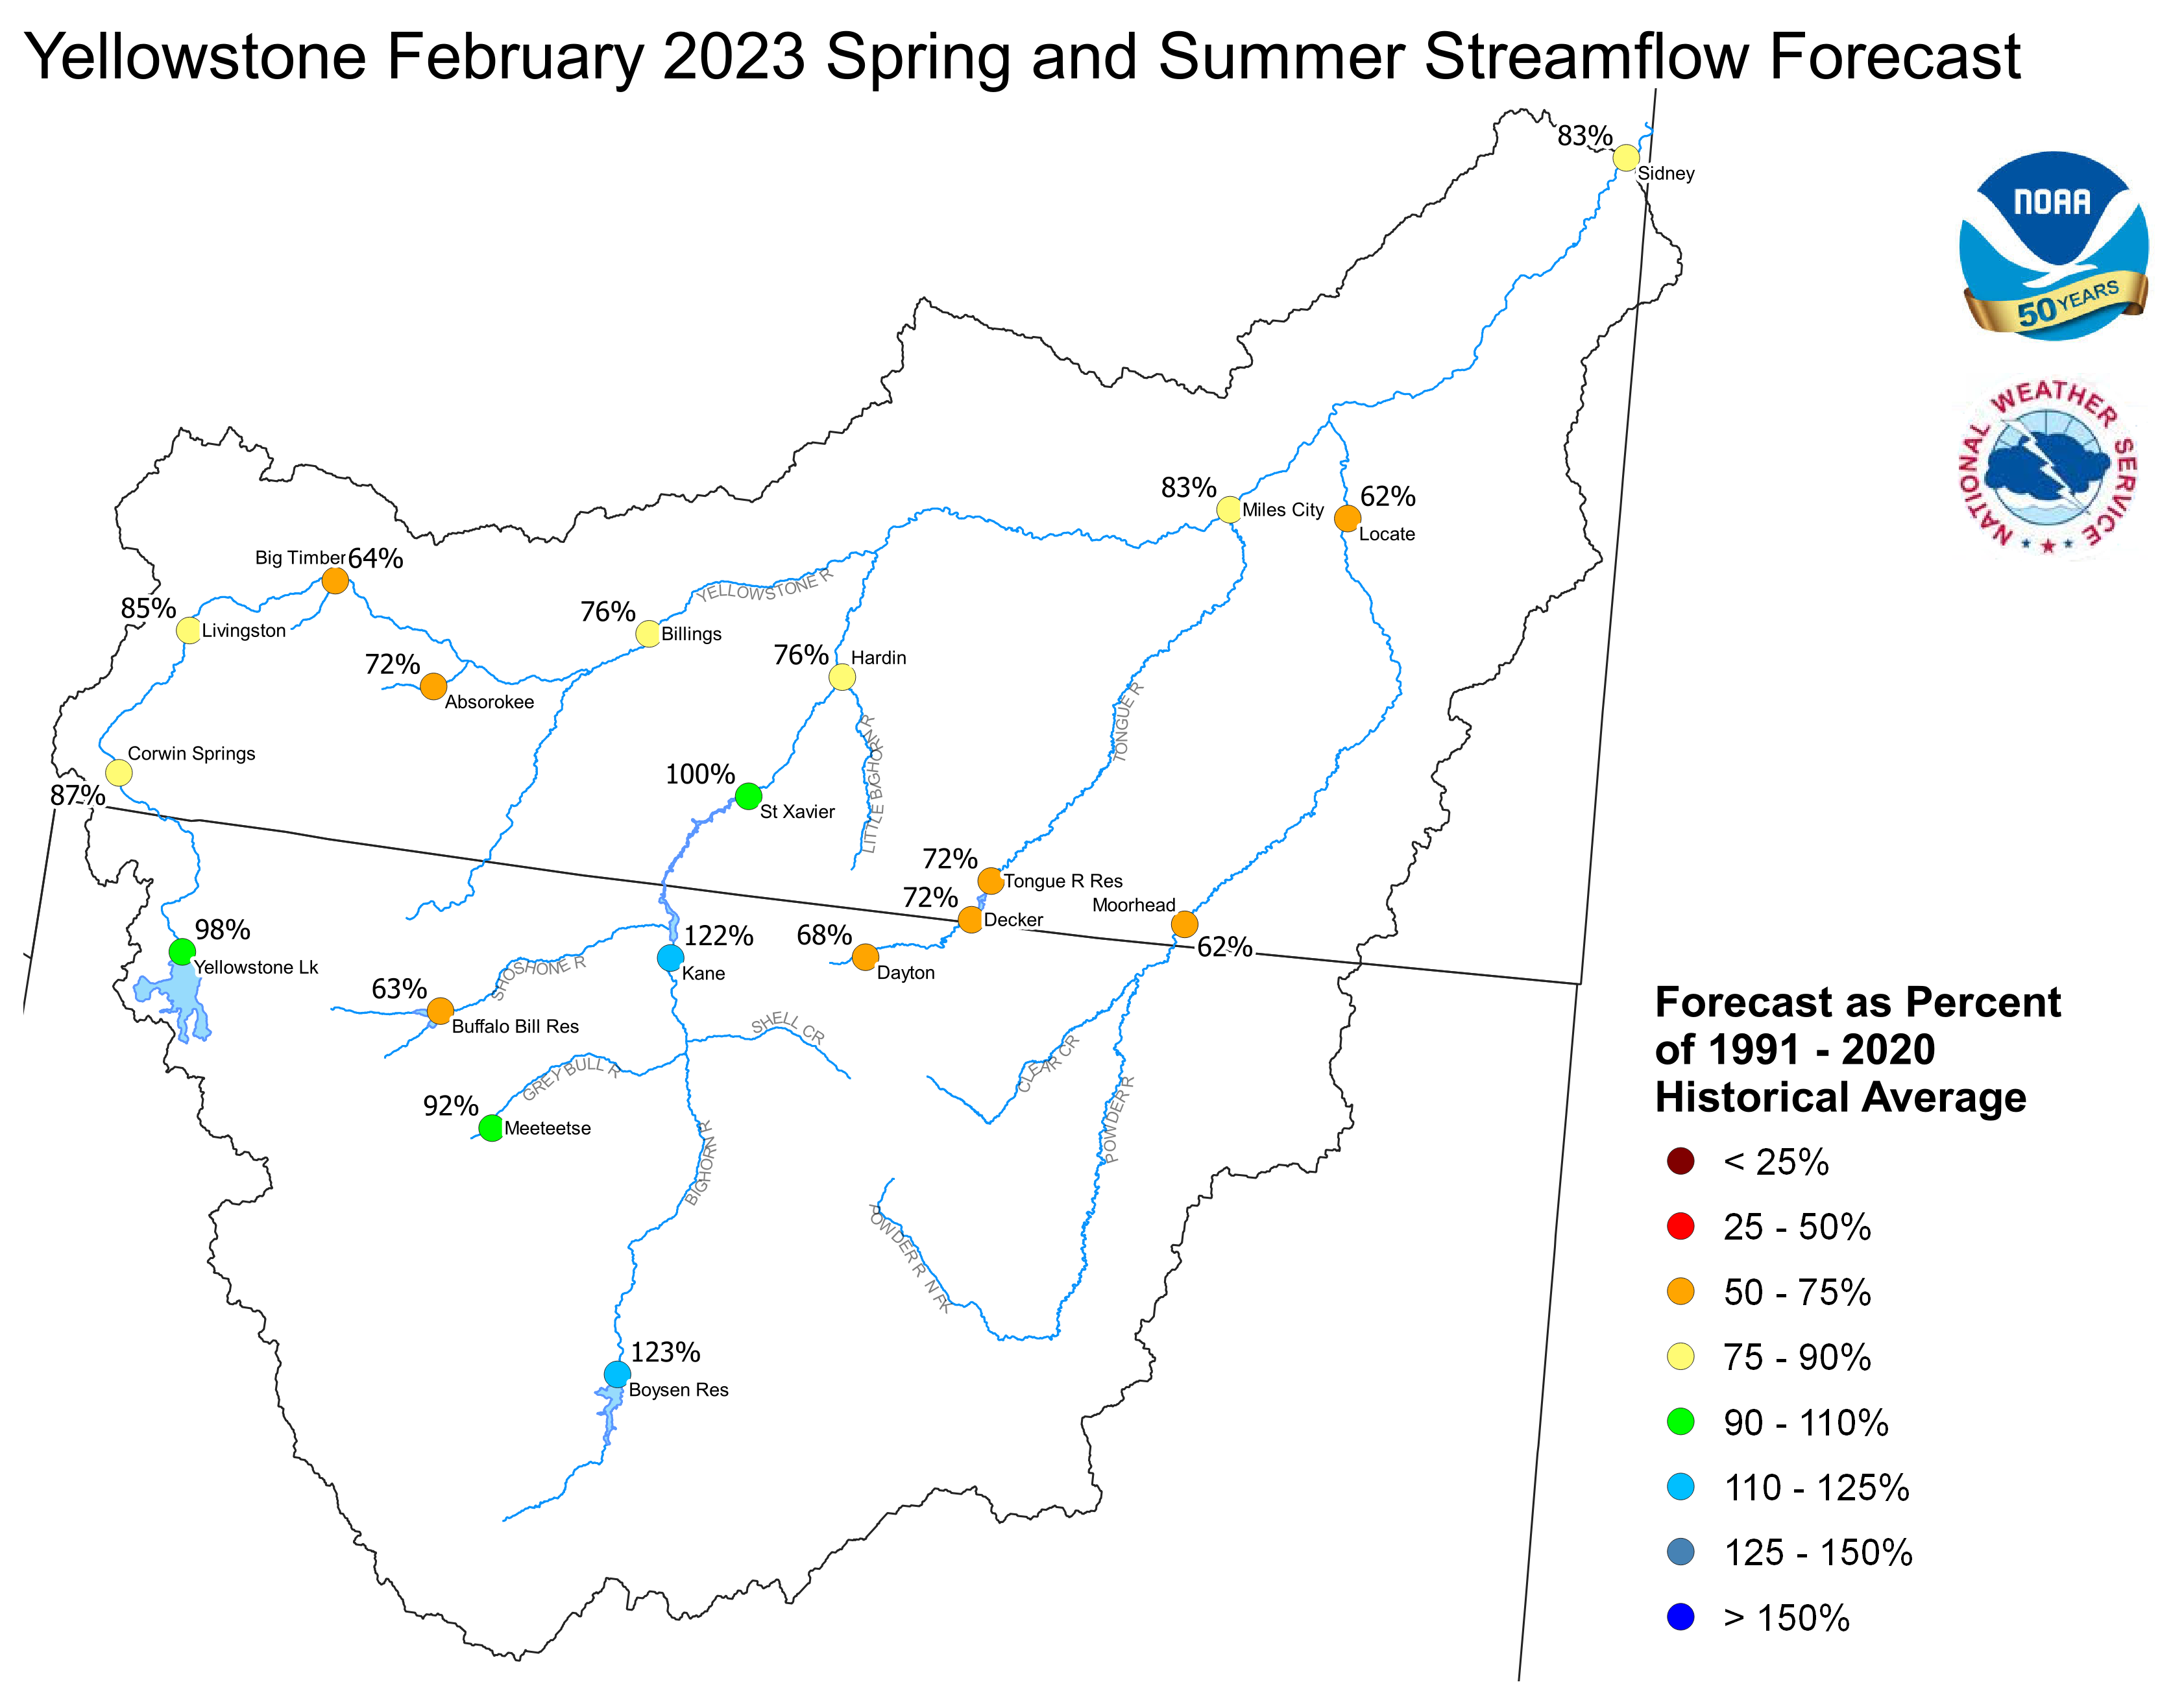
Forecast stream flow in the Yellowstone Basin is below to near
average for the upcoming Spring and Summer. Stream flow for the
Yellowstone River above Sidney, Montana is forecast to be about
80 percent of average. Flow in the Tongue Basin is expected to be
71 percent of average. Flows in the Powder River are expected
to be about 62 percent of average.
Monthend storage at Boysen Reservoir was 102 percent of average.
Stored water in Buffalo Bill Reservoir was 104 percent of average.
Monthend storage was 96 percent of average at Bighorn Reservoir.
Yellowstone February 1, 2023 Spring and Summer Streamflow Forecasts
Platte Basin
The high elevation snow pack in the Upper North Platte Basin was
117 percent of average on February 1. The snow pack in the North Platte
Basin below Seminoe Reservoir was 133 percent of average. The snow
pack in the South Platte Basin was 117 percent of average.
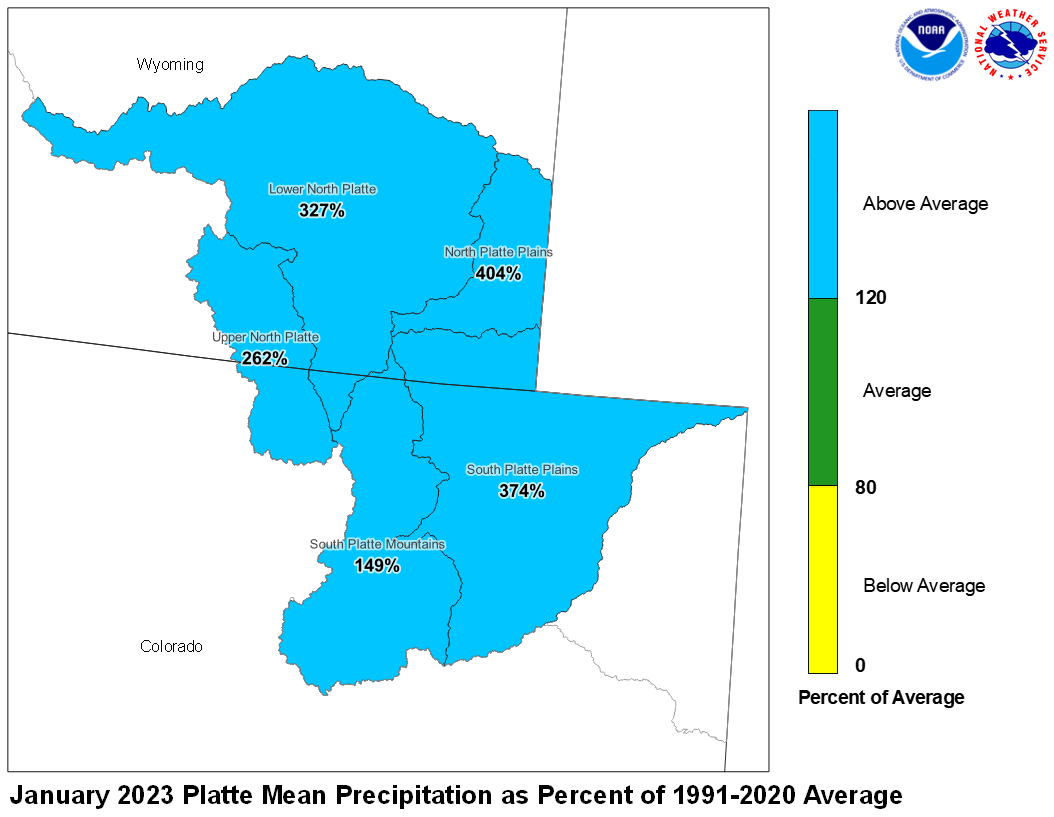
Precipitation during January in the Upper North Platte Basin was 262
percent of average. In the Lower North Platte Basin, precipitation
was 327 percent of average. The North Platte Plains below Guernsy
Reservoir had 404 percent. The South Platte Mountains had 149
percent whereas the Plains had 374 percent of average January
precipitation.
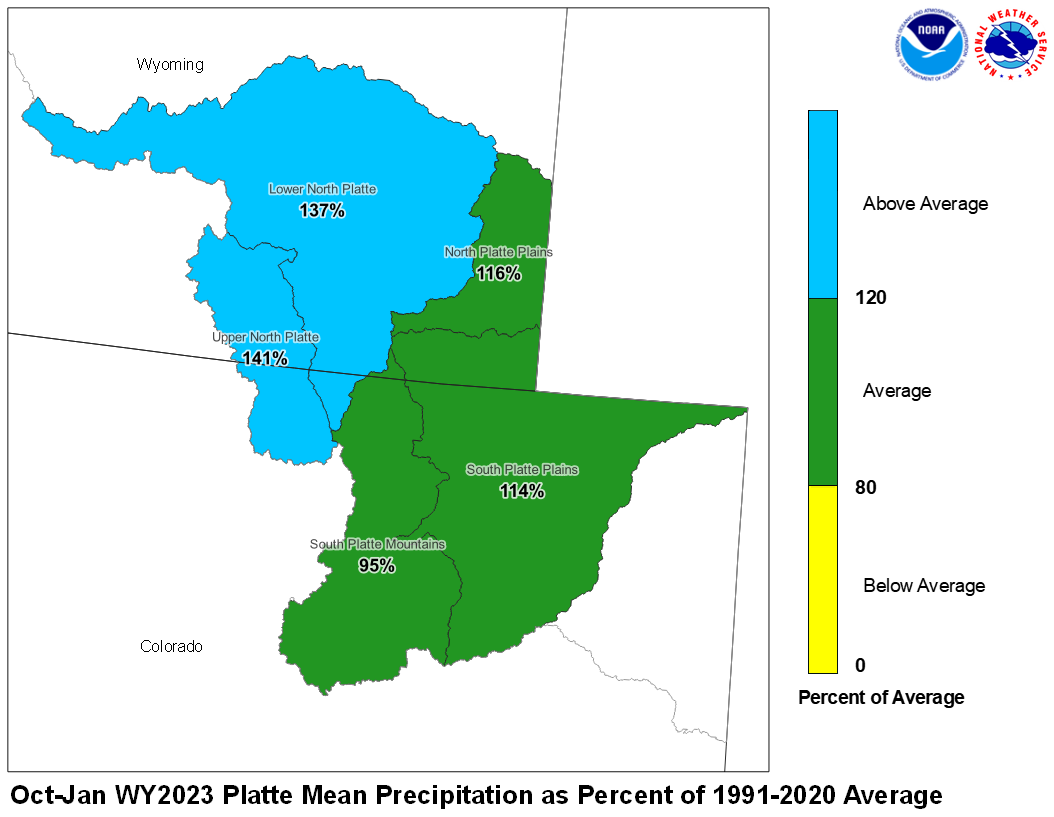
January 2023 Platte Mean Precip Oct-Jan WY2023 Platte Mean Precip
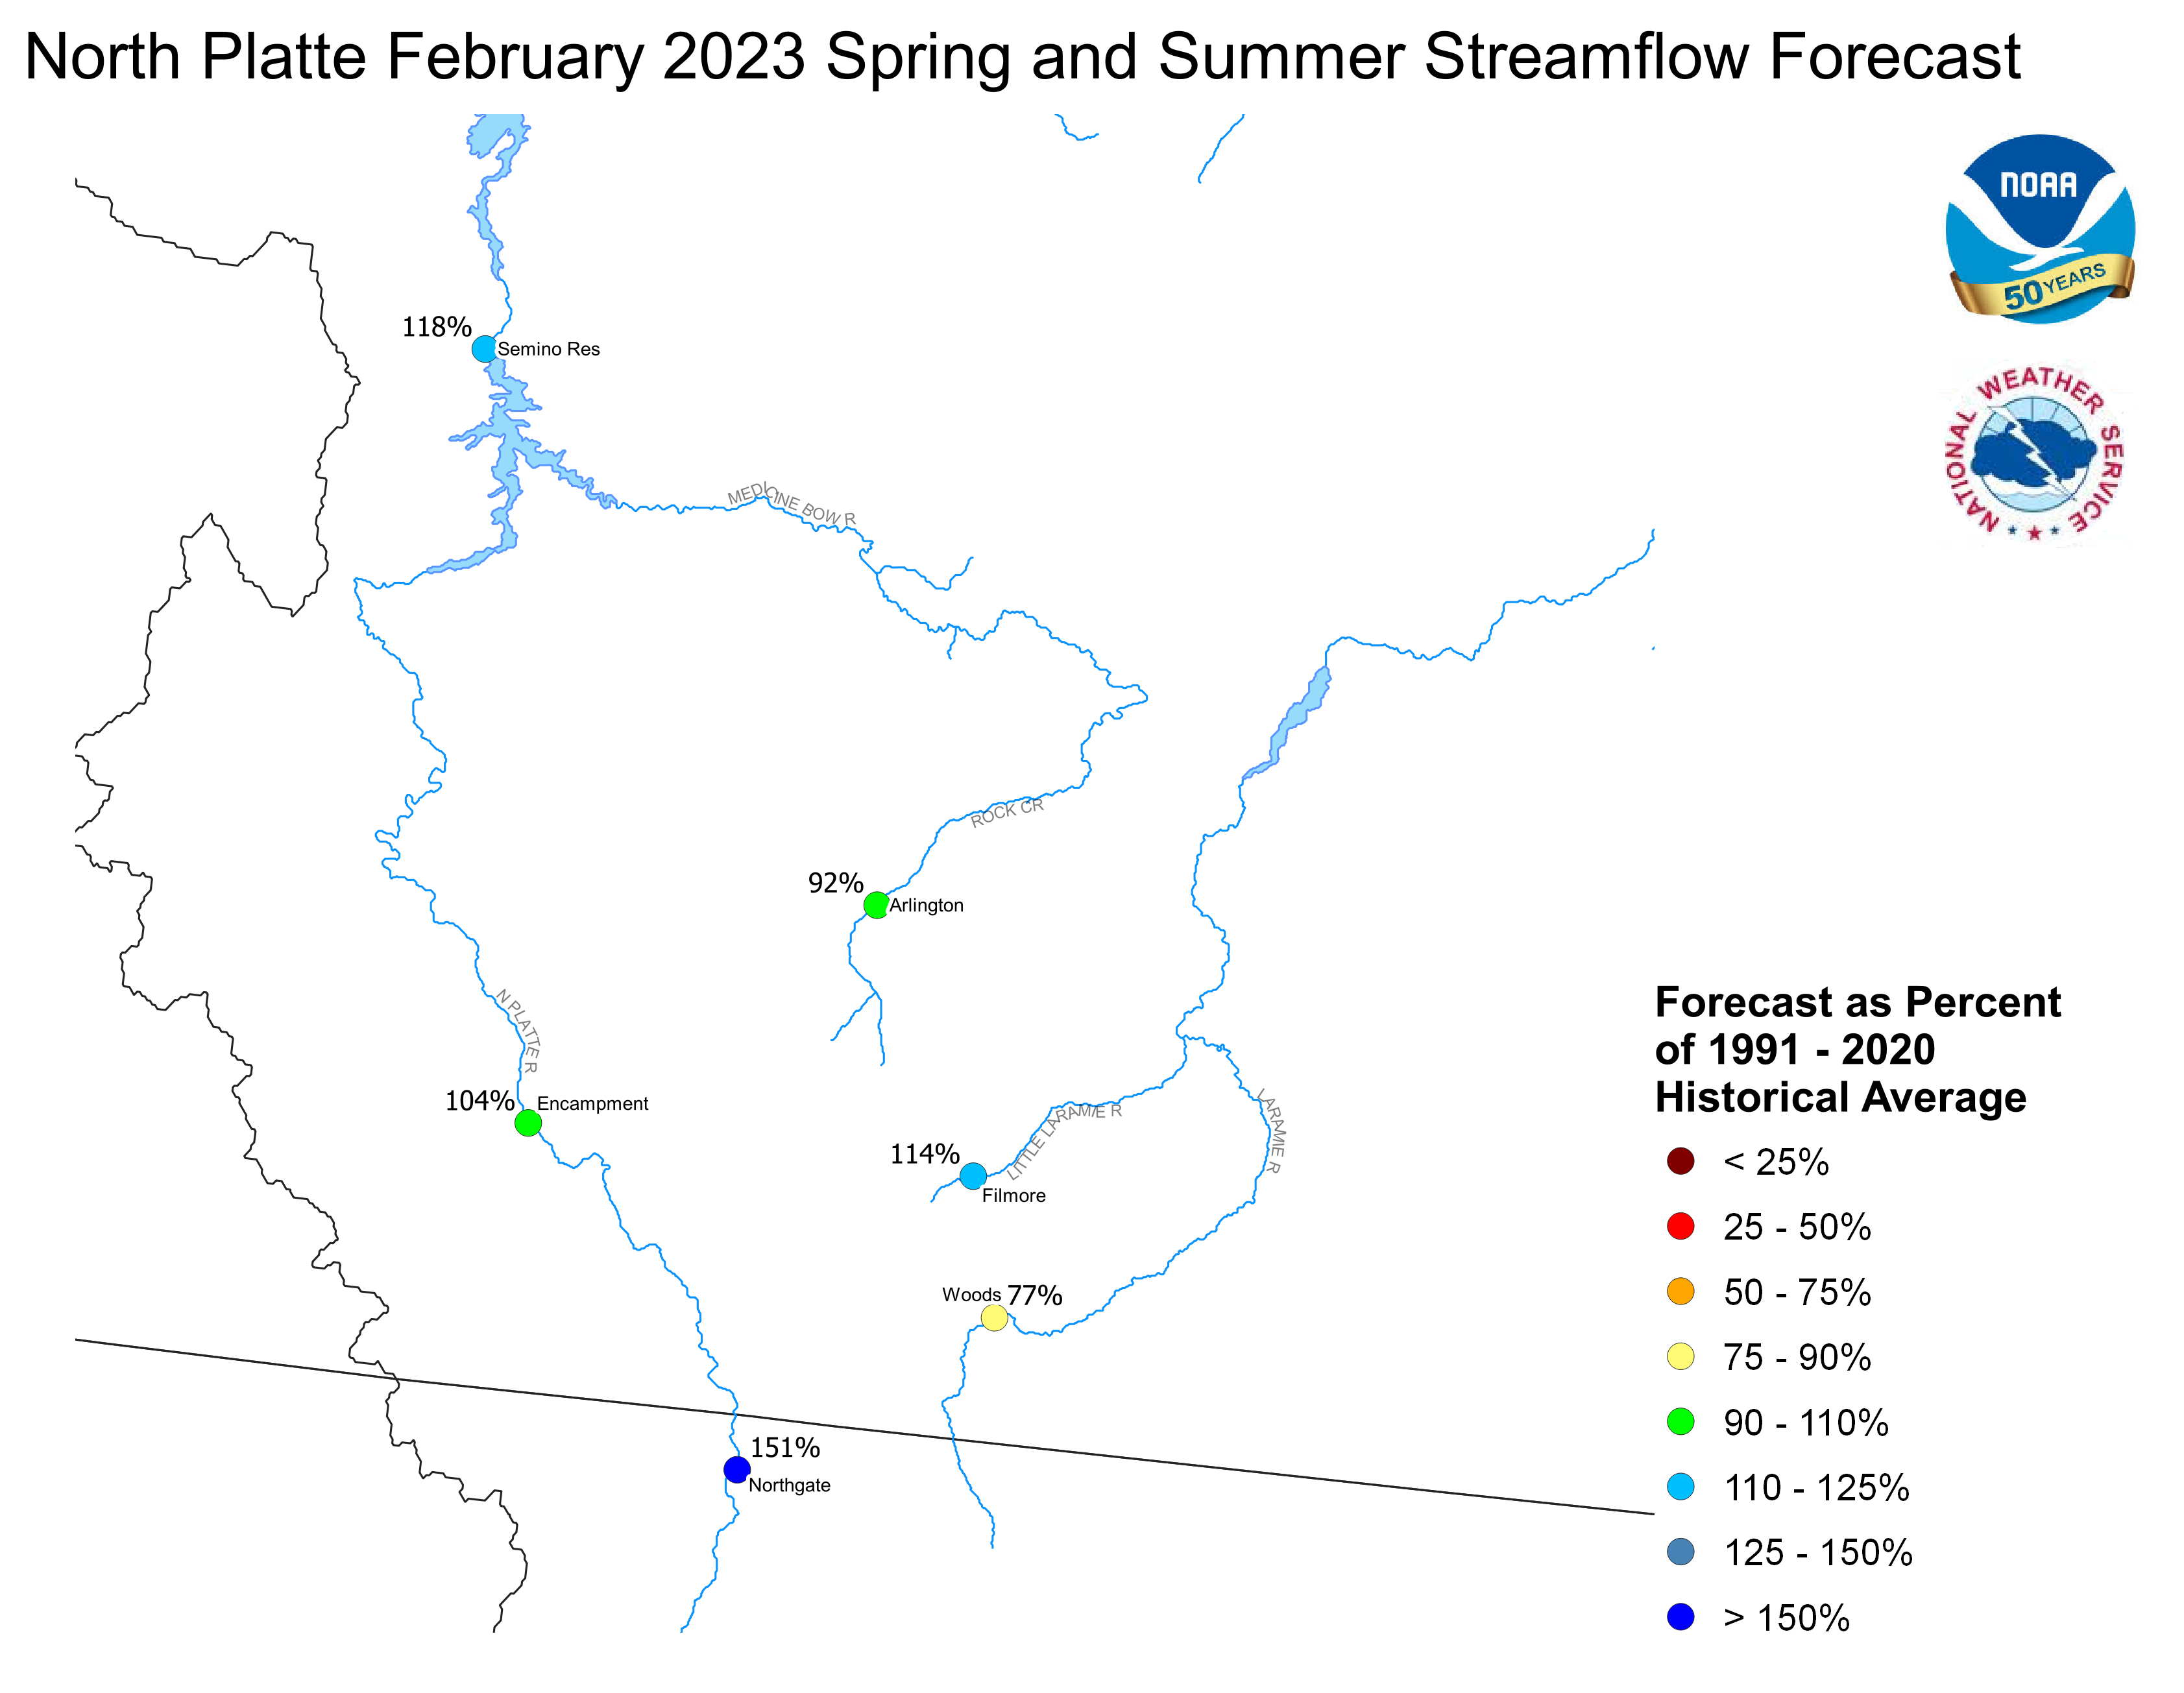
Stream flow in the Platte Basin is forecast to be near
average during the upcoming Spring and Summer. Runoff
for streams above Seminoe Reservoir are expected to be
about 120 percent of average. Streams in the South Platte
Basin above South Platte, Colorado can expect 70 percent
of average flow. For the remainder of the South Platte
basin, flows are expected near 85 percent.
Stored water in the South Platte Basin was 86 percent of average
on February 1.
North Platte Streamflow Fcst South Platte Streamflow Fcst
WATER SUPPLY FORECAST
NWS MISSOURI BASIN RIVER FORECAST CENTER
PLEASANT HILL MISSOURI

1216 CST FRIDAY FEBRUARY 03, 2023

DATA CURRENT AS OF: FEBRUARY 01, 2023

MISSOURI/YELLOWSTONE/PLATTE RIVER BASIN FORECASTS


                                          50%   %   10%   90%   AVG
FORECAST POINT                   PERIOD  (KAF) AVG (KAF) (KAF) (KAF)
--------------------------------------------------------------------

Boysen Resvr Inflow              Apr-Sep  611   85  1294  263    720
 SBDW4

Boysen Resvr Inflow              Apr-Sep 1099  123  1862  641    890
 SBDW4N

Bighorn R at Kane                Apr-Sep 1033  105  1831  598    985
 LVEW4

Bighorn R at Kane                Apr-Sep 1762  122  2664 1108   1440
 LVEW4N

Greybull R at Meeteetse          Apr-Sep  189   96   278   92    196
 MEEW4

Greybull R at Meeteetse          Apr-Sep  189   92   278   92    205
 MEEW4N

Buffalo Bill Resvr Inflow        Apr-Sep  493   60   770  379    815
 CDYW4

Buffalo Bill Resvr Inflow        Apr-Sep  574   63   864  450    910
 CDYW4N

St. Mary R nr Babb               Apr-Sep  247   54   336  201    460
 SMYM8

St. Mary R nr Babb               Apr-Sep  254   47   344  208    535
 SMYM8N

St. Mary R at Intl Boundary      Apr-Sep  166   43   297  113    390
 SMBM8

St. Mary R at Intl Boundary      Apr-Sep  304   46   427  246    660
 SMBM8N

Milk R nr Western Crossing       Apr-Sep   10    9    30    5    113
 PDBM8

Milk R nr Western Crossing       Apr-Sep   15   37    42    6     41
 PDBM8N

Milk R nr Eastern Crossing       Apr-Sep  141   66   203  129    215
 ERNM8

Milk R nr Eastern Crossing       Apr-Sep   35   31   133   16    112
 ERNM8N

North Platte R nr Northgate      Apr-Sep  390  159   612  254    245
 NGTC2

North Platte R nr Northgate      Apr-Sep  444  151   664  304    295
 NGTC2N

Encampment R nr Encampment       Apr-Sep  161  103   213  123    156
 ECRW4

Encampment R nr Encampment       Apr-Sep  172  104   223  135    166
 ECRW4N

Rock Cr nr Arlington             Apr-Sep   49   92    65   37     53
 KCRW4

Rock Cr nr Arlington             Apr-Sep   49   92    65   38     53
 KCRW4N

Seminoe Resvr Inflow             Apr-Sep  923  121  1252  651    765
 SETW4

Seminoe Resvr Inflow             Apr-Sep 1088  118  1410  810    920
 SETW4N

Laramie R nr Woods Landing       Apr-Sep   73   68   139   37    108
 WODW4

Laramie R nr Woods Landing       Apr-Sep  109   77   175   68    142
 WODW4N

Little Laramie R nr Filmore      Apr-Sep   63  115    98   45     55
 SMTW4

Little Laramie R nr Filmore      Apr-Sep   65  114   100   47     57
 SMTW4N

Antero Resvr Inflow              Apr-Sep   10   71    17    5     14
 ANRC2

Antero Resvr Inflow              Apr-Sep   10   71    17    5     14
 ANRC2N

Spinney Mountain Resvr Inflow    Apr-Sep   39   68    76   27     57
 SPYC2

Spinney Mountain Resvr Inflow    Apr-Sep   33   73    74   16     45
 SPYC2N

Elevenmile Canyon Resvr Inflow   Apr-Sep   36   61    51   32     59
 EVNC2

Elevenmile Canyon Resvr Inflow   Apr-Sep   37   74    77   17     50
 EVNC2N

Cheesman Lk Inflow               Apr-Sep   60   60    94   42    100
 CHEC2

Cheesman Lk Inflow               Apr-Sep   67   72   125   36     93
 CHEC2N

S Platte R at S Platte           Apr-Sep  318  132   393  292    240
 SPTC2

S Platte R at S Platte           Apr-Sep  133   65   224   72    205
 SPTC2N

Bear Cr at Morrison              Apr-Sep   15   58    30    8     26
 MRRC2

Bear Cr at Morrison              Apr-Sep   15   58    30    8     26
 MRRC2N

Clear Cr at Golden               Apr-Sep   77   65   123   45    118
 GLDC2

Clear Cr at Golden               Apr-Sep   88   67   136   53    131
 GLDC2N

St. Vrain Cr at Lyons            Apr-Sep   63   80   100   41     79
 LNSC2

St. Vrain Cr at Lyons            Apr-Sep   89   82   137   61    109
 LNSC2N

Boulder Cr nr Orodell            Apr-Sep   34   72    58   23     47
 OROC2

Boulder Cr nr Orodell            Apr-Sep   50   96    74   33     52
 OROC2N

S Boulder Cr nr Eldorado Sprgs   Apr-Sep   29   83    42   15     35
 BELC2

S Boulder Cr nr Eldorado Sprgs   Apr-Sep   32   80    50   15     40
 BELC2N

Cache La Poudre at Canyon Mouth  Apr-Sep  192  178   296  107    108
 FTDC2

Cache La Poudre at Canyon Mouth  Apr-Sep  228  109   333  134    210
 FTDC2N

Lima Resvr Inflow                Apr-Sep   70   92   102   44     76
 LRRM8

Lima Resvr Inflow                Apr-Sep   70   89   102   44     79
 LRRM8N

Clark Canyon Resvr Inflow        Apr-Sep   62   56   106   48    110
 CLKM8

Clark Canyon Resvr Inflow        Apr-Sep  153   77   226  101    198
 CLKM8N

Beaverhead R at Barretts         Apr-Sep  151   76   192  138    199
 BARM8

Beaverhead R at Barretts         Apr-Sep  184   66   262  129    280
 BARM8N

Ruby R Resvr Inflow              Apr-Sep   96  109   123   74     88
 ALRM8

Ruby R Resvr Inflow              Apr-Sep   96   99   123   74     97
 ALRM8N

Big Hole R nr Melrose            Apr-Sep  480   81   659  308    595
 MLRM8

Big Hole R nr Melrose            Apr-Sep  546   83   729  376    660
 MLRM8N

Hebgen Resvr Inflow              Apr-Sep  526  113   622  424    465
 HBDM8

Hebgen Resvr Inflow              Apr-Sep  526  113   622  424    465
 HBDM8N

Ennis Resvr Inflow               Apr-Sep  798  112   954  670    715
 ELMM8

Ennis Resvr Inflow               Apr-Sep  876  120  1034  724    730
 ELMM8N

Gallatin R nr Gateway            Apr-Sep  377   79   461  306    475
 GLGM8

Gallatin R nr Gateway            Apr-Sep  377   79   461  306    475
 GLGM8N

Gallatin R at Logan              Apr-Sep  389   77   546  271    505
 LOGM8

Gallatin R at Logan              Apr-Sep  542   83   693  418    650
 LOGM8N

Missouri R at Toston             Apr-Sep 1911   93  2568 1445   2060
 TOSM8

Missouri R at Toston             Apr-Sep 2648   94  3440 2113   2830
 TOSM8N

Missouri R at Fort Benton        Apr-Sep 2026   66  2786 1676   3060
 FBNM8

Missouri R at Fort Benton        Apr-Sep 3800   93  4710 2963   4100
 FBNM8N

Missouri R nr Virgelle           Apr-Sep 2170   63  3002 1783   3420
 VRGM8

Missouri R nr Virgelle           Apr-Sep 4219   93  5312 3245   4560
 VRGM8N

Missouri R nr Landusky           Apr-Sep 2311   63  3215 1883   3680
 LDKM8

Missouri R nr Landusky           Apr-Sep 4430   91  5587 3398   4890
 LDKM8N

Missouri R below Fort Peck Dam   Apr-Sep 2500   65  3392 1977   3840
 FPKM8

Missouri R below Fort Peck Dam   Apr-Sep 4638   90  5839 3518   5180
 FPKM8N

Gibson Resvr Inflow              Apr-Sep  295   66   460  212    450
 AGSM8

Gibson Resvr Inflow              Apr-Sep  295   66   460  212    450
 AGSM8N

Marias R nr Shelby               Apr-Sep  228   52   458  147    435
 SHLM8

Marias R nr Shelby               Apr-Sep  274   56   514  184    490
 SHLM8N

Musselshell R at Harlowton       Apr-Sep   51   64    85   27     80
 HLWM8

Musselshell R at Harlowton       Apr-Sep   63   66   102   36     95
 HLWM8N

Yellowstone R at Yellowstone Lk  Apr-Sep  626   77   770  495    815
 YLOW4

Yellowstone R at Yellowstone Lk  Apr-Sep  821   98   968  632    840
 YLOW4N

Yellowstone R at Corwin Sprgs    Apr-Sep 1518   77  1833 1183   1980
 CORM8

Yellowstone R at Corwin Sprgs    Apr-Sep 1792   87  2125 1406   2070
 CORM8N

Yellowstone R at Livingston      Apr-Sep 1747   76  2080 1368   2290
 LIVM8

Yellowstone R at Livingston      Apr-Sep 2083   85  2430 1673   2440
 LIVM8N

Yellowstone R at Billings        Apr-Sep 2650   65  3091 1825   4070
 BILM8

Yellowstone R at Billings        Apr-Sep 3634   76  4118 2820   4790
 BILM8N

Yellowstone R at Miles City      Apr-Sep 3928   67  5601 3117   5850
 MILM8

Yellowstone R at Miles City      Apr-Sep 6408   83  8112 4986   7690
 MILM8N

Yellowstone R at Sidney          Apr-Sep 3968   69  5676 2978   5710
 SIDM8

Yellowstone R at Sidney          Apr-Sep 6668   83  8515 5108   8060
 SIDM8N

Boulder R at Big Timber          Apr-Sep  198   59   261  135    335
 BTMM8

Boulder R at Big Timber          Apr-Sep  239   64   303  177    375
 BTMM8N

Stillwater R nr Absarokee        Apr-Sep  369   68   479  273    540
 SRAM8

Stillwater R nr Absarokee        Apr-Sep  426   72   533  332    595
 SRAM8N

Clks Fk Yellowstone R nr Belfry  Apr-Sep  412   66   538  304    620
 BFYM8

Clks Fk Yellowstone R nr Belfry  Apr-Sep  485   70   610  377    695
 BFYM8N

Bighorn R nr St. Xavier          Apr-Sep 1230   86  1897  824   1430
 STXM8

Bighorn R nr St. Xavier          Apr-Sep 2466  100  3490 1729   2460
 STXM8N

Little Bighorn R nr Hardin       Apr-Sep   97   76   258   63    127
 HRDM8

Little Bighorn R nr Hardin       Apr-Sep   97   76   258   63    127
 HRDM8N

Tongue R nr Dayton               Apr-Sep   64   67    81   42     96
 DAYW4

Tongue R nr Dayton               Apr-Sep   69   68    86   47    101
 DAYW4N

Tongue R nr Decker               Apr-Sep  127   54   199   61    235
 DSLM8

Tongue R nr Decker               Apr-Sep  173   72   249  102    240
 DSLM8N

Tongue R Resvr Inflow            Apr-Sep  130   55   208   61    235
 DKRM8

Tongue R Resvr Inflow            Apr-Sep  177   72   258  102    245
 DKRM8N

Powder R at Moorhead             Apr-Sep  128   57   309   51    225
 MHDM8

Powder R at Moorhead             Apr-Sep  167   62   341   75    270
 MHDM8N

Powder R nr Locate               Apr-Sep  149   57   380   60    260
 LOCM8

Powder R nr Locate               Apr-Sep  190   62   437   83    305
 LOCM8N


Locations with an `N` suffix indicate natural flows excluding
stream augmentations.

KAF: Thousands of Acre-feet

%AVG: Current 50%/AVG

AVG: Average(50%) seasonal runoff voulme as simulated by the river
forecast model considering acontinuous simulation of the basin
response to historic climate data (observed precipitation and
temperatures) over the period of 1991-2020.

The 50%, 10% and 90% columns indicate the probability that the
actual volume will exceed the forecast for the valid time period.

Beginning April 1, May and June official forecasts include observed
runoff volume up to official forecast date.

For more information, please visit: www.weather.gov/mbrfc/water

