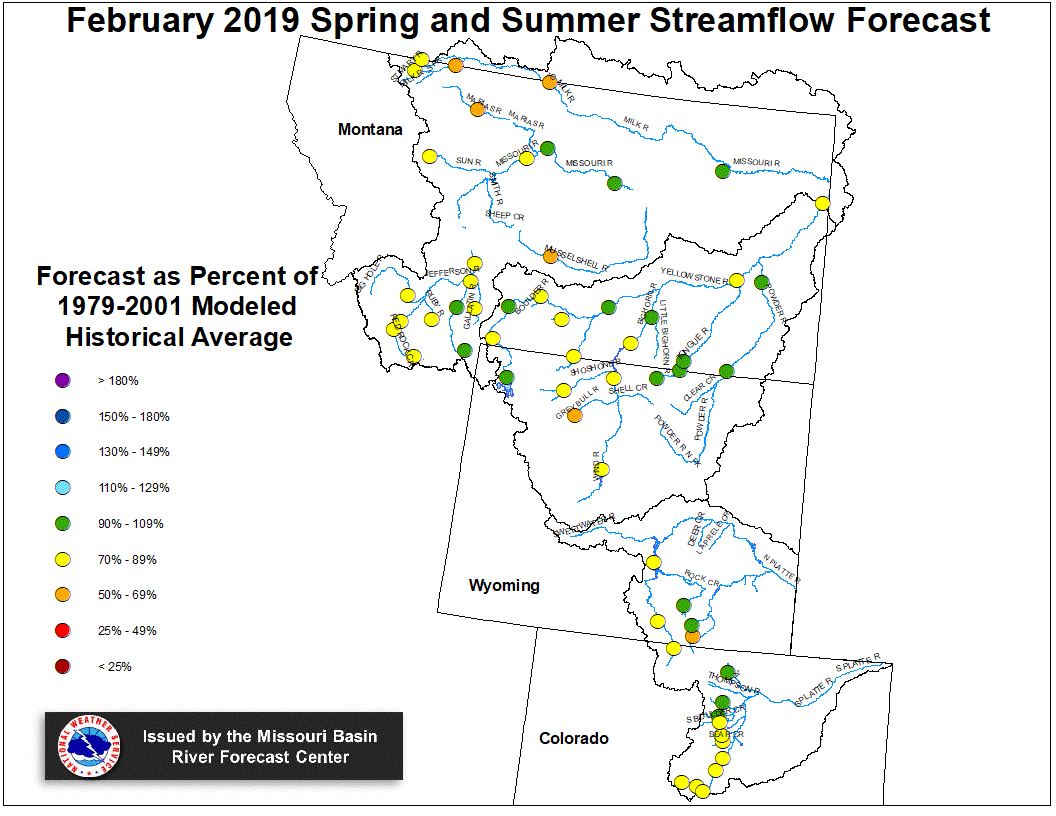
February 1, 2019 Spring and Summer Streamflow Forecasts
Upper Missouri Basin
The high elevation snow pack in the Upper Missouri Basin as of February 1
was near average. The snow pack above Fort Peck, Montana was
100 percent. The snow pack in the St. Mary Basin was 81 percent, and the
Milk River Basin was 147 percent.
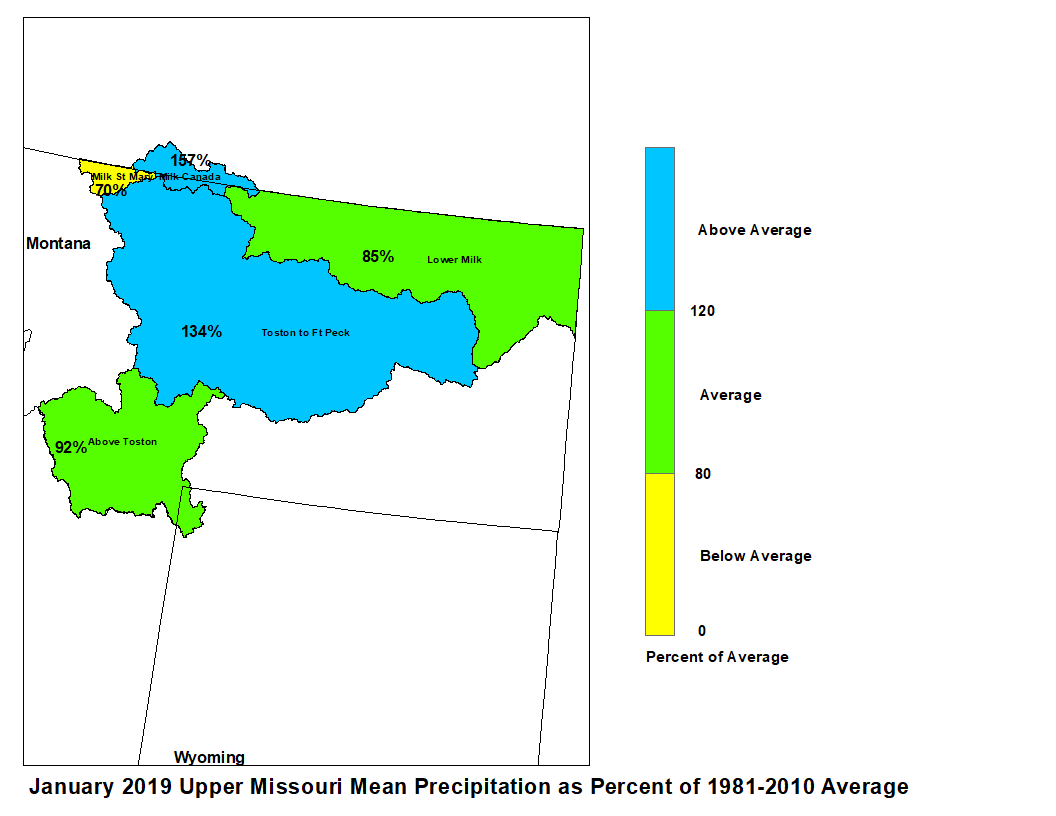
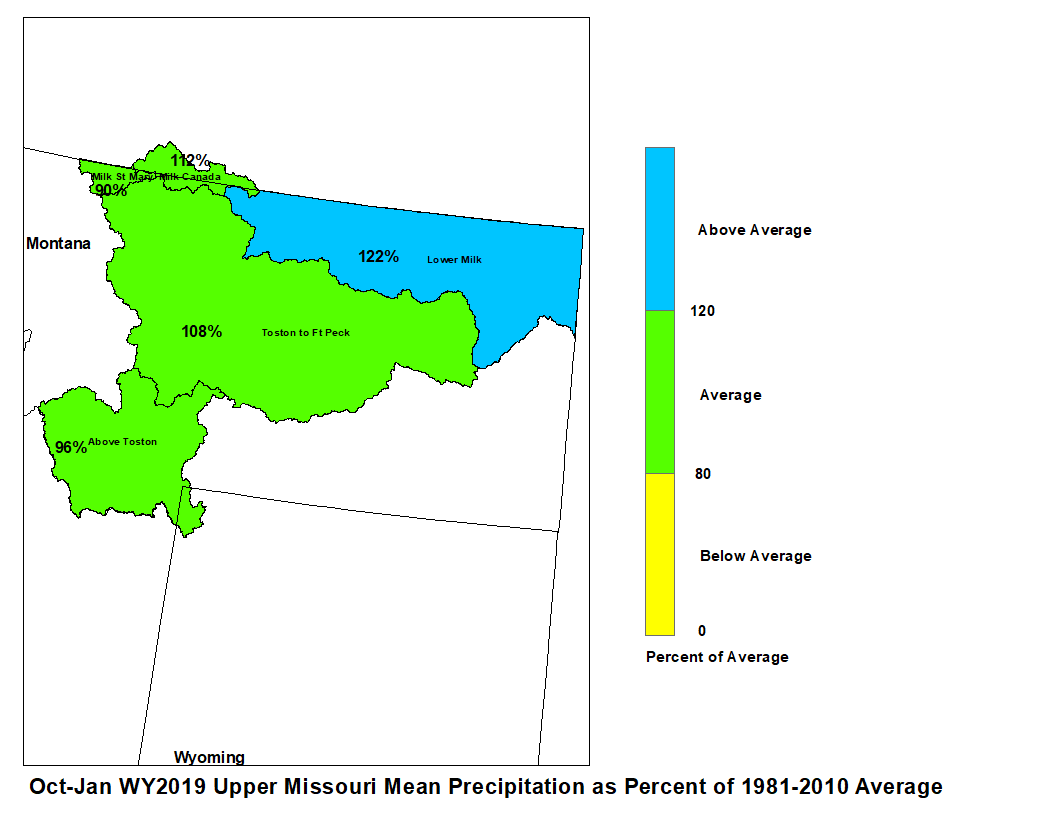
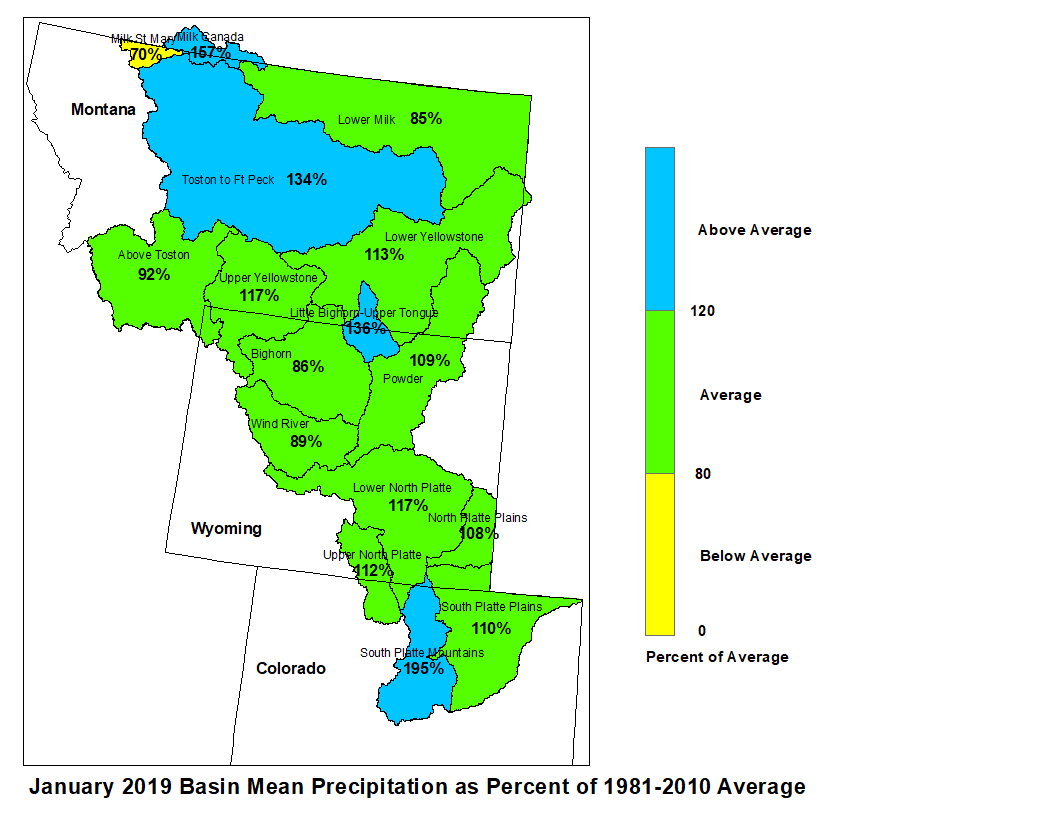
January precipitation across the Upper Missouri Basin was near to above average.
Basin precipitation summaries for the Missouri Basin include: Milk St. Mary,
70 percent; Milk Canada, 157 percent; Lower Milk, 85 percent; above Toston,
92 percent; Toston to Ft. Peck, 134 percent.
January 2019 Upper Missouri Mean Precip Oct-Jan WY2019 Upper Missouri Mean Precip
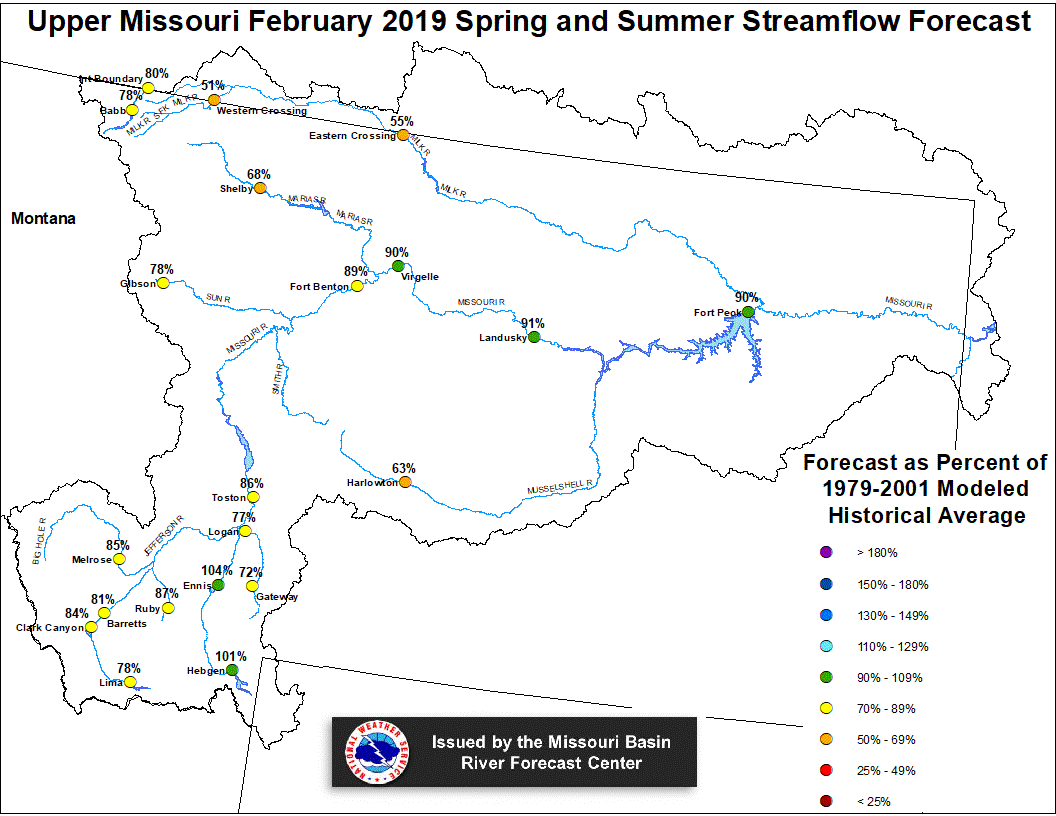
Stream flow in the Upper Missouri Basin is forecast to be
below average during the upcoming Spring and Summer.
The St. Mary River is forecast to have 80 percent of average
April-September flows. Runoff is expected to range around
90 percent of average for the Missouri Basin above Fort Peck,
Montana.
Upper Missouri February 1, 2019 Spring and Summer Streamflow Forecasts
Of the four major irrigation reservoirs in Montana; Lima
Reservoir had 166 percent average storage, Clark Canyon was
holding 127 percent of average water, Gibson Reservoir had 43
percent of average stored water, and Fresno Reservoir had
98 percent of average stored water.
The major hydroelectric reservoirs in Montana (Canyon Ferry and
Fort Peck), had monthend storage in the average to above
average range; 101 and 119 percent of average water, respectively.
Yellowstone Basin
The high elevation snow pack in the Yellowstone Basin was near average
on February 1. The snow pack in the Upper Yellowstone Basin was 98 percent
of average. The snow packs in the Wind, Bighorn, and Shoshone Basins were 87,
97, and 91 percent of average, respectively. The snow packs in the Tongue
and Powder basins were 88 and 101 percent of average, respectively.
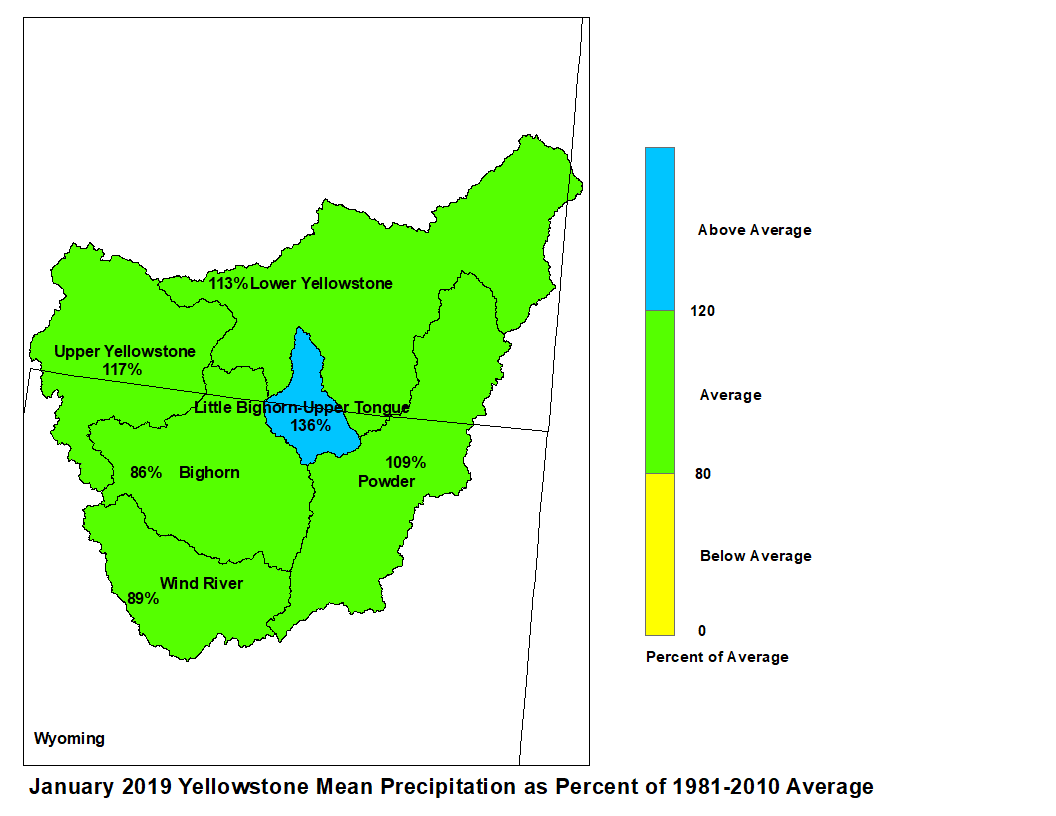
Precipitation during January ranged from below to above average. The Upper
Yellowstone River Basin received 117 percent of average precipitation while
the Lower Yellowstone River Basin reported 113 percent of average. The
Bighorn Basin received 86 percent of average precipitation while the
Wind River Basin received 89 percent of average. The Little Bighorn -
Upper Tongue Basin received 136 percent of average and the Powder River
had 109 percent of average precipitation.
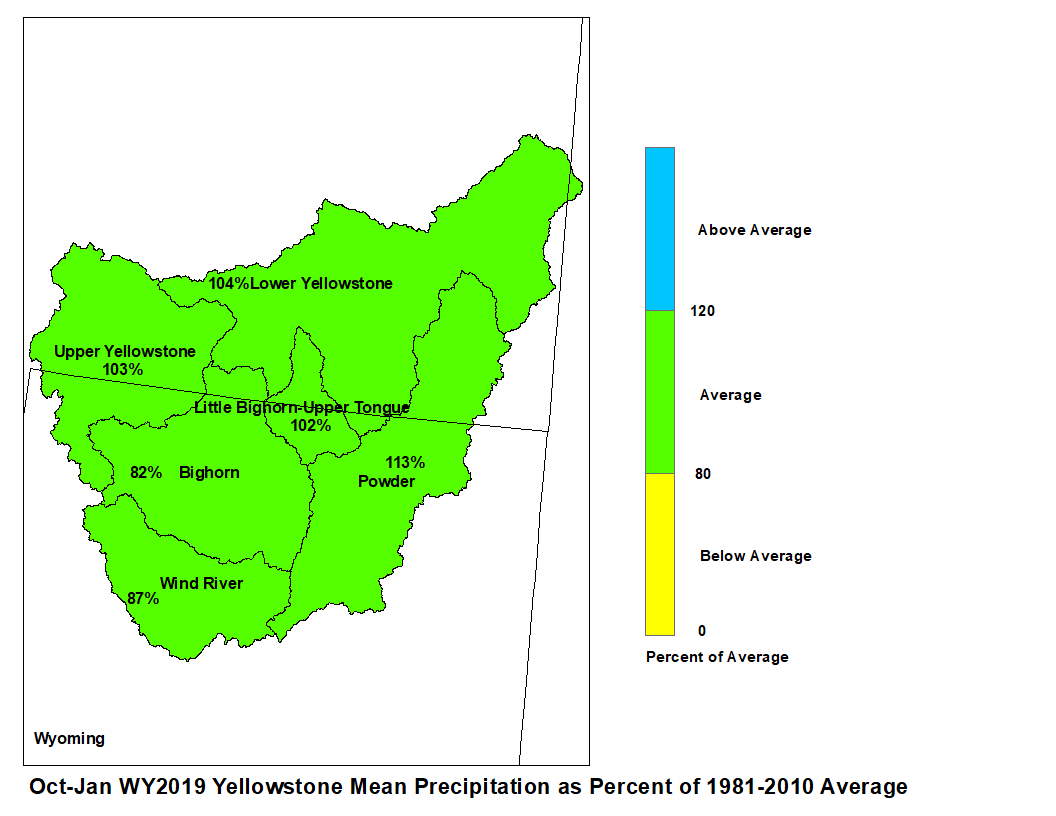
January 2019 Yellowstone Mean Precip Oct-Jan WY2019 Yellowstone Mean Precip
Forecast stream flow in the Yellowstone Basin is near average
for the upcoming Spring and Summer. Stream flow for the
Yellowstone River above Sidney, Montana is forecast to be about
89 percent of average. Flow in the Tongue Basin is expected to be
95 percent of average. Flows in the Powder River are expected
to be about 97 percent of average.
Monthend storage at Boysen Reservoir was 109 percent of average.
Stored water in Buffalo Bill Reservoir was 127 percent of average.
Monthend storage was 100 percent of average at Bighorn Reservoir.
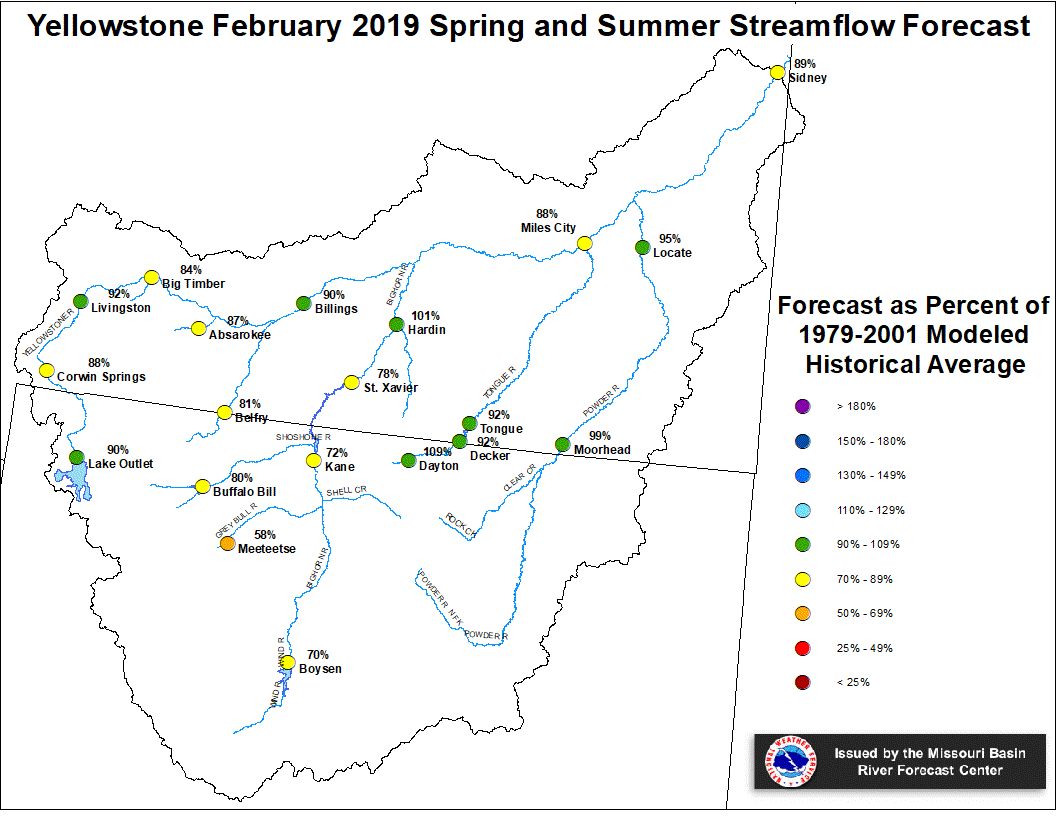
Yellowstone February 1, 2019 Spring and Summer Streamflow Forecasts
Platte Basin
The high elevation snow pack in the Upper North Platte Basin was
106 percent of average on February 1. The snow pack in the North Platte
Basin below Seminoe Reservoir was 137 percent of average. The snow
pack in the South Platte Basin was 104 percent of average.
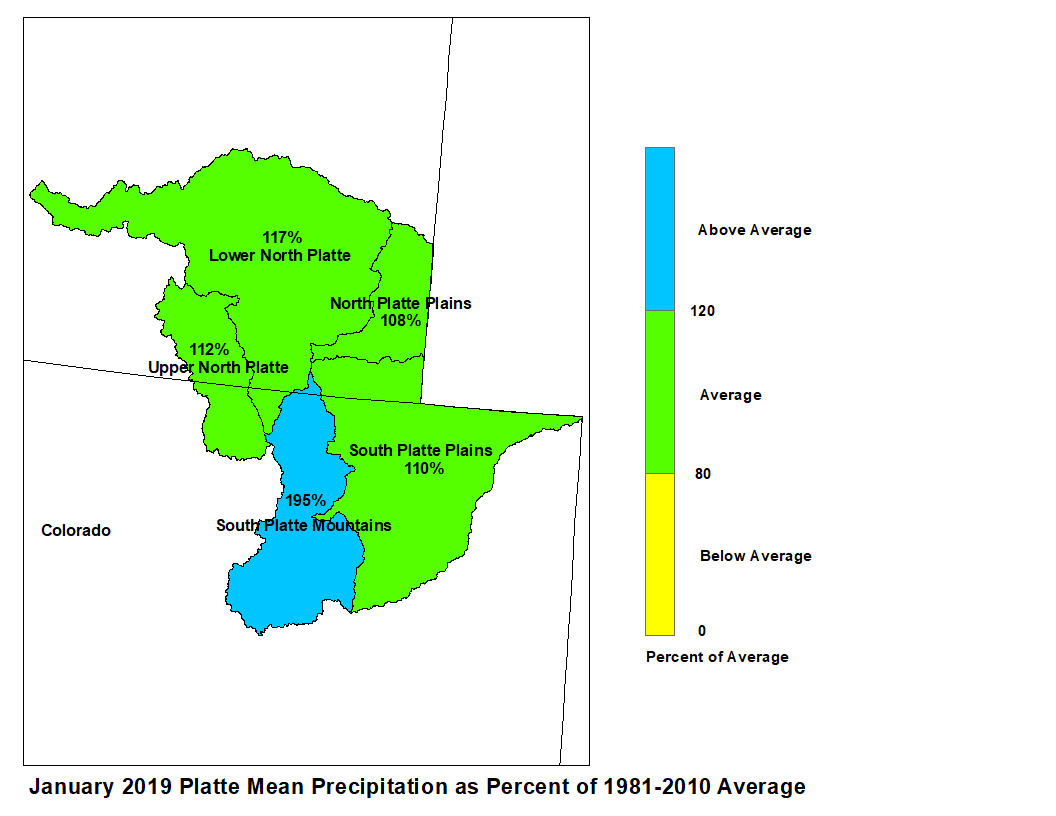
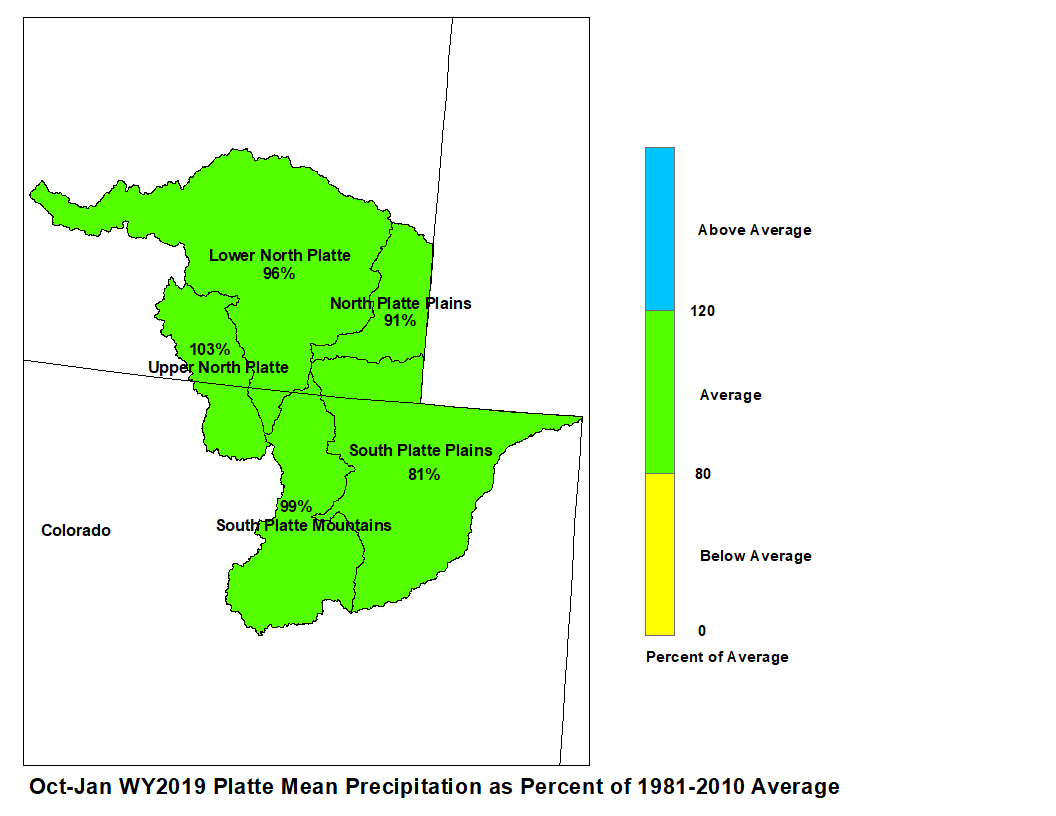
Precipitation during January in the Upper North Platte Basin was 112
percent of average. In the Lower North Platte Basin, precipitation
was 117 percent of average. The North Platte Plains below Guernsey
Reservoir had 108 percent. The South Platte Mountains had 195
percent whereas the Plains had 110 percent of average January
precipitation.
January 2019 Platte Mean Precip Oct-Jan WY2019 Platte Mean Precip
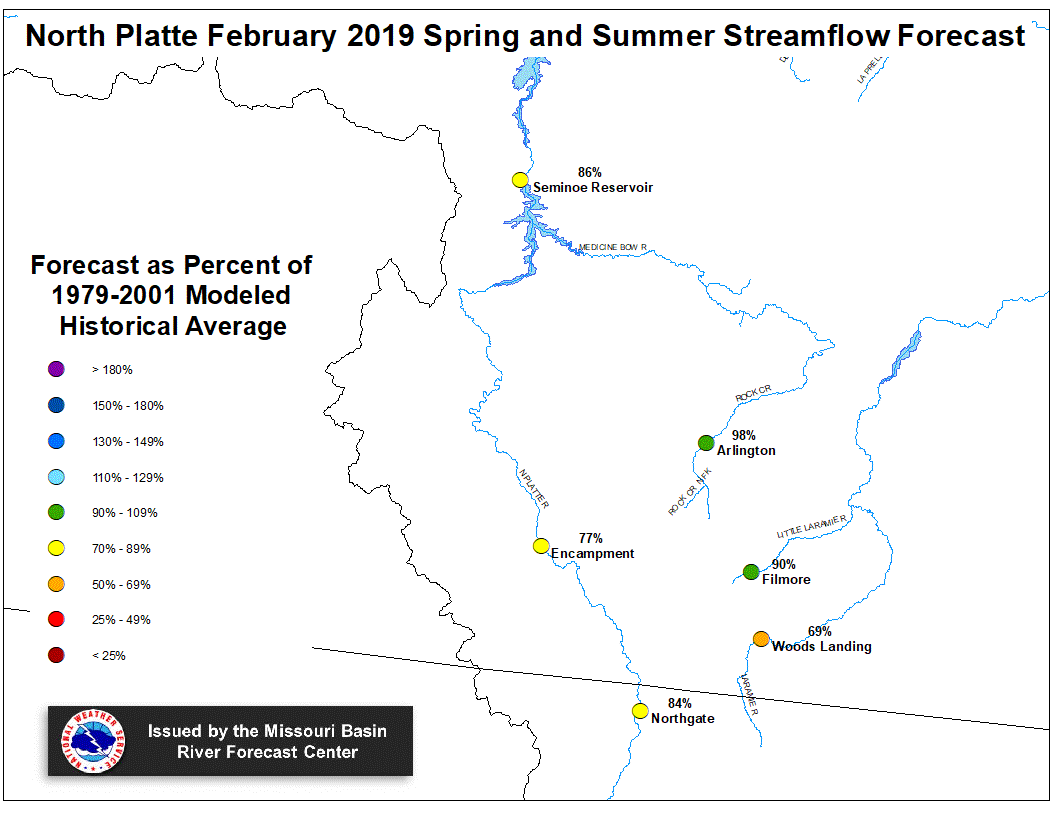
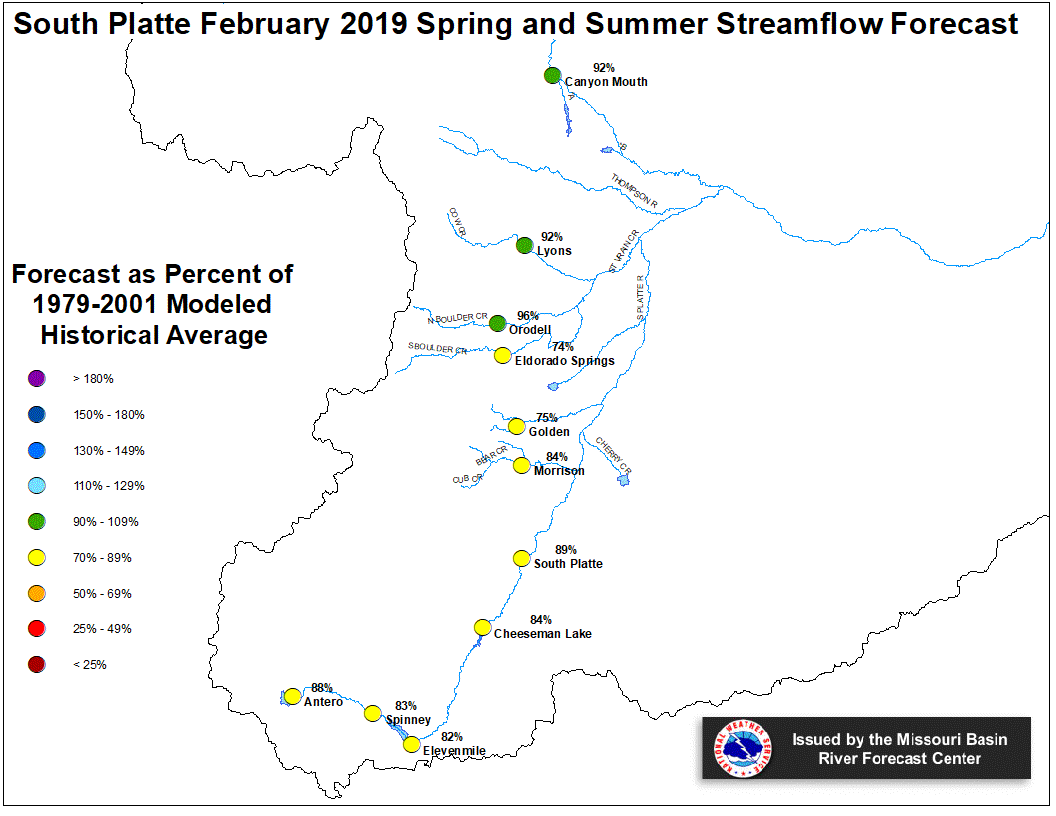
Stream flow in the Platte Basin is forecast to be near
average during the upcoming Spring and Summer. Runoff
for streams above Seminoe Reservoir are expected to be
about 94 percent of average. Streams in the South Platte
Basin above South Platte, Colorado can expect 90 percent
of average flow. For the remainder of the South Platte
basin, flows are expected near 85 percent.
Stored water in the South Platte Basin was 103 percent of average
on February 1.
North Platte Streamflow Fcst South Platte Streamflow Fcst
WATER SUPPLY FORECAST
NWS MISSOURI BASIN RIVER FORECAST CENTER
PLEASANT HILL MISSOURI

1045 CST MONDAY FEBRUARY 04 2019

DATA CURRENT AS OF: FEBRUARY 03 2019

MISSOURI/YELLOWSTONE/PLATTE RIVER BASIN FORECASTS


                                        50%   %   10%   90%   AVG
                                PERIOD (KAF) AVG (KAF) (KAF) (KAF)
-----------------------------------------------------------------
BOYSEN RESERVOIR INFLOW         APR-SEP 731  70%  1326  456   1047
SBDW4N
BIGHORN R AT KANE               APR-SEP 1179 72%  1959  791   1633
LVEW4N
GREYBULL R NR MEETEETSE         APR-SEP 136  58%  251   70    235
MEEW4N
BUFFALO BILL RESERVOIR INFLOW   APR-SEP 547  80%  751   416   679
CDYW4N
ST MARY R NR BABB               APR-SEP 326  78%  416   273   418
SMYM8N
ST MARY R AT INT BOUNDARY       APR-SEP 388  80%  506   322   485
SMBM8N
MILK R NR CUTBANK               APR-SEP 20   51%  47    7     39
PDBM8N
MILK R AT EASTERN CROSSING      APR-SEP 39   55%  106   15    70
ERNM8N
NORTH PLATTE R NR NORTHGATE     APR-SEP 259  84%  432   141   308
NGTC2
ENCAMPMENT R NR ENCAMPMENT      APR-SEP 113  76%  159   73    147
ERCW4
ENCAMPMENT R NR ENCAMPMENT      APR-SEP 121  77%  167   82    156
ECRW4N
ROCK CK NR ARLINGTON            APR-SEP 49   98%  68    37    50
KCRW4
ROCK CK NR ARLINGTON            APR-SEP 49   98%  68    37    50
KCRW4N
SEMINOE RESERVOIR INFLOW WY     APR-SEP 690  84%  1098  376   826
SETW4
SEMINOE RESERVOIR INFLOW WY     APR-SEP 841  86%  1249  507   981
SETW4N
LARAMIE R NR WOODS              APR-SEP 39   53%  97    16    73
WODW4
LARAMIE R NR WOODS              APR-SEP 74   69%  133   43    108
WODW4N
LITTLE LARAMIE R NR FILMORE     APR-SEP 48   90%  79    36    54
SMTW4
LITTLE LARAMIE R NR FILMORE     APR-SEP 50   90%  82    38    56
SMTW4N
ANTERO RESERVOIR INFLOW         APR-SEP 14   88%  21    9     16
ANRC2N
SPINNEY MOUNTAIN RES INFLOW     APR-SEP 42   83%  79    28    51
SPYC2N
ELEVENMILE CANYON RES INFLOW    APR-SEP 46   82%  86    30    56
EVNC2N
CHEESMAN LAKE INFLOW            APR-SEP 88   84%  166   58    105
CHEC2N
SOUTH PLATTE R AT SOUTH PLATTE  APR-SEP 168  89%  294   112   188
SPTC2N
BEAR CK AT MORRISON             APR-SEP 15   84%  34    8     18
MRRC2N
CLEAR CK AT GOLDEN              APR-SEP 93   75%  145   62    124
GLDC2N
ST VRAIN CK AT LYONS            APR-SEP 83   92%  121   59    91
LNSC2N
BOULDER CK NR ORODELL           APR-SEP 48   96%  68    36    50
OROC2N
S BOULDER CK NR ELDORADO SPR    APR-SEP 28   74%  44    15    38
BELC2N
CACHE LA POUDRE AT CANYON MOUTH APR-SEP 184  92%  309   109   201
FTDC2N
LIMA RESERVOIR INFLOW           APR-SEP 47   78%  79    29    60
LRRM8N
CLARK CANYON RESERVOIR INFLOW   APR-SEP 115  84%  174   81    137
CLKM8N
BEAVERHEAD R AT BARRETTS        APR-SEP 138  81%  198   102   170
BARM8N
RUBY R RESERVOIR INFLOW         APR-SEP 75   87%  95    57    86
ALRM8N
BIG HOLE R NR MELROSE           APR-SEP 420  83%  613   297   506
MLRM8
BIG HOLE R NR MELROSE           APR-SEP 476  85%  669   353   563
MLRM8N
HEBGEN RESERVOIR INFLOW         APR-SEP 396  101% 489   330   393
HBDM8N
ENNIS RESERVOIR INFLOW          APR-SEP 726  104% 838   596   700
ELMM8N
GALLATIN R NR GATEWAY           APR-SEP 329  72%  405   250   459
GLGM8
GALLATIN R NR GATEWAY           APR-SEP 329  72%  405   250   459
GLGM8N
GALLATIN R AT LOGAN             APR-SEP 310  68%  432   204   454
LOGM8
GALLATIN R AT LOGAN             APR-SEP 445  77%  565   331   575
LOGM8N
MISSOURI R AT TOSTON            APR-SEP 2191 86%  2843  715   2556
TOSM8N
MISSOURI R AT FORT BENTON       APR-SEP 3442 89%  4490  674   3866
FBNM8N
MISSOURI R NR VIRGELLE          APR-SEP 3920 90%  5175  999   4348
VRGM8N
MISSOURI R NR LANDUSKY          APR-SEP 4108 91%  5525  168   4534
LDKM8N
MISSOURI R BLW FT PECK DAM      APR-SEP 4335 90%  5785  308   4817
FPKM8N
GIBSON RESERVOIR INFLOW         APR-SEP 273  78%  451   192   351
AGSM8N
MARIAS R NR SHELBY              APR-SEP 291  68%  500   207   428
SHLM8N
MUSSELSHELL R AT HARLOWTON      APR-SEP 69   63%  110   44    110
HLWM8N
YELLOWSTONE R AT YELLOWSTONE LK APR-SEP 542  82%  683   431   657
YLOW4APR
YELLOWSTONE R AT YELLOWSTONE LK APR-SEP 739  90%  894   584   823
YLOW4N
YELLOWSTONE R AT CORWIN SPRINGS APR-SEP 1405 84%  1709  137   1673
CORM8
YELLOWSTONE R AT CORWIN SPRINGS APR-SEP 1683 88%  2017  322   1912
CORM8N
YELLOWSTONE R AT LIVINGSTON     APR-SEP 1699 89%  2017  370   1913
LIVM8
YELLOWSTONE R AT LIVINGSTON     APR-SEP 2037 92%  2391  631   2208
LIVM8N
YELLOWSTONE R AT BILLINGS       APR-SEP 2871 87%  3380  172   3300
BILM8
YELLOWSTONE R AT BILLINGS       APR-SEP 3881 90%  4403  119   4311
BILM8N
YELLOWSTONE R AT MILES CITY     APR-SEP 6267 88%  7650  855   7106
MILM8N
YELLOWSTONE R AT SIDNEY         APR-SEP 6558 89%  7990  24    7328
SIDM8N
BOULDER R AT BIG TIMBER         APR-SEP 222  81%  264   171   273
BTMM8
BOULDER R AT BIG TIMBER         APR-SEP 263  84%  304   212   314
BTMM8N
STILLWATER R NR ABSAROKEE       APR-SEP 425  86%  494   354   495
SRAM8
STILLWATER R NR ABSAROKEE       APR-SEP 482  87%  552   411   552
SRAM8N
CLARKS FK YELWSTONE R NR BELFRY APR-SEP 385  79%  500   298   490
BFYM4
CLARKS FK YELWSTONE R NR BELFRY APR-SEP 458  81%  570   371   562
BFYM4N
BIGHORN R NR ST XAVIER          APR-SEP 1859 78%  2823  259   2383
STXM8N
LITTLE BIGHORN R NR HARDIN      APR-SEP 105  101% 170   72    104
HRDM8N
TONGUE R NR DAYTON              APR-SEP 89   109% 114   64    82
DAYW4N
TONGUE R NR DECKER              APR-SEP 202  92%  286   137   220
DSLM8N
TONGUE R RESERVOIR INFLOW       APR-SEP 203  92%  293   139   222
DKRM8N
POWDER R NR LOCATE              APR-SEP 195  99%  355   116   198
MHDM8
POWDER R NR LOCATE              APR-SEP 208  95%  422   122   219
LOCM8N

LOCATIONS WITH AN "N" SUFFIX INDICATE NATURAL FLOWS EXCLUDING
STREAM AUGMENTATIONS

KAF: THOUSANDS OF ACRE-FEET

%AVG: CURRENT 50%/AVG

AVG: AVERAGE (50%) SEASONAL RUNOFF VOLUME AS SIMULATED BY THE
RIVER FORECAST MODEL CONSIDERING A CONTINUOUS SIMULATION OF THE
BASIN RESPONSE TO HISTORIC CLIMATE DATA (OBSERVED PRECIPITATION
AND TEMPERATURES) OVER THE PERIOD OF 1981-2010

THE 50%  10%  AND 90% COLUMNS INDICATE THE PROBABILITY THAT THE
ACTUAL VOLUME WILL EXCEED THE FORECAST FOR THE VALID TIME PERIOD

FOR MORE INFORMATION, PLEASE VISIT: WWW.WEATHER.GOV/MBRFC/WATER


