
Heavy to excessive rainfall is forecast over north Texas into Oklahoma Tuesday. Locally catastrophic flooding will be possible across portions of southwest Oklahoma. Flood Watches have been issued. Scattered severe thunderstorms are possible within a broad swath from the lower Great Lakes to the southern High Plains Tuesday afternoon into the evening. Read More >
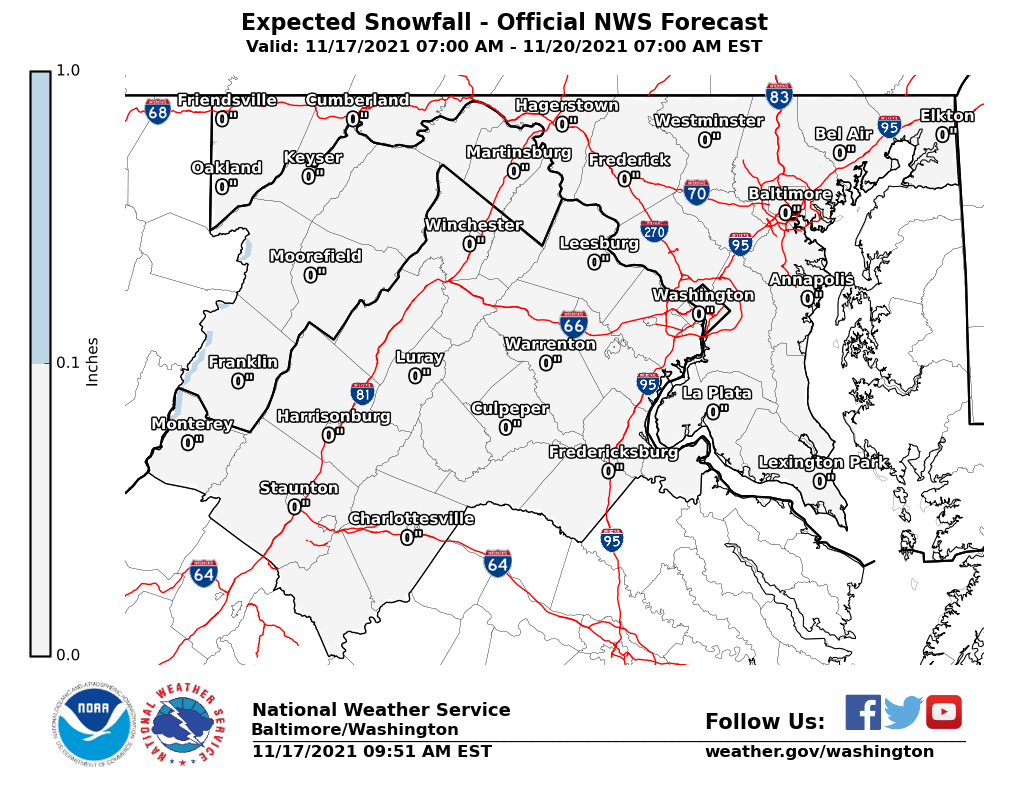
| Snow Accumulation Potential
Experimental - Leave feedback
|
||
| Minimum | MOST LIKELY SNOWFALL | Maximum |
|---|---|---|
|
Expect at least this much:
|
Potential for this much:
|
|
 |
  |
 |
| What's this? | What's this? | What's this? |
Minimum Potential AccumulationExpect at least this much. This is what we see as the least amount of snow the storm can produce. This information is for advance planning ahead of the storm. It is provided out as far as three days. However, when the snow starts to fall, this will be discontinued to focus on the forecast snow amount. Most Likely Snow AccumulationRepresents our official snow forecast in inches within the next one to three days. The snowfall amounts are provided in point (single number) and ranges (1-2", 2-4", etc.). You can toggle between the two by hovering over the "Point" and "Range" text above the image. The point amount is our forecast but the range for the "most likely" represents the forecast uncertainty in predefined ranges. CloseMaximum Potential AccumulationWhat you should be prepared for. This is what we see as the storm's maximum potential snowfall accumulation. This information is for advance planning ahead of the storm. It is provided out as far as three days. However, when the snow starts to fall, this will be discontinued to focus on the forecast snow amount. Close |
||
| Other Snow/Ice Information | ||
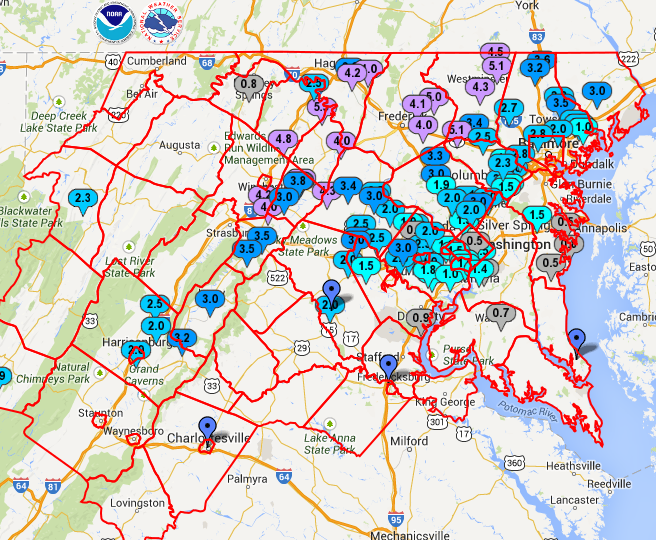
| Storm Track | Reported Snow/Ice Totals | |
|---|---|---|
 |
 |
|
| What's this? | What's this? | |
Low Tracks GraphicThe graphic depicts the forecast location of significant surface lows impacting the 48 contiguous United States in 12 hour increments out to 72 hours into the future. The low position and track forecast by NCEP WPC meteorologist is in white. Each low position is accompanied by a lead time (Eastern Time). The circles around each low represents a 75% probability the observed low will be located with the circle. Note: The probability is derived using previous season's verification data. For reference, existing surface lows are depicted with a red marker without yellow circles. ClosePrecipitation OnsetMost likely time of winter precipitation onset (snow, sleet, freezing rain). Rain is not included here. This information is provided when we issue a Warning or Advisory for expected snow or ice accumulation; typically six to 24 hours in advance. Times are only given for places that are under a Warning or Advisory. They will be blank in areas outside Warnings or Advisories. ReportedAs snow and/or ice reports come into the NWS (you can email reports to lwx-report@noaa.gov or Tweet to @NWS_BaltWash), we will pass them on here. With the map linked here, and the supporting reports below it, you can keep tabs on how much has fallen. |
||
| Active Watches/Warnings/Statements | |
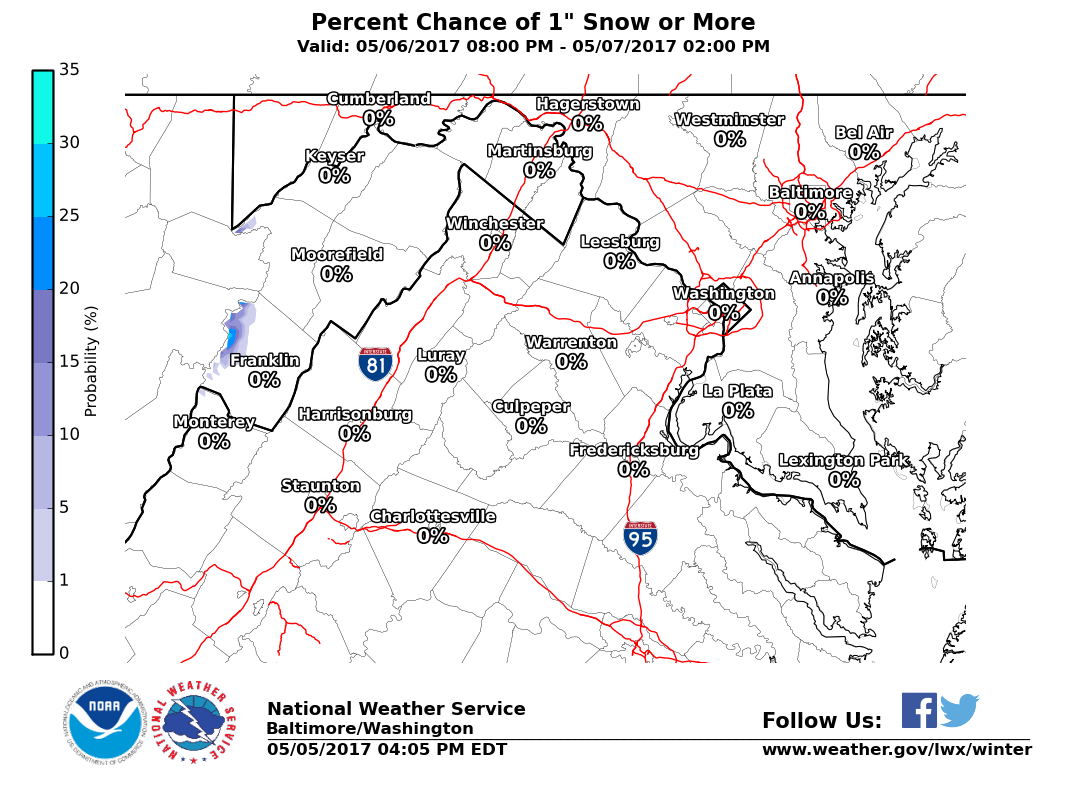
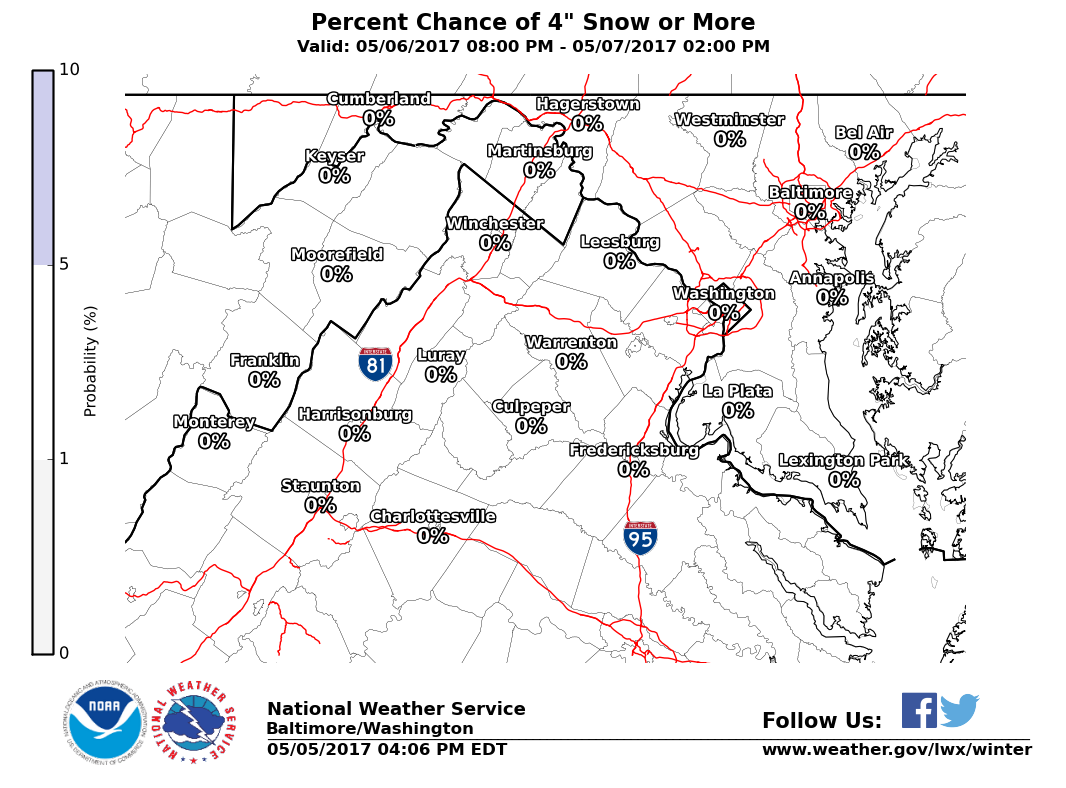
| Percent Chance That Snow Accumulation Will Be Greater Than... Experimental - Leave feedback What's this? Exceedance ProbabilitiesRepresents the likelihood of exceeding a specific snowfall amount. Thresholds are 0.1", 1", 2", 4", 6", 8", 12", and 18". This product is designed to indicate high or low confidence in the official snowfall forecast. Example: An 80% chance of exceeding 2" means that we have a high confidence that it will snow at least 2". Conversely, a 10% chance of exceeding 18" means that we have high confidence that it will snow less than 18". Close
|
||||||||||||||||
|
||||||||||||||||
| Chance of Snow Accumulation Experimental - Leave feedback What's this? Snow AccumulationRangesRepresents the likelihood of various snowfall ranges. Amounts ranges are 0", 1-2", 2-4", 4-6", 6-8", 8-12", 12-18" and 18" +. This product is designed to indicate high or low confidence in the official snowfall forecast. ExceedanceRepresents the likelihood of exceeding a specific snowfall amount. Thresholds are 0.1", 1", 2", 4", 6", 8", 12", and 18". This product is designed to indicate high or low confidence in the official snowfall forecast. |
|
|
| Long-Range Forecast | |
| Days 4-5 Forecast Precipitation | Days 6-7 Forecast Precipitation |
 |
 |
|
Days 6-10 |
|
| Temperature | Precipitation |
 |
 |
|
Days 8-14 |
|
| TEMPERATURE | PRECIPITATION |
 |
 |
|
Week 3-4 |
|
|
TEMPERATURE |
PRECIPITATION |
 |
 |
| Baltimore-Washington Products | ||||
| HAZARDOUS WEATHER OUTLOOK | FORECAST DISCUSSION | SHORT TERM FORECAST | SPECIAL WEATHER STATEMENT | PUBLIC INFORMATION STATEMENT |
| RADAR Products | ||||||||||||
 |
 |
 |
Adjacent Radars:
|
|||||||||
| Useful Winter Weather Information | ||
| Historic Mid-Atlantic Winter Storms |
Winter/Snowfall Statistics |
El Niño and DC/Baltimore Winters |
| Watches, Warnings, & Advisories |
How to Measure Snow |
La Niña and DC/Baltimore Winters |
|
|
||
| At Home | On the Road | Outside in the Cold |


 Coastal Flood
 FAQ
FAQ