
A heat wave over the Southwest will intensify late week, peaking and expanding into the Intermountain West and northern High Plains this weekend. Severe thunderstorms and heavy rain are expected over portions of the Plains and Mississippi Valley tonight, which will shift to parts of the Upper Midwest and mid-Mississippi Valley Friday. Monsoonal showers and flooding persist in the Desert Southwest. Read More >
| Snow and Sleet Amount Potential
Experimental - Leave feedback
|
|
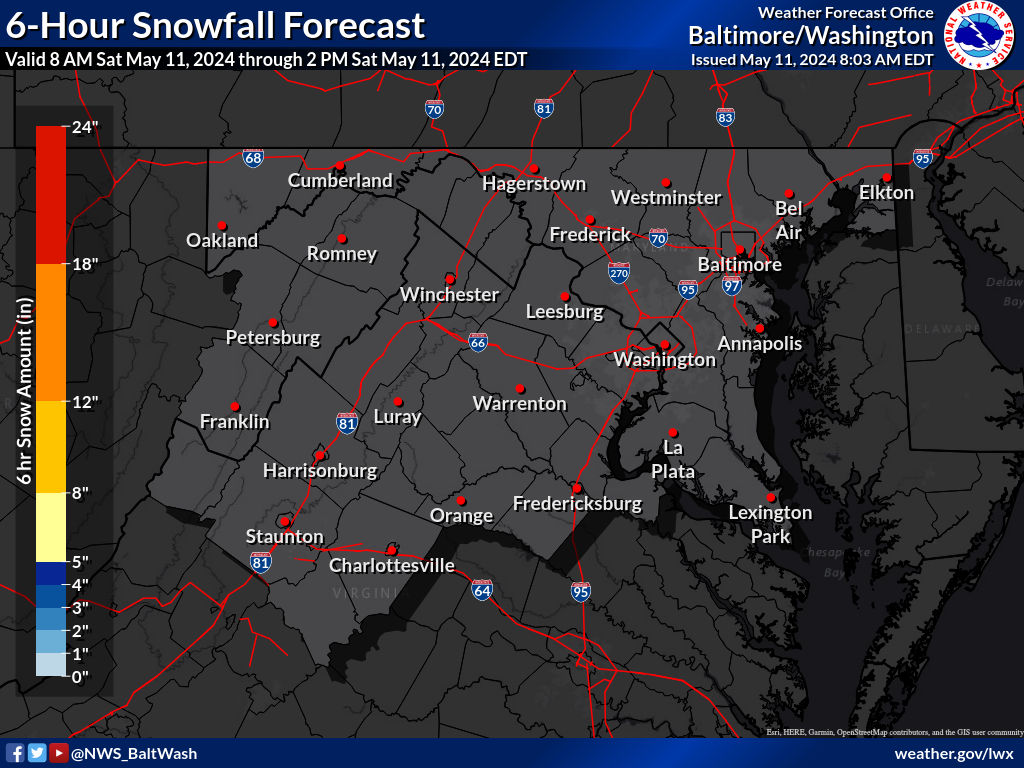
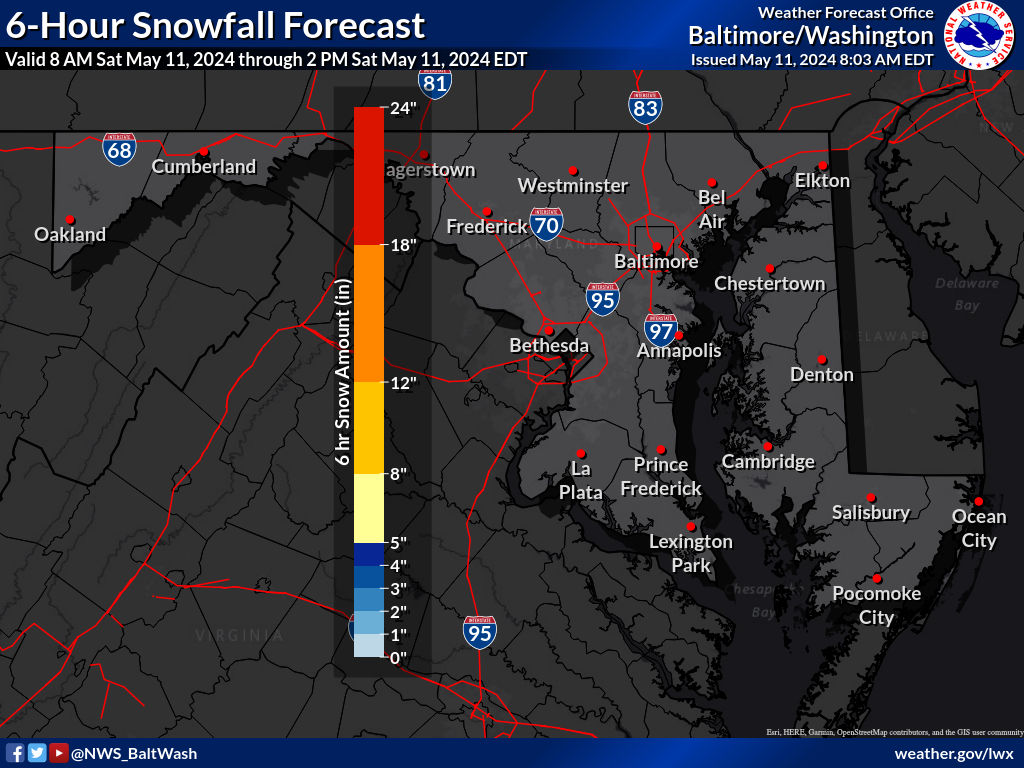
| Expected Snowfall and Sleet - Official NWS Forecast
The "Point" map is the official NWS snowfall forecast in inches during the time period shown on the graphic. This snowfall amount is determined by NWS forecasters to be the most likely outcome based on evaluation of data from computer models, satellite, radar, and other observations.
The "Range" map is the 25th percentile (lower number) to 75th percentile (higher number) of possible snowfall amounts based on the Weather Prediction Center (WPC) Super Ensemble output during the time period of the graphic. The official NWS snowfall forecast influences this range of values either up or down depending upon how closely they match. |
High End Amount 1 in 10 Chance (10%) of Higher Snowfall What's this? |
| Low End Amount 9 in 10 Chance (90%) of Higher Snowfall What's this? |
|
| Percent Chance That Snow and Sleet Amounts Will Be Greater Than...
Experimental - Leave feedback
What's this?
|
||||||||||||||||
|
||||||||||||||||
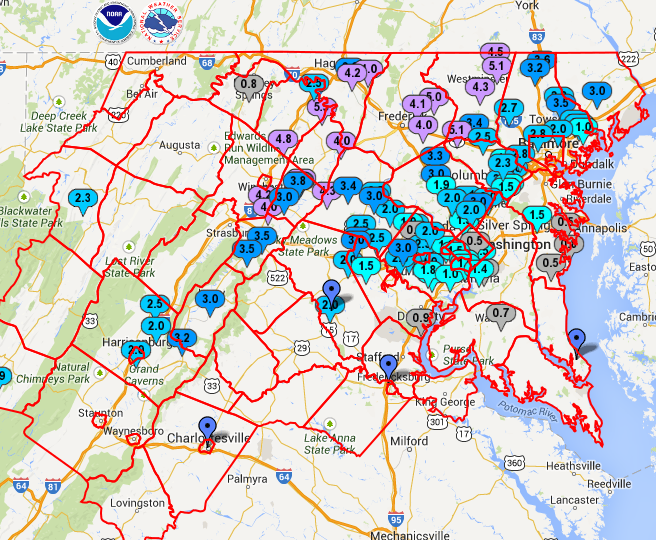
| Snowfall and Sleet Totals by Location
Experimental - Leave feedback
What's this?
|
|
|
| Snow and Sleet Amount Potential
Experimental - Leave feedback
|
|
| Expected Snowfall - Official NWS Forecast
The "Point" map is the official NWS snowfall forecast in inches during the time period shown on the graphic. This snowfall amount is determined by NWS forecasters to be the most likely outcome based on evaluation of data from computer models, satellite, radar, and other observations.
The "Range" map is the 25th percentile (lower number) to 75th percentile (higher number) of possible snowfall amounts based on the Weather Prediction Center (WPC) Super Ensemble output during the time period of the graphic. The official NWS snowfall forecast influences this range of values either up or down depending upon how closely they match. |
High End Amount 1 in 10 Chance (10%) of Higher Snowfall What's this? |
| Low End Amount 9 in 10 Chance (90%) of Higher Snowfall What's this? |
|
| Percent Chance That Snow and Sleet Amounts Will Be Greater Than...
Experimental - Leave feedback
What's this?
|
||||||||||||||||
|
||||||||||||||||
| Ice Accumulation Potential
Experimental - Leave feedback
|
|
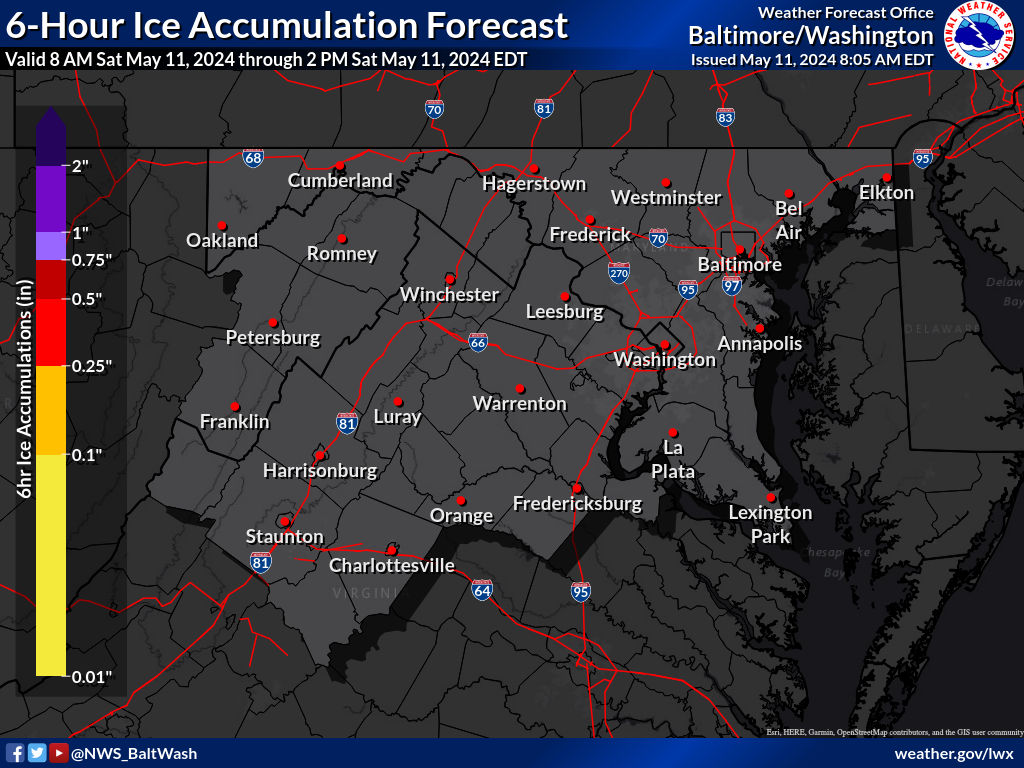
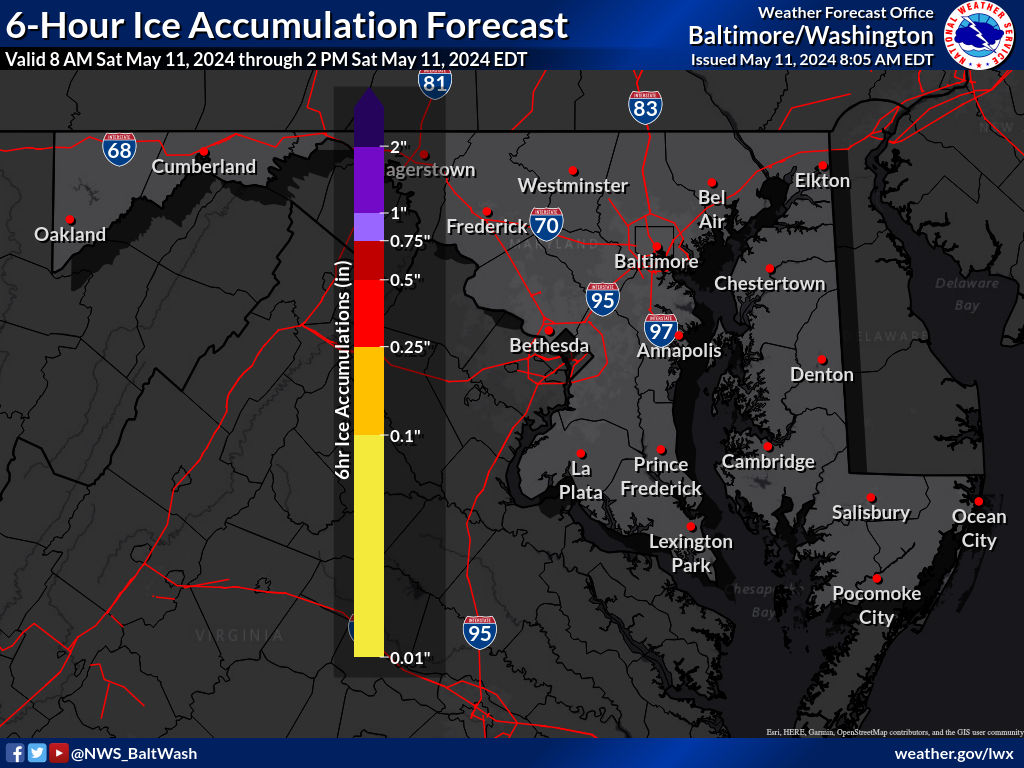
| Expected Ice Accumulation - Official NWS Forecast
The "Point" map is the official NWS ice accumulation forecast in inches during the time period shown on the graphic. This ice accumulation amount is determined by NWS forecasters to be the most likely outcome based on evaluation of data from computer models, satellite, radar, and other observations.
The "Range" map is the 25th percentile (lower number) to 75th percentile (higher number) of possible ice accumulation amounts based on the Weather Prediction Center (WPC) Super Ensemble output during the time period of the graphic. The official NWS ice accumulation forecast influences this range of values either up or down depending upon how closely they match. |
High End Amount 1 in 10 Chance (10%) of Higher Ice Accumulation What's this? |
| Low End Amount 9 in 10 Chance (90%) of Higher Ice Accumulation What's this? |
|
| Percent Chance That Ice Accumulation Will Be Greater Than...
Experimental - Leave feedback
What's this?
|
||||||||||||||||
|
||||||||||||||||
| Ice Accumulation by Location
Experimental - Leave feedback
What's this?
|
|
|
| Ice Accumulation Potential
Experimental - Leave feedback
|
|
| Expected Ice Accumulation - Official NWS Forecast
The "Point" map is the official NWS ice accumulation forecast in inches during the time period shown on the graphic. This ice accumulation amount is determined by NWS forecasters to be the most likely outcome based on evaluation of data from computer models, satellite, radar, and other observations.
The "Range" map is the 25th percentile (lower number) to 75th percentile (higher number) of possible ice accumulation amounts based on the Weather Prediction Center (WPC) Super Ensemble output during the time period of the graphic. The official NWS ice accumulation forecast influences this range of values either up or down depending upon how closely they match. |
High End Amount 1 in 10 Chance (10%) of Higher Ice Accumulation What's this? |
| Low End Amount 9 in 10 Chance (90%) of Higher Ice Accumulation What's this? |
|
| Percent Chance That Ice Accumulations Will Be Greater Than...
Experimental - Leave feedback
What's this?
|
||||||||||||||||
|
||||||||||||||||
| Precipitation Onset/End Timing | ||
| Onset of Wintry Precipitation | End Timing of Wintry Precipitation | |
|---|---|---|
 |
 |
|
| What's this? | What's this? | |
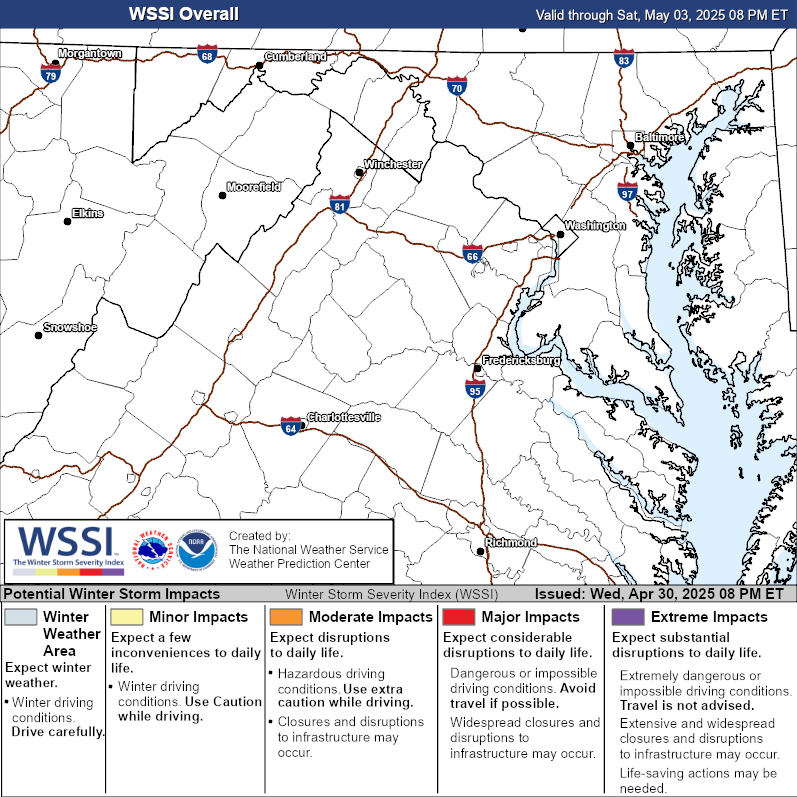
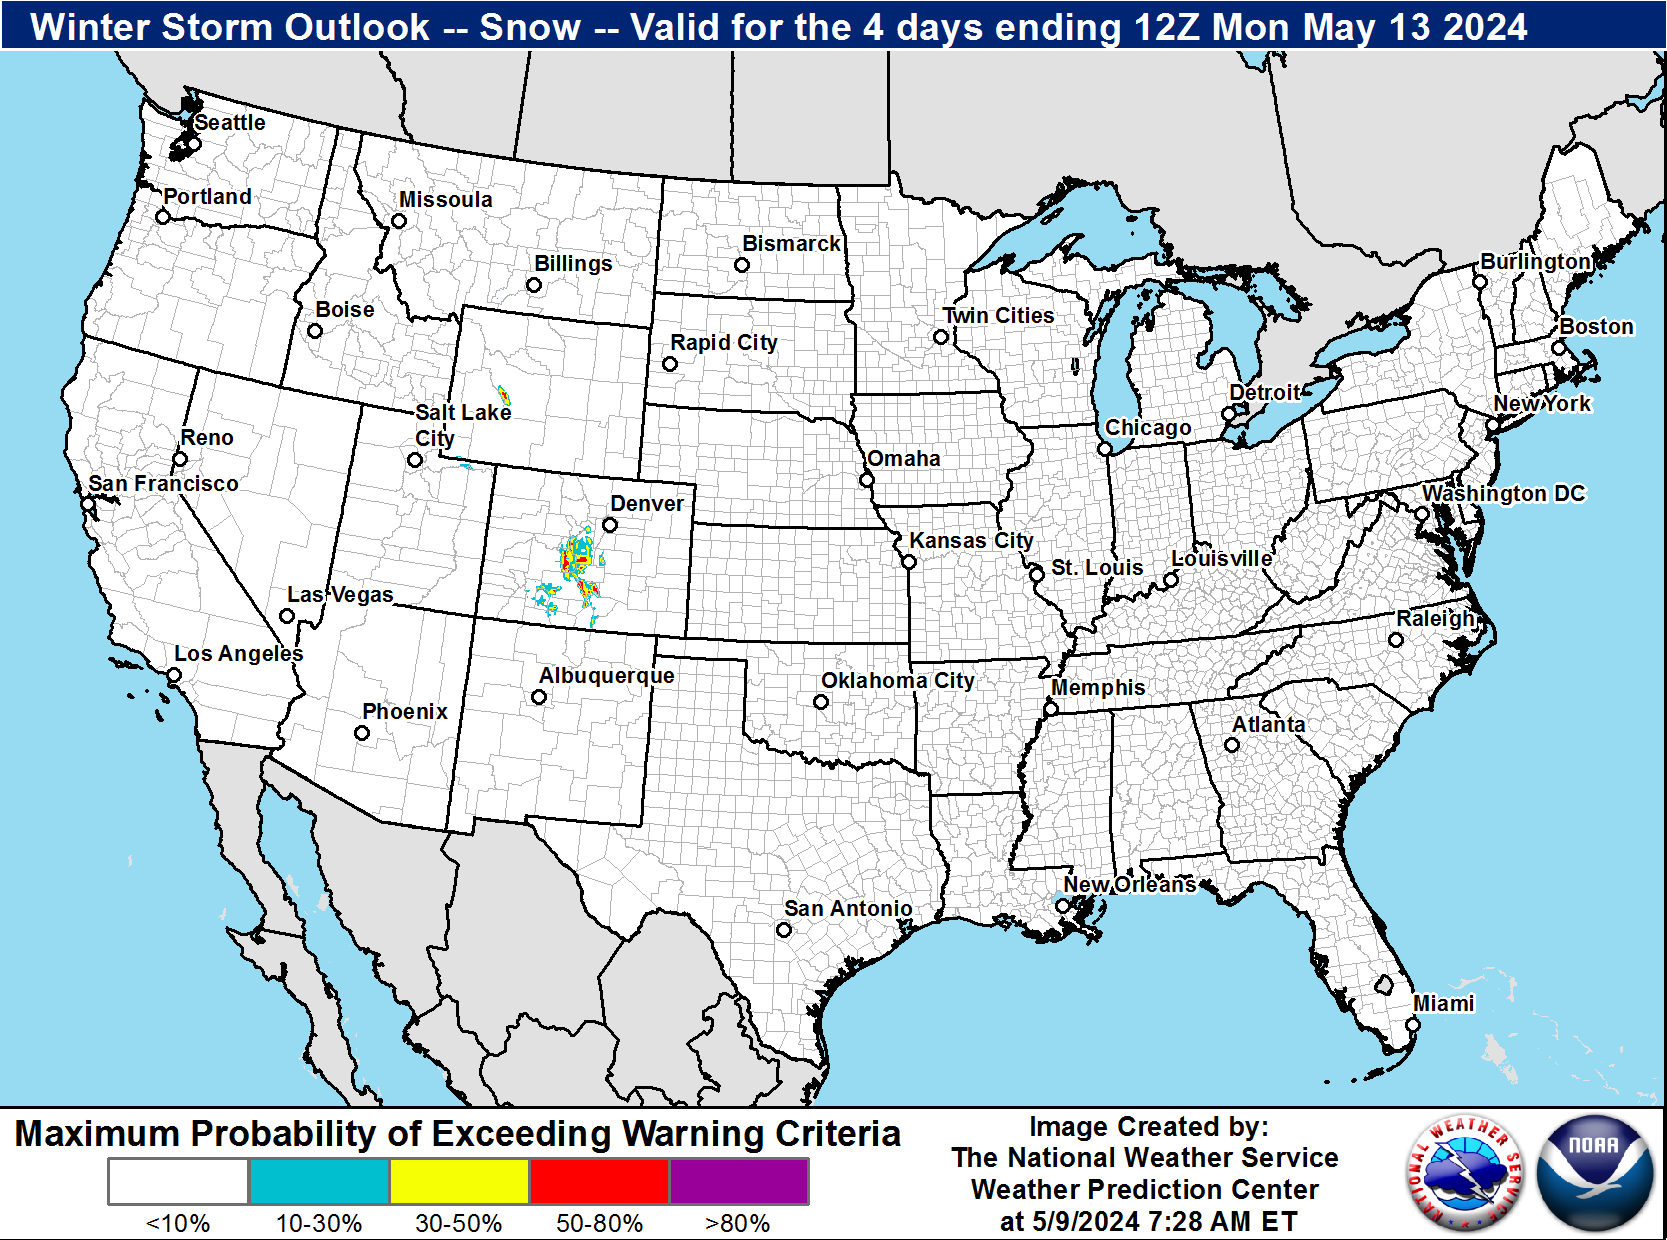
| Winter Storm Severity Index (WSSI) | Winter Storm Outlook (WSO) |
|---|---|
 |
 |
| Observed Snow/Ice Amounts | National Snowfall Analysis |
|---|---|
 |
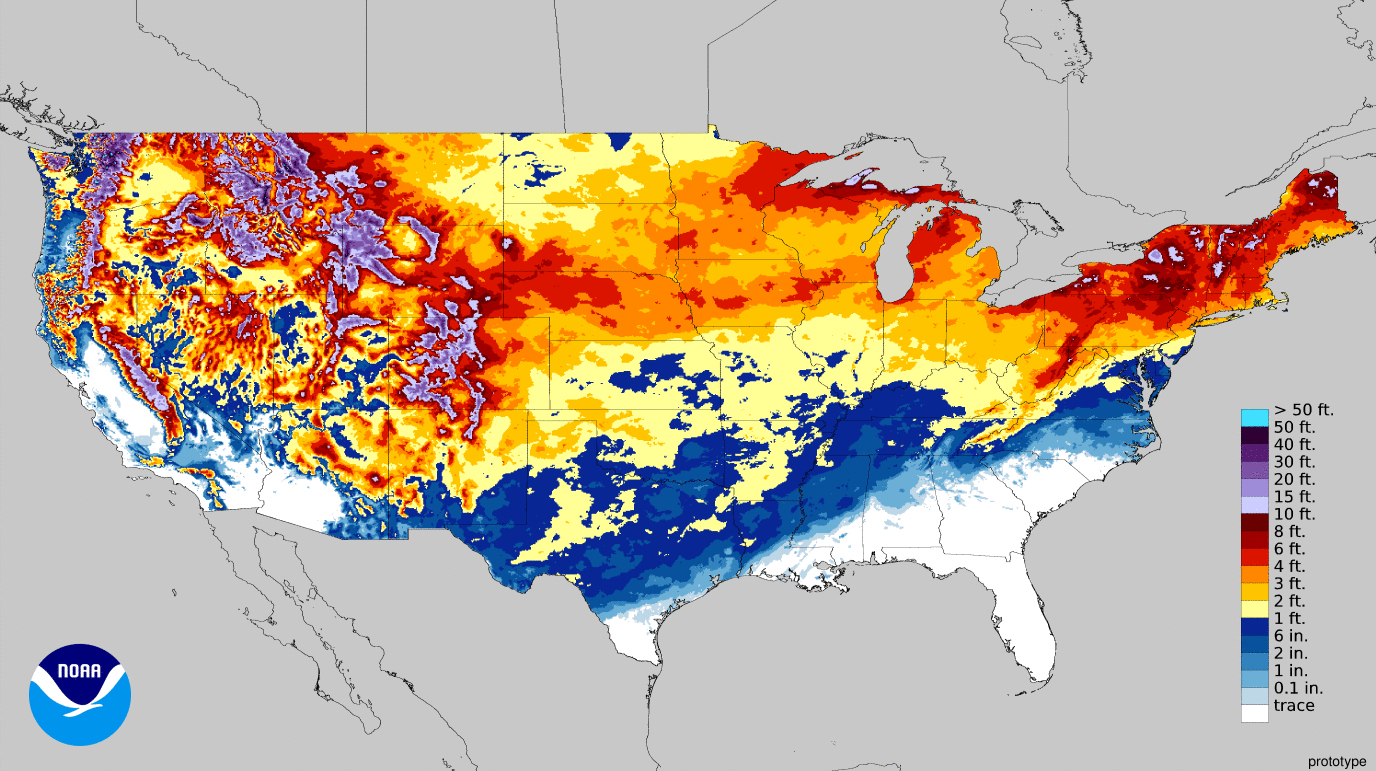 |
| Days 4-7 Winter Weather Outlook | |
| Day 4 Winter Weather Outlook | Day 5 Winter Weather Outlook |
 |
 |
| Day 6 Winter Weather Outlook | Day 7 Winter Weather Outlook |
 |
 |
|
|
|
| CPC Week-2 Experimental Heavy Snow Risk | |
 |
|
| CPC Temperature & Precipitation Maps | |
|
Days 6-10 |
|
| Temperature | Precipitation |
 |
 |
|
Days 8-14 |
|
| TEMPERATURE | PRECIPITATION |
 |
 |
|
Week 3-4 |
|
|
TEMPERATURE |
PRECIPITATION |
 |
 |
| Useful Winter Weather Information | ||
| Historic Mid-Atlantic Winter Storms |
Winter/Snowfall Statistics |
El Niño and DC/Baltimore Winters |
| Watches, Warnings, & Advisories |
How to Measure Snow |
La Niña and DC/Baltimore Winters |
|
|
||
| At Home | On the Road | Outside in the Cold |
 |
 |
 |
 |


 Coastal Flood
 FAQ
FAQ