
Gusty winds and very dry conditions will lead to a critical to extremely critical fire weather threat over portions of the Central and Southern Plains Thursday. Critical fire weather continues through Friday. Moderate to heavy mountain snow and strong winds will expand into the Northern Rockies Thursday, then into Colorado by Friday. Up to a foot of snow accumulation is possible. Read More >
Widespread flooding occurred throughout the mid-Atlantic during the spring of 2018, between the months of April and June. This was after an unseasonably dry autumn of 2017 and winter of 2017-2018. This webpage chronicles the various events which caused flooding, and provides historical perspective where appropriate.
The first flood event of the spring began in the overnight hours of April 15th into the early morning hours of the 16th, as low pressure moved east along what was a stalled boundary over the region.

Conditions leading up to this event had been mostly dry, with only light rain events due to an unseasonably chilly period. The amounts which occurred, ranging from 2-3 inches over a large portion of the area, would have caused much more flooding later in the season when antecedent conditions were wetter.

As it was, flooding was primarily confined to the DC metro area, and larger streams in the western portion of the region. Ultimately, the floodwaters moved downstream, affecting the more flood-prone areas of the Potomac River as well.
The table below lists the forecast points which flooded, and their observed crests. Crest values are preliminary until verified by gauge operators:
| Location | River | Flood Stage |
Peak Observed |
Date/Time of Peak |
Notes |
| Franklin, WV | South Branch Potomac | 7.0 | 9.10 | 4/16 9:05am | Highest since 2010 |
| Martinsburg, WV | Opequon Creek | 10.0 | 10.50 | 4/16 7:15pm | |
| Great Cacapon, WV | Cacapon River | 9.0 | 9.17 | 4/17 4:15am | |
| Springfield, WV | South Branch Potomac | 15.0 | 19.44 | 4/17 9:15am | Highest since 2007 |
| Shepherdstown, WV | Potomac River | 15.0 | 15.30 | 4/18 12:15am | |
| Edwards Ferry, MD | Potomac River | 15.0 | 15.13 | 4/18 9:45am |
The table below lists the non-forecast locations which flooded, and their observed crests. Crest values are preliminary until verified by gauge operators:
| Location | River | Flood Stage |
Peak Observed |
Date/Time of Peak |
Notes |
| Rockville, MD | Turkey Branch | 10.0 | 10.37 | 4/16 3:15am | |
| Alexandria, VA | Cameron Run | 9.5 | 9.67 | 4/16 3:35am | |
| Huntington, VA | Cameron Run | 6.5 | 7.06 | 4/16 4:00am | |
| Annandale, VA | Accotink Creek | 9.5 | 10.43 | 4/16 7:15am | |
| Washington, DC | Rock Creek | 7.0 | 7.92 | 4/16 10:45am | |
| Bristow, VA | Broad Run | 9.5 | 12.44 | 4/16 Noon |
The first of several significant flood events occurred on May 15th, 2018. A line of thunderstorms moved southward near an approaching cold front into Maryland. The line stalled across southeastern Washington and southern Frederick Counties. Torrential rain of 4 to 6 inches fell in a very short period of time, along with impressive baseball-sized hail.
A radar loop of the event can be viewed by clicking this link (warning: large file!).
The area was on the gradient of the highest precipitable water values, as indicated by the SPC Mesoanalysis Data:

The area was also in a region of strong moisture convergence:
Widespread flooding was reported in the city of Frederick, with numerous water rescues and flood damage to the YMCA building and other structures.
The heaviest rain was southwest of the city, where roads were washed out and some structures, especially in far southeastern Washington County, suffered flood damage. In one case, a small creek that usually barely flows turned into a raging river and inundated the lower level of one home, requiring a water rescue. With some rugged terrain in that area, some landslides also occurred.
The USGS streamgages on Little Catoctin Creek were right in the line of the heaviest rainfall, and one recorded a flood wave of at least ten feet in depth before being damaged, as shown in the observed graph below:
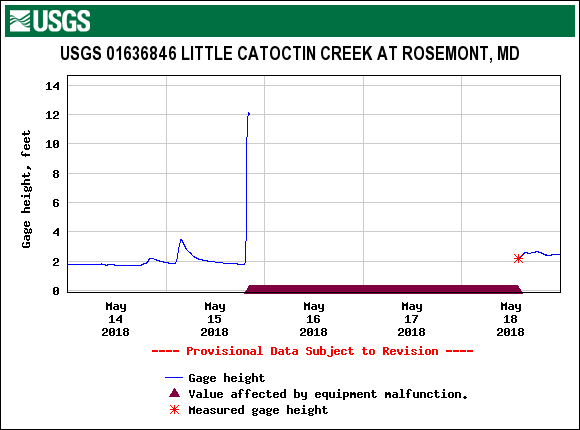
At this location, the gauge height rose from 2 feet to 11 feet in just 20 minutes. Floodwaters from the creek damaged Jefferson Pike (Maryland 180) in this area, closing the road for weeks. The same floodwave undermined a section of train tracks near Brunswick, temporarily stranding dozens of MARC passengers.
Although instability and moisture had decreased somewhat, the Frederick area remained in the vicinity of another stalled front during the next afternoon/evening (May 16th) and the scenario repeated itself, with another band of torrential rain (3-6 inches) that affected the same areas as the night before, plus portions of Jefferson County, West Virginia.
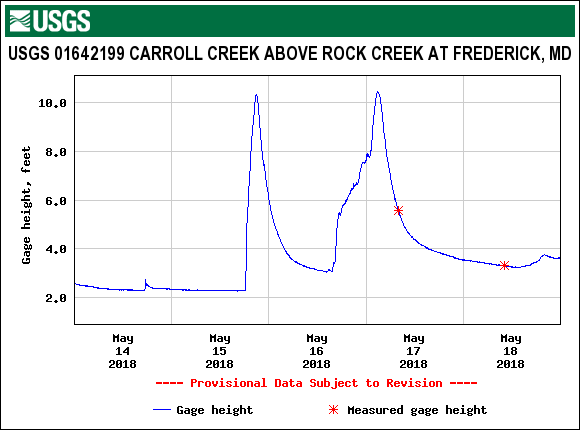
Local officials estimate between the two events, several million dollars in damage occurred just to public infrastructure. However, one success story was Frederick's Carroll Creek/Baker Park flood mitigation project, which kept water within the designed floodplain, and spared downtown Frederick from significant flooding, despite this graph of the stream from USGS upstream of downtown, which showed rises of around 8 feet above base flow levels with each event:
As the Frederick (and nearby area) flooding was occurring, much of the rest of the region was seeing several consecutive days of moderate rainfall. The cumulative effects of these events caused some smaller stream flooding initially, and then flooded larger rivers as the flow moved downstream. Some locations experienced multiple peaks in flood during this time due to the multiple rounds of rainfall.
To view rainfall from this time period, visit http://water.weather.gov/precip and select the archive data section under the map.
The table below lists the forecast points which flooded during this time, and their observed crests. Crest values are preliminary until verified by gauge operators:
| Location | River | Flood Stage |
Peak Observed |
Date/Time of Peak |
Notes |
| Martinsburg, WV | Opequon Creek | 10.0 | 14.36 | 5/17 7:00pm | Highest since 2014 2nd flood of 2018 |
| Great Cacapon, WV | Cacapon River | 10.0 | 12.73 | 5/18 6:45am | Highest since 2014 2nd flood of 2018 |
| Millville, WV | Shenandoah River | 10.0 | 10.63 | 5/19 5:30pm | |
| Great Cacapon, WV | Cacapon River | 10.0 | 11.58 | 5/19 8:15pm | Secondary peak 3rd flood of 2018 |
| Remington, VA | Rappahannock River | 15.0 | 16.44 | 5/19 9:30pm | |
| Martinsburg, WV | Opequon Creek | 10.0 | 12.49 | 5/20 1:30am | 3rd flood of 2018 |
| Shepherdstown, WV | Potomac River | 15.0 | 17.78 | 5/20 9:45am | 2nd flood of 2018 |
| Point of Rocks, MD | Potomac River | 16.0 | 17.39 | 5/20 Noon | Highest since 2014 |
| Edwards Ferry, MD | Potomac River | 15.0 | 17.87 | 5/20 1:15pm | 2nd flood of 2018 |
The table below lists the non-forecast locations which flooded, and their observed crests. Crest values are preliminary until verified by gauge operators:
| Location | River | Flood Stage |
Peak Observed |
Date/Time of Peak |
Notes |
| Waterford, VA | SF Catoctin Creek | 8.0 | 8.03 | 5/16 3:45am | |
| Berryville, VA | Opequon Creek | 10.0 | 11.54 | 5/17 9:30am | Highest since 2014 |
| Waterford, VA | SF Catoctin Creek | 8.0 | 8.49 | 5/17 Noon | 2nd flood of 2018 |
| Upper Marlboro, MD | Western Branch | 11.0 | 12.75 | 5/18 4:40pm | |
| Great Mills, MD | St. Mary's River | 6.0 | 8.33 | 5/18 6:30pm | Highest since 2012 |
| Locust Dale, VA | Robinson River | 11.0 | 12.64 | 5/19 7:45am | |
| Rixeyville, VA | Hazel River | 16.0 | 17.69 | 5/19 11:30am | |
| Bristow, VA | Broad Run | 9.5 | 10.46 | 5/19 12:45pm | 2nd flood of 2018 |
| Headsville, WV | Patterson Creek | 9.0 | 9.50 | 5/19 2:45pm | First flood since 2012 |
| Manassas Park, VA | Bull Run | 12.0 | 12.44 | 5/19 3:18pm | |
| Aden, VA | Cedar Run | 10.0 | 10.06 | 5/19 3:25pm | |
| Jones Springs, WV | Back Creek | 11.0 | 11.78 | 5/19 8:30pm | |
| Great Mills, MD | St. Mary's River | 6.0 | 7.90 | 5/19 9:45pm | 2nd flood of 2018 |
A classic wedge of cooler air left yet another stalled front stretching across the vicinity of the Blue Ridge Mountains during the overnight hours of May 21st into the 22nd.
Heavy rain up to four or five inches fell in a fairly short period of time, mainly in northwestern Rockingham County.
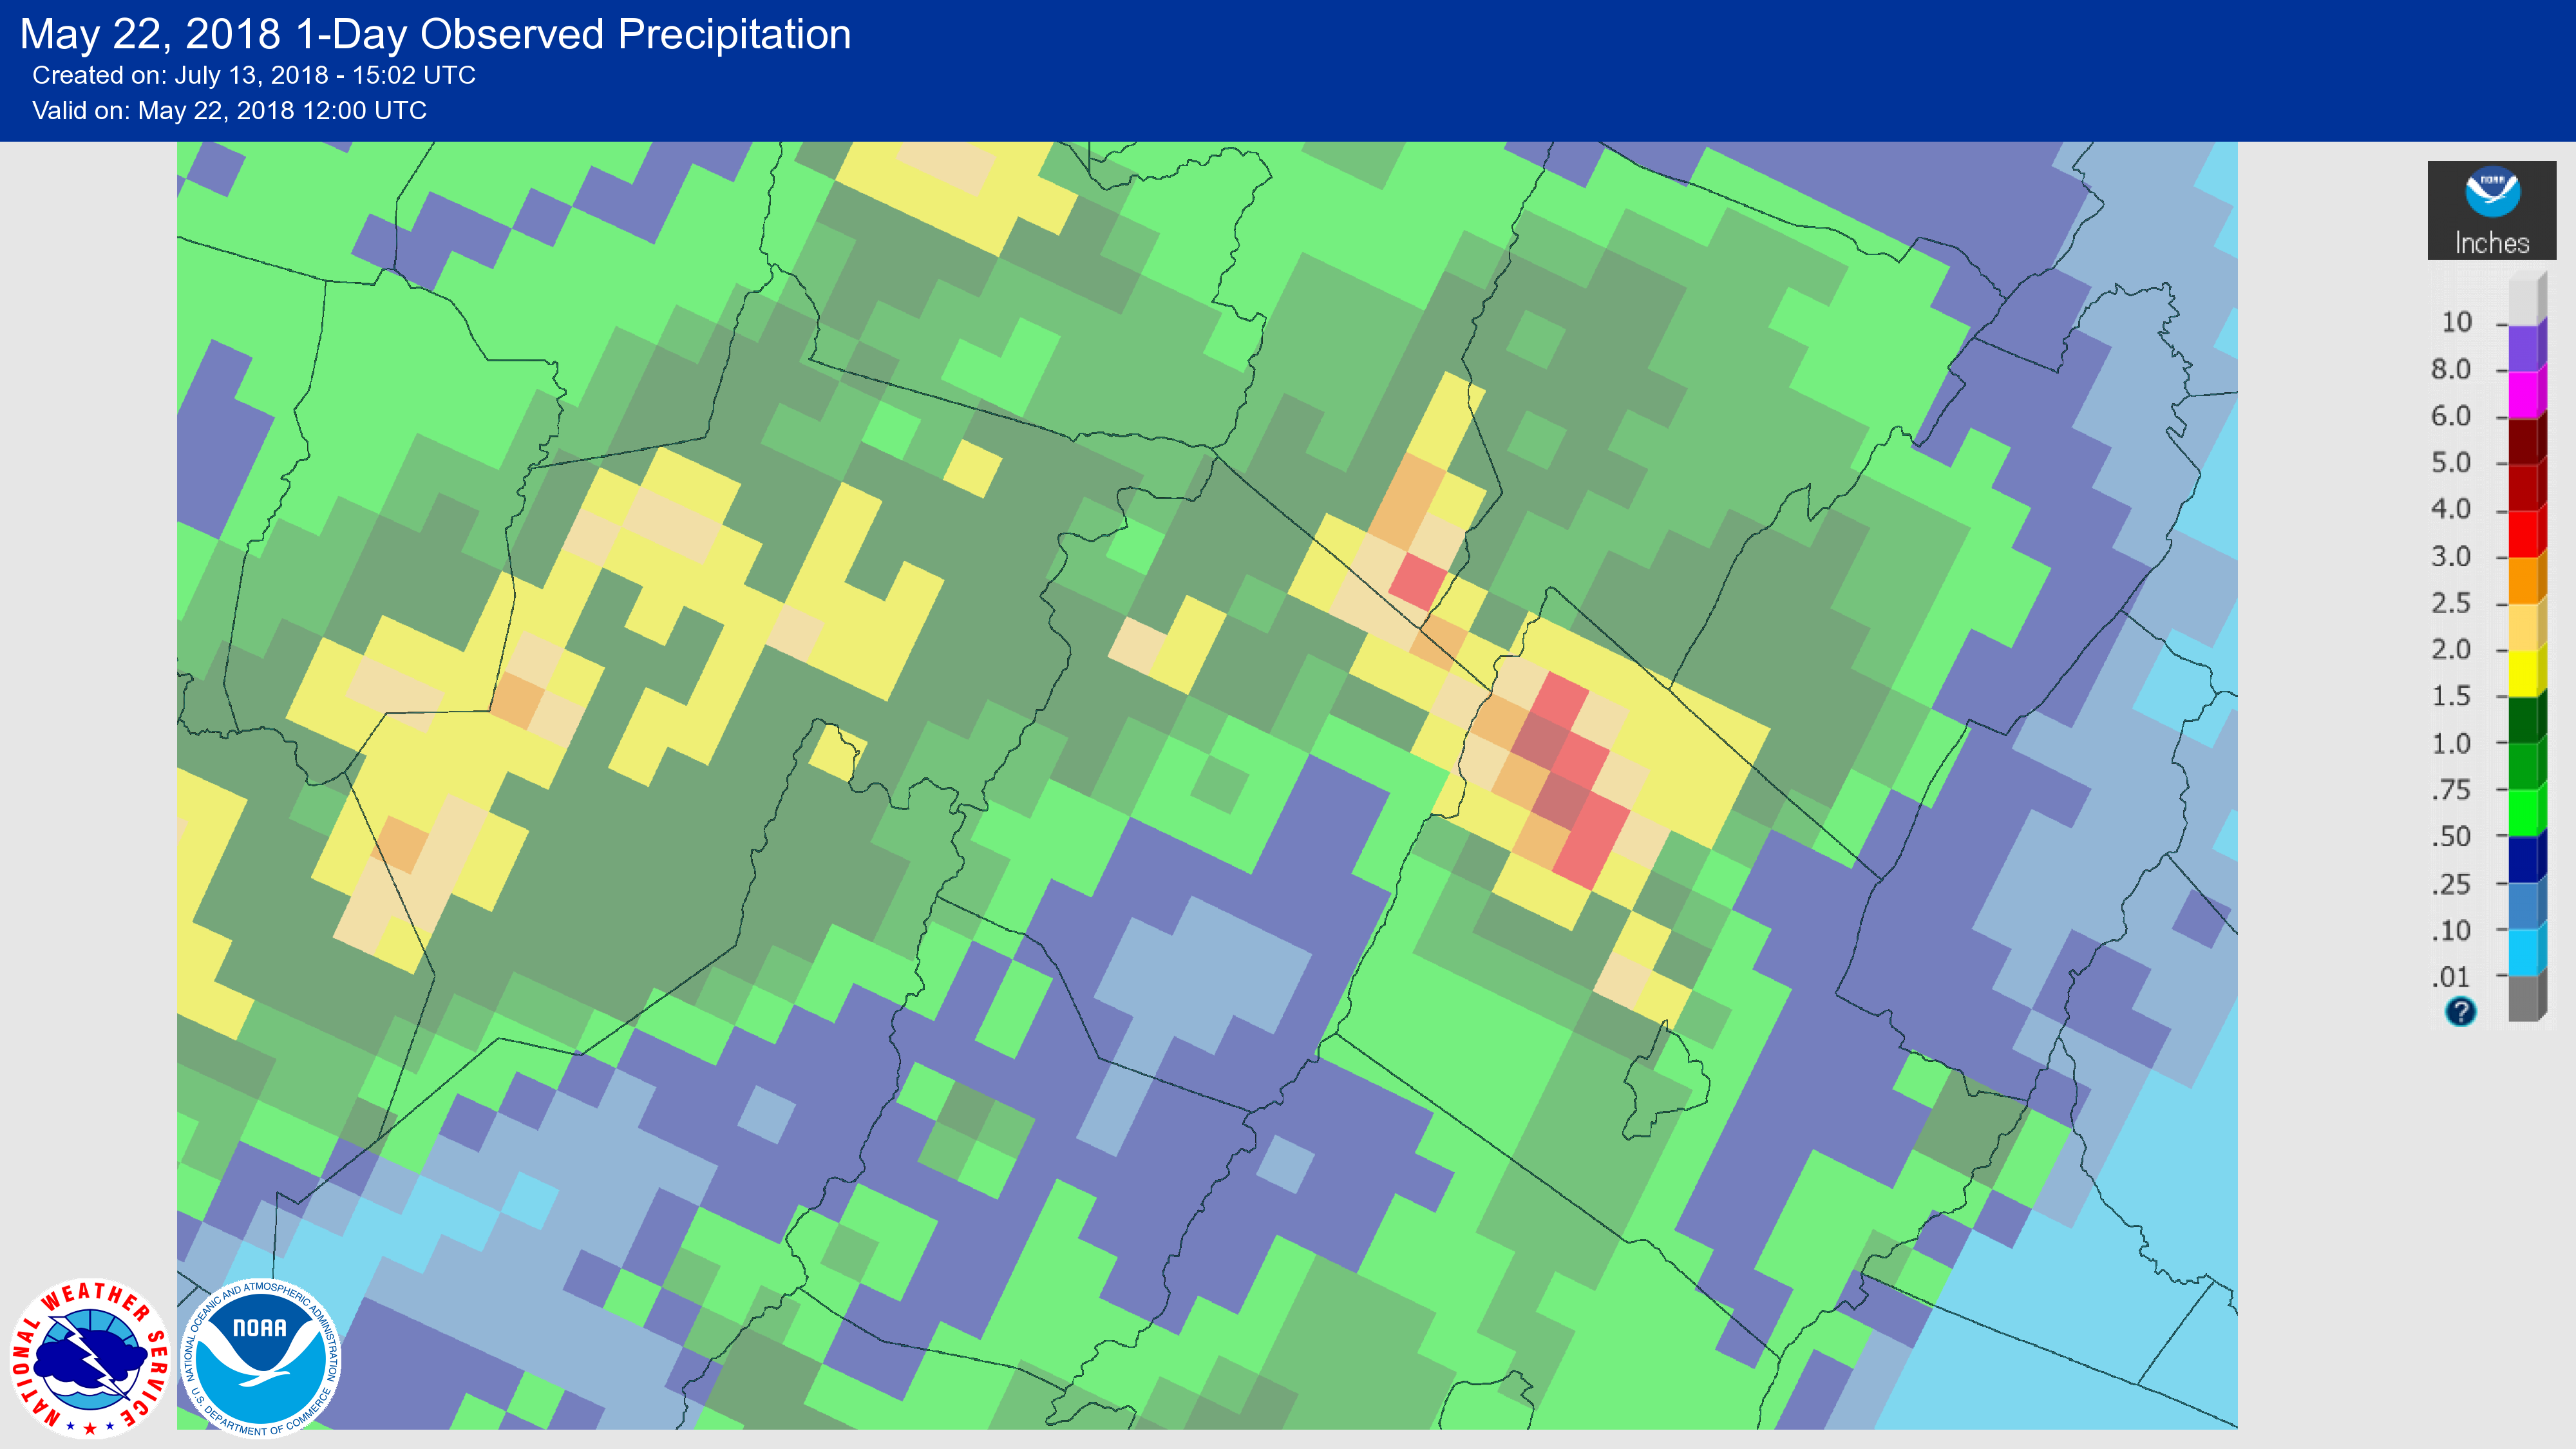
Significant flooding was reported in the Fulks Run and Yankeetown areas, with vehicles stranded in the floodwaters and damage reported to some homes.
That portion of northwestern Rockingham County forms the North Fork Shenandoah River, which saw a flood wave move downstream through the course of the day on the 22nd.
The table below lists the forecast points which flooded, and their observed crests. Crest values are preliminary until verified by gauge operators:
| Location | River | Flood Stage |
Peak Observed |
Date/Time of Peak |
Notes |
| Cootes Store, VA | North Fork Shenandoah | 15.0 | 17.00 | 5/22 2:15am | 1st flood since 2011 Highest since 1996 |
The table below lists the non-forecast locations which flooded, and their observed crests. Crest values are preliminary until verified by gauge operators:
| Location | River | Flood Stage |
Peak Observed |
Date/Time of Peak |
Notes |
| Mount Jackson, VA | North Fork Shenandoah | 13.0 | 14.67 | 5/22 10:00am | Highest since 2011 |
| Burnshire Dam, VA | North Fork Shenandoah | 13.0 | 14.20 | 5/22 4:44pm |
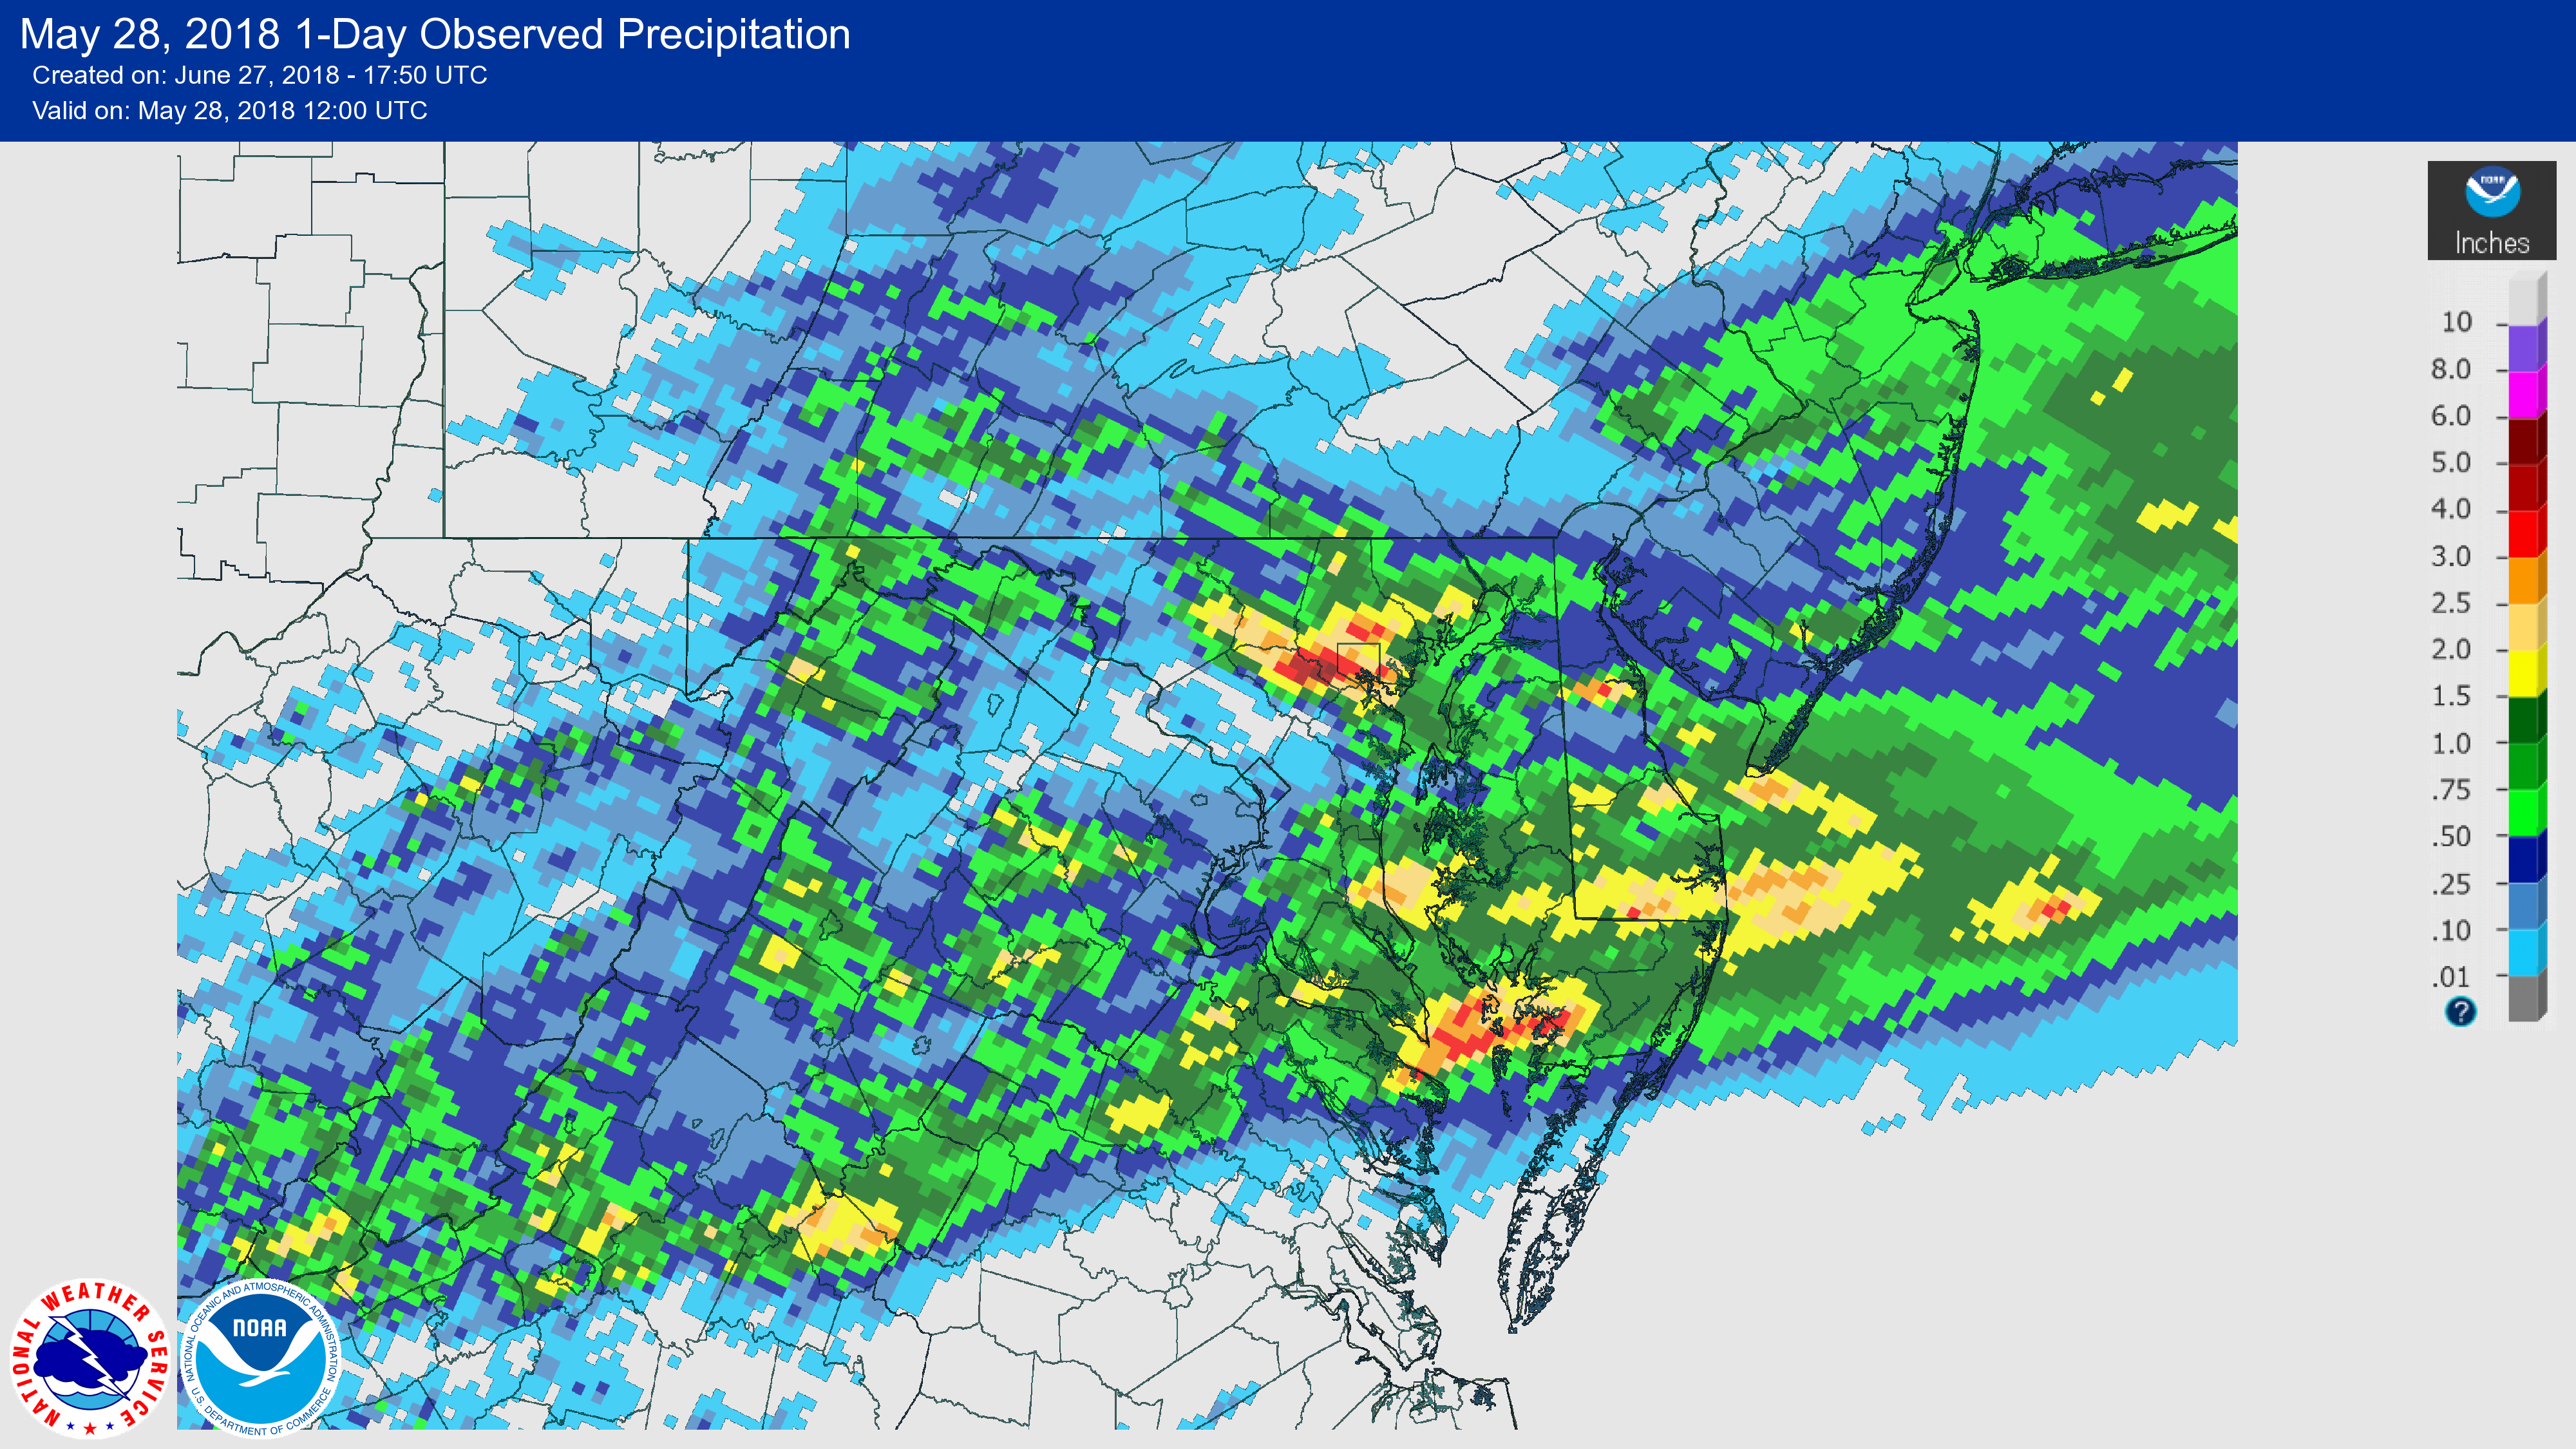
The NWS has already completed a thorough review of what happened on May 27th in the Ellicott City and southwestern Baltimore County/Baltimore City areas. To view that report, click here. As shown below, heavy rain also fell earlier in that same day in the eastern part of Baltimore County, near Perry Hall and White Marsh, causing flooding and water rescues in those areas. Somewhat heavy rain in Rockingham County, Virginia also sent small streams out of their banks.
The table below lists the non-forecast locations which flooded, and their observed crests. Crest values are preliminary until verified by gauge operators:
| Location | River | Flood Stage |
Peak Observed |
Date/Time of Peak |
Notes |
| White Marsh, MD | Whitemarsh Run | 11.0 | 13.42 | 5/27 3:45pm | |
| Ellicott City, MD | Hudson Branch | 258.0 | 258.98 | 5/27 4:30pm | first flood wave |
| Ellicott City, MD | Patapsco River | 122.5 | 123.31 | 5/27 5:00pm | first flood wave |
| Catonsville, MD | Patapsco River | 20.0 | 27.03 | 5/27 5:00pm | Similar to 2016 event |
| Ellicott City, MD | Hudson Branch | 258.0 | 261.06 | 5/27 5:55pm | second flood wave Similar to 2016 event |
| Mount Clinton, VA | Muddy Creek | 8.0 | 8.18 | 5/27 6:00pm | |
| Arbutus, MD | EB Herbert Run | 7.0 | 9.21 | 5/27 6:20pm | Similar to 2014 event |
| Ellicott City, MD | Patapsco River | 122.5 | 124.78 | 5/27 6:20pm | second flood wave |
| Baltimore, MD | Gwynns Falls | 13.0 | 17.09 | 5/27 6:31pm | Similar to 2016 event |
| Elkridge, MD | Patapsco River | 15.0 | 24.36 | 5/27 6:45pm | Similar to 2016 event |
| Columbia, MD | Little Patuxent River | 298.5 | 303.76 | 5/27 9:20pm | |
| Allview, MD | Little Patuxent River | 280.0 | 284.53 | 5/27 10:10pm | |
| Guilford, MD | Little Patuxent River | 11.0 | 15.22 | 5/27 11:15pm | 3rd highest on record |
| Savage, MD | Little Patuxent River | 10.0 | 16.52 | 5/28 12:30am | 7th highest on record |
As Tropical Depression Alberto moved northward through the Ohio Valley, a boundary set up across central and southern Virginia between cooler air to the north and the tropical warm air to the south and west, and remained stationary into and through the night.
Torrential rain fell north of this boundary, enhanced by easterly winds pushing up against the Blue Ridge Mountains. This led to widespread rainfall totals of 5-8 inches across western Madison and Greene Counties, and much of Albemarle County.
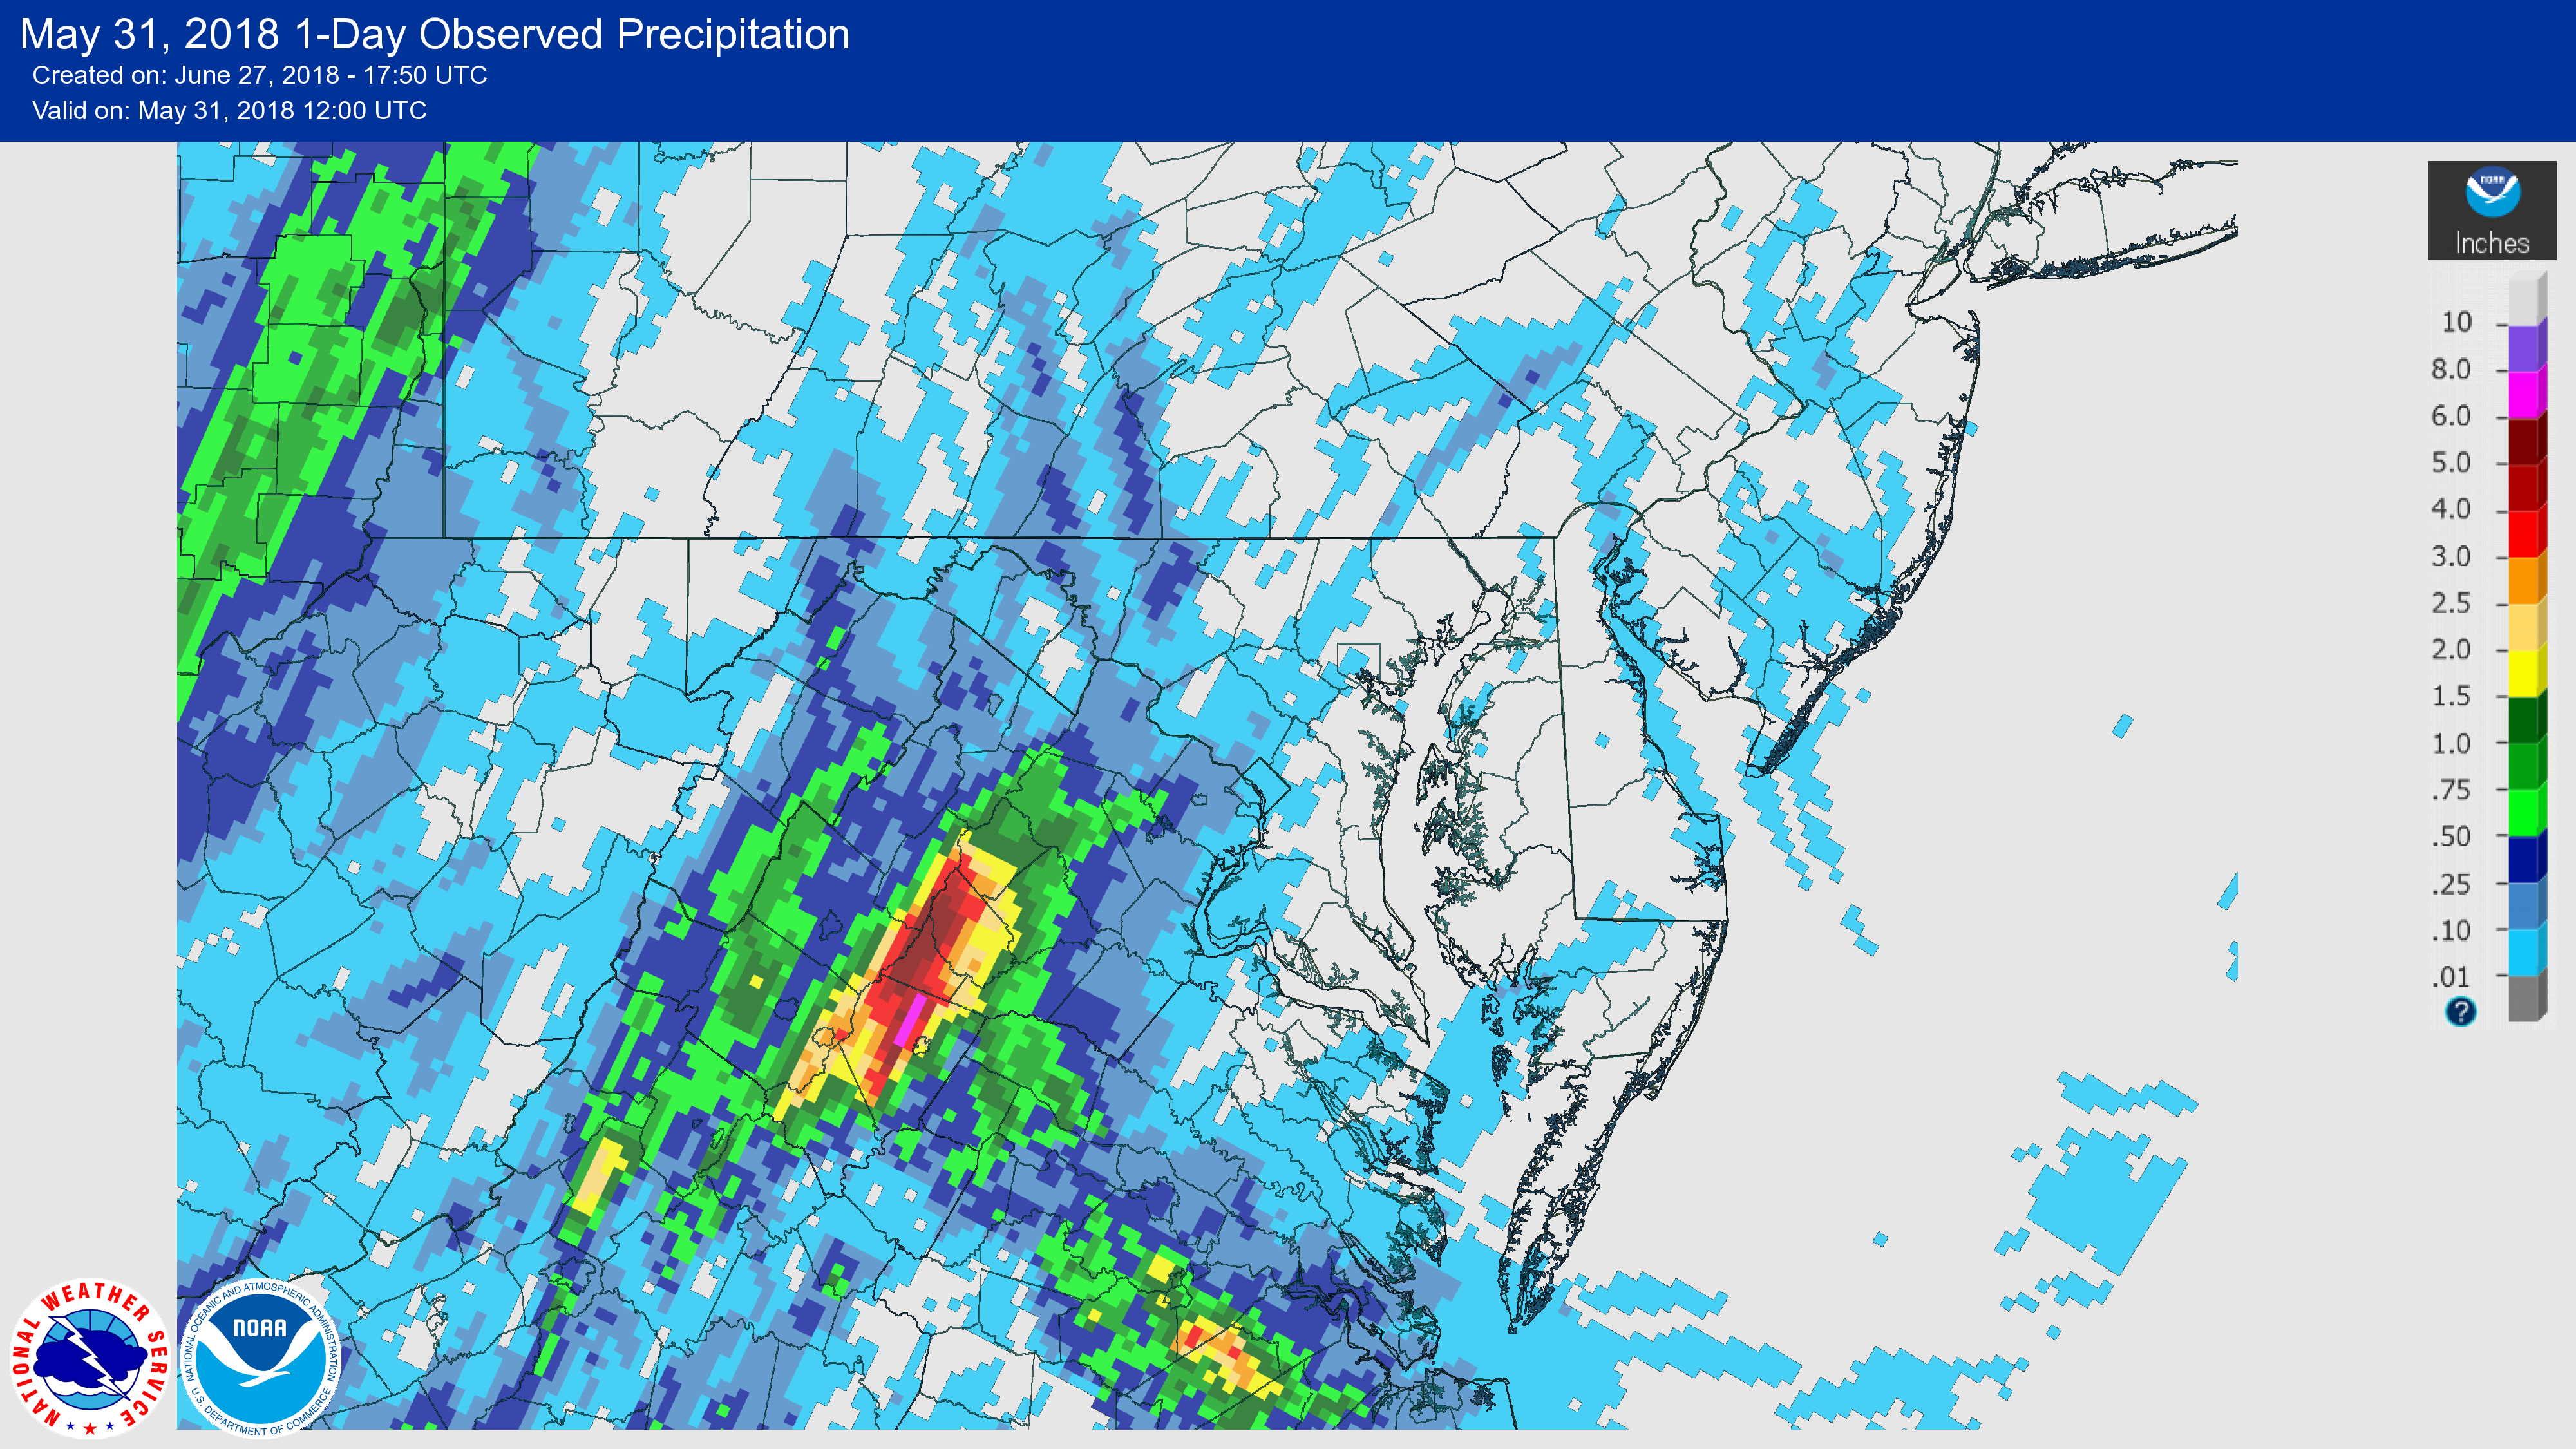
Dozens of roads were closed, with flooding of homes. At least a dozen water rescues occurred.
Tragically, three fatalities occurred during this flooding event. In Madison County, Virginia, two women who were camping at Graves Mountain attempted to cross a flooded stretch of water in an ATV. Tasha Hardy of Culpeper County was swept away and perished. Her companion was stranded on an island for several hours. In Albemarle County, two vehicles were swept into Ivy Creek. One vehicle's occupant was rescued, but the occupants of the other vehicle, Robert and Carol Gilges, were swept away and could not be rescued.
Heavy rain later in the day on the 31st produced 1.5-2.5 inches of rain in portions of Rockingham and Culpeper counties in Virginia, and Berkeley County, West Virginia, causing flooding, including of streams, in those areas as well.
The table below lists the forecast points which flooded during this time, and their observed crests. Crest values are preliminary until verified by gauge operators:
| Location | River | Flood Stage |
Peak Observed |
Date/Time of Peak |
Notes |
| Culpeper, VA | Rapidan River | 13.0 | 14.64 | 6/1 3:30am | Highest since 2014 |
The table below lists the non-forecast locations which flooded, and their observed crests. Crest values are preliminary until verified by gauge operators:
| Location | River | Flood Stage |
Peak Observed |
Date/Time of Peak |
Notes |
| Free Union, VA | Moormans River | 14.0 | 15.40 | 5/30 11:15pm | first flood wave Highest since 2011 |
| White Hall, VA | Mechums River | 11.0 | 17.42 | 5/30 11:30pm | Highest since 2004 |
| Earlysville, VA | NF Rivanna River | 14.0 | 21.89 (estimate) |
5/31 4:00am (estimate) |
Highest since 1996 (Gauge malfunctioned during storm. Value determined by survey after storm.) |
| Dooms, VA | South River | 11.0 | 11.62 | 5/31 4:00am | |
| Free Union, VA | Moormans River | 14.0 | 14.78 | 5/31 5:15am | second flood wave |
| Ruckersville, VA | Rapidan River | 14.0 | 15.24 | 5/31 8:15am | Highest since 1996 |
| Locust Dale, VA | Robinson River | 11.0 | 14.89 | 5/31 2:30pm | first flood wave 2nd flood of 2018 |
| Martinsburg, WV | Tuscarora Creek | 5.5 | 5.60 | 5/31 8:15pm | Highest since 2011 |
| Mount Clinton, VA | Muddy Creek | 8.0 | 8.10 | 5/31 8:30pm | 2nd flood of 2018 |
| Locust Dale, VA | Robinson River | 11.0 | 11.06 | 5/31 10:15pm | second flood wave 3rd flood of 2018 |
| Burketown, VA | North River | 11.0 | 11.04 | 6/1 1:15am |
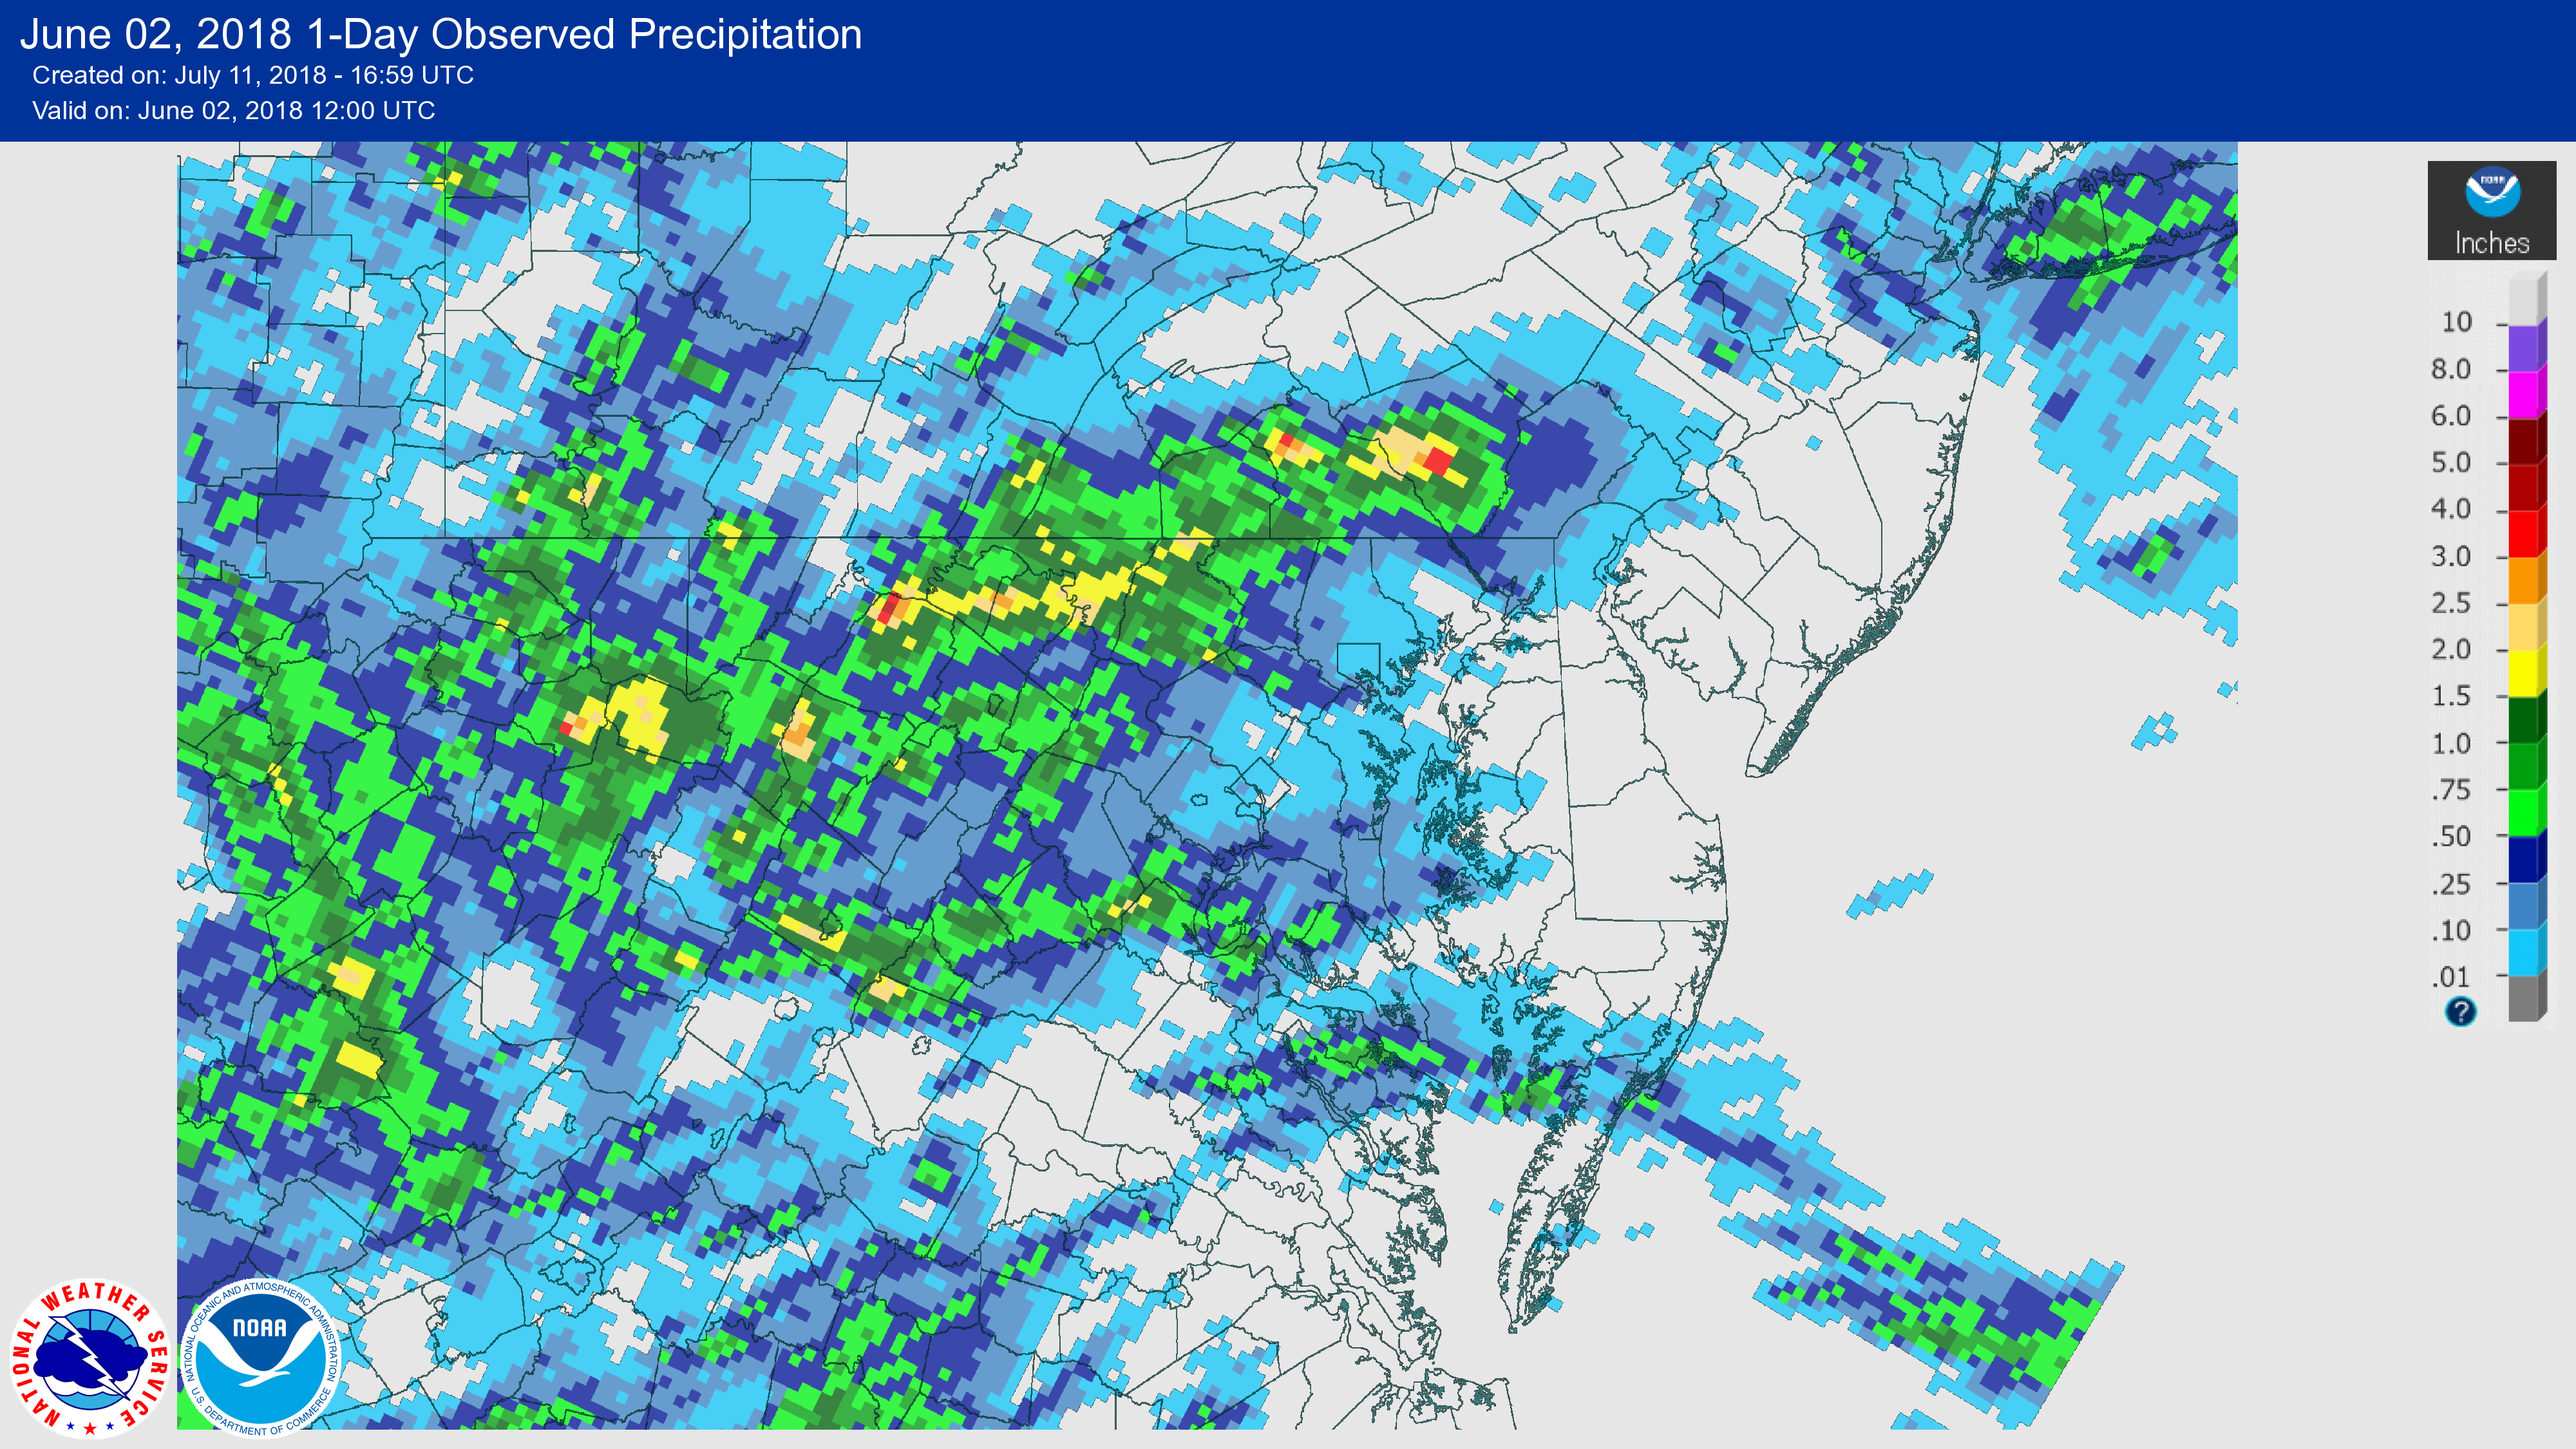
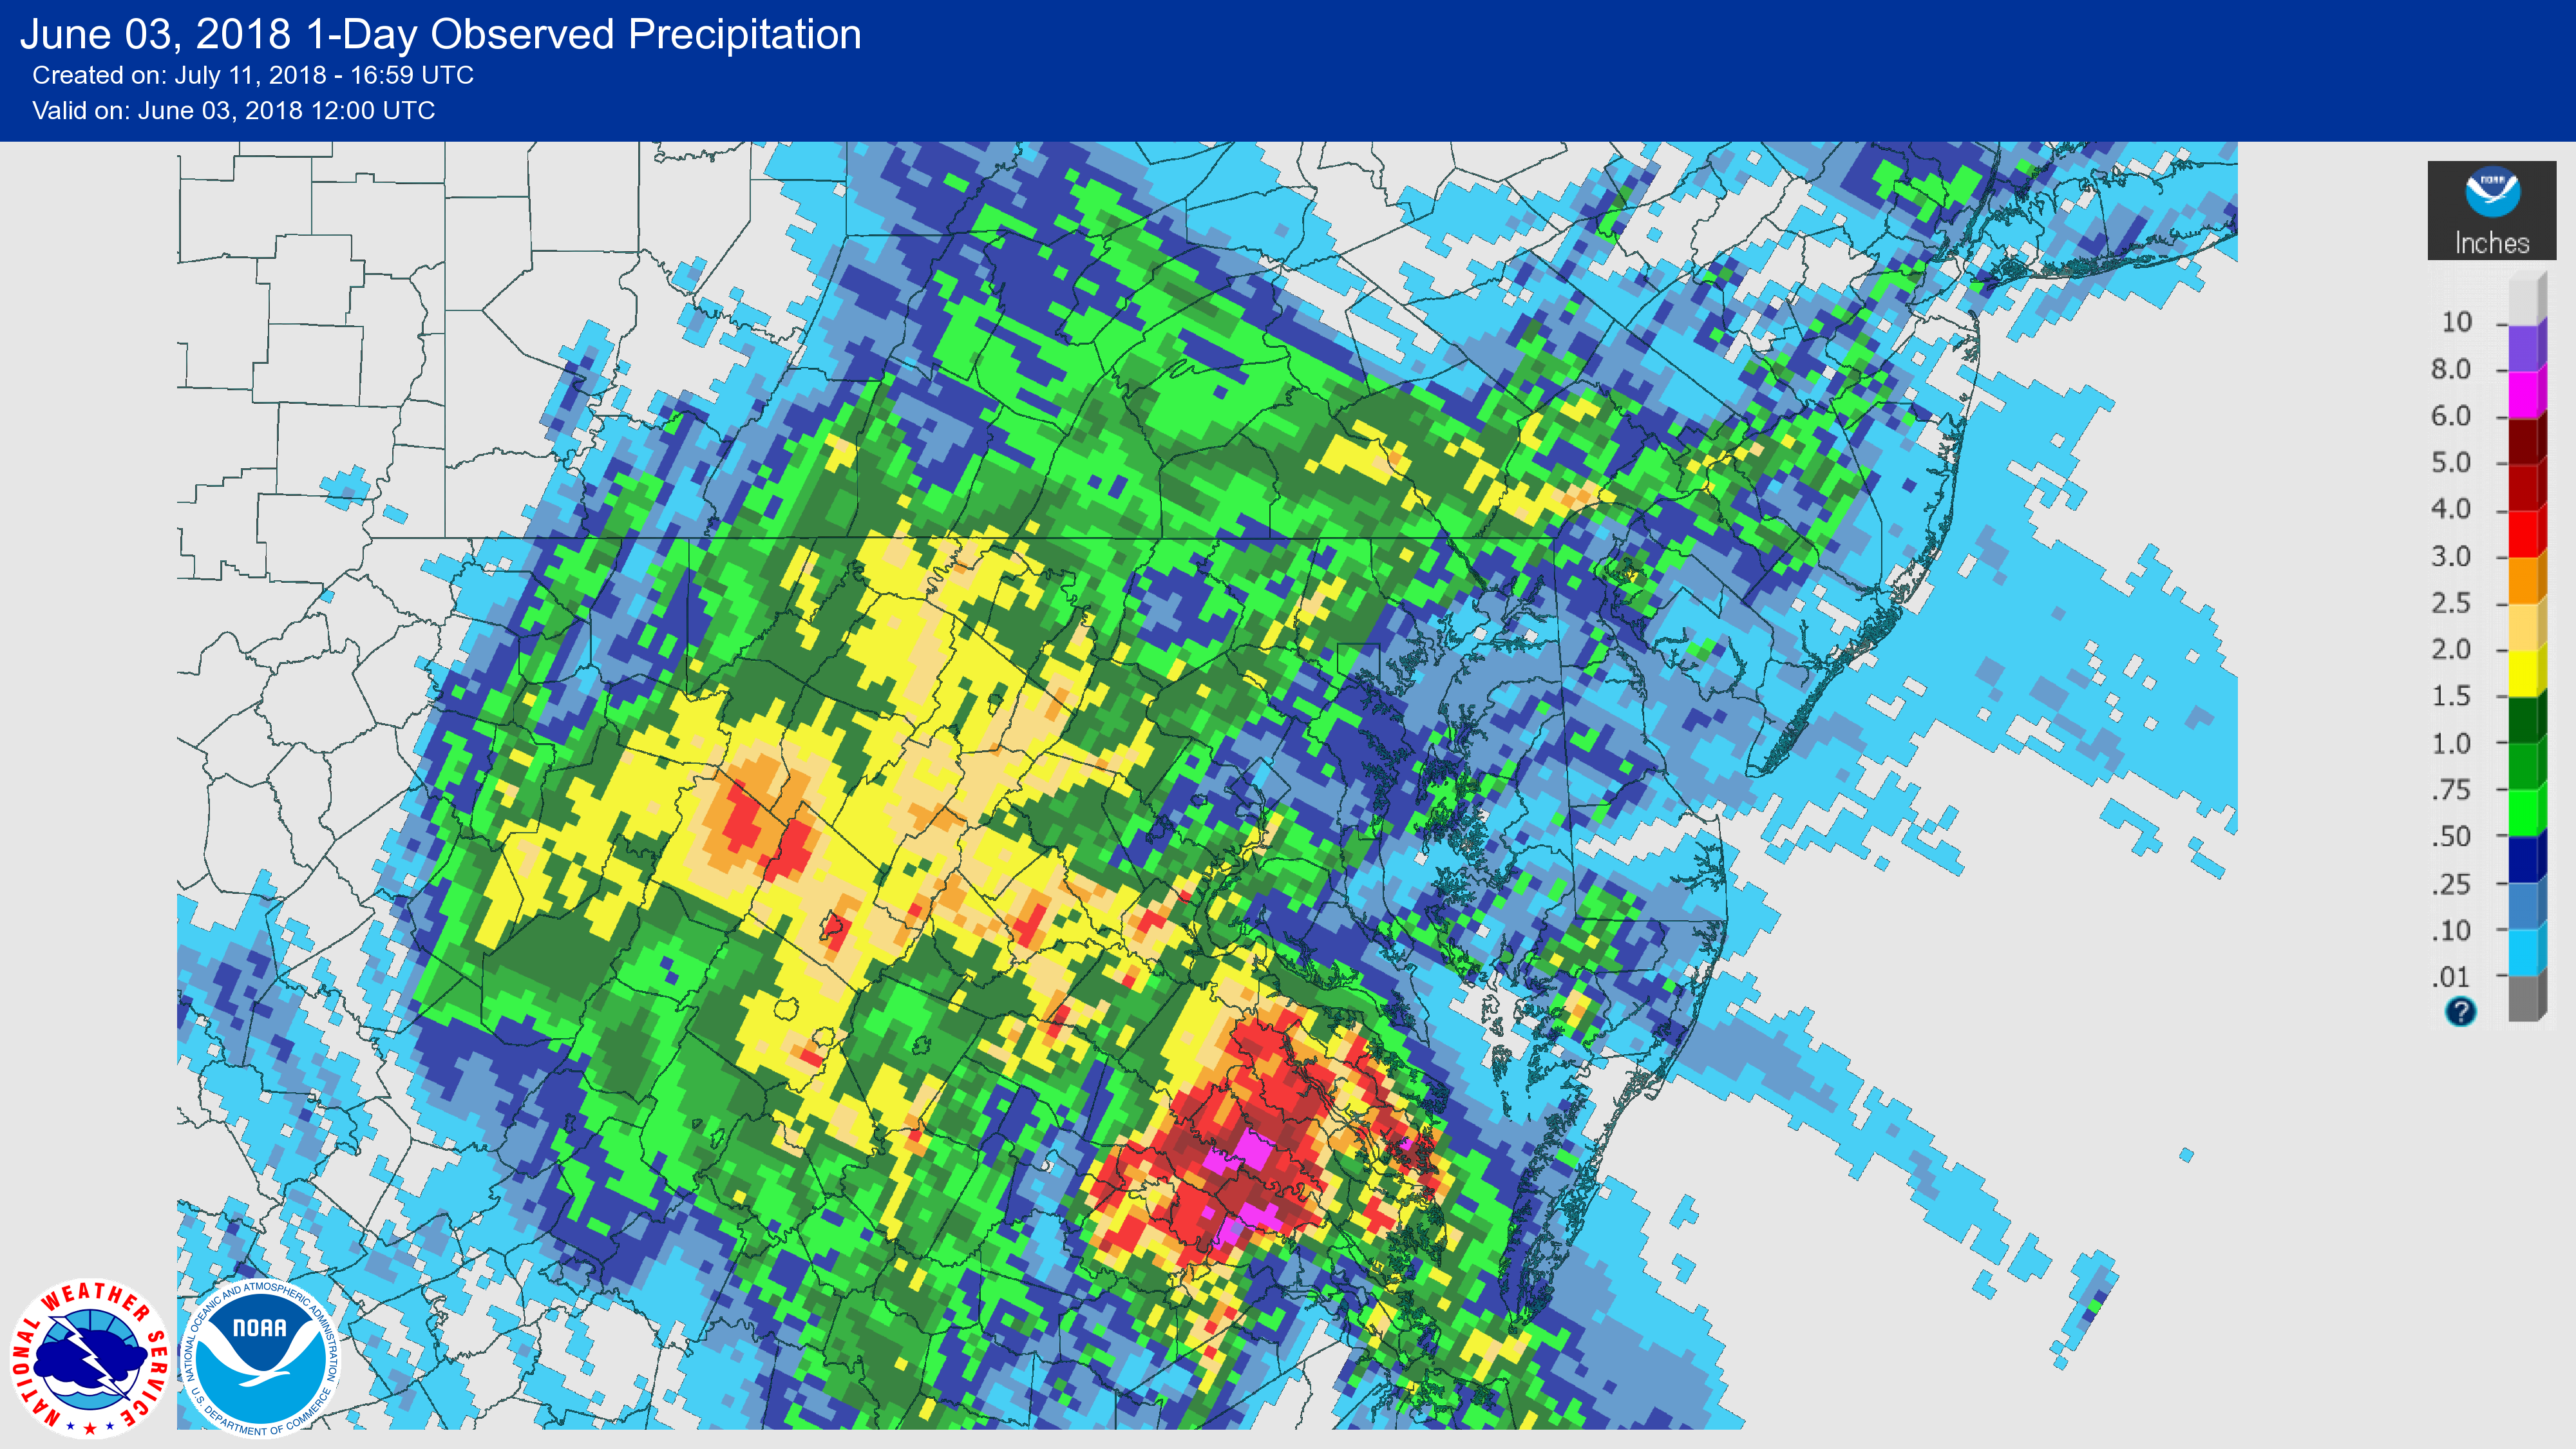
Over a multi-day period, a series of generally weak systems (and yet another stalled front for a portion of the time) moved through the mid-Atlantic. Heavy rains throughout the first three days of the month, combined with very wet soils from the relentless period of rain in late May, caused widespread, and in some areas, quite significant, flooding.
On the evening of the 1st, widespread flooding was reported in Washington and Frederick Counties in Maryland, and in Hampshire, Morgan, and Berkeley Counties in West Virginia. This included several rescues of people from cars. Some of that flooding continued into the 2nd, and by afternoon, new flooding was occurring throughout much of north central Virginia and the eastern West Virginia panhandle. Flooding remained significant into the 3rd, with larger rivers continuing to flood through the 4th.
The table below lists the forecast points which flooded during this time, and their observed crests. Crest values are preliminary until verified by gauge operators:
| Location | River | Flood Stage |
Peak Observed |
Date/Time of Peak |
Notes |
| Moorefield, WV | SF SB Potomac | 10.0 | 10.80 | 6/2 11:00pm | First flood since 2003 |
| Springfield, WV | SB Potomac River | 15.0 | 17.49 | 6/3 3:15pm | 2nd flood of 2018 |
| Paw Paw, WV | Potomac River | 25.0 | 25.24 | 6/3 5:15pm | First flood since 2011 |
| Luray, VA | SF Shenandoah River | 14.0 | 15.20 | 6/3 7:45pm | Highest since 2011 |
| Great Cacapon, WV | Cacapon River | 9.0 | 16.24 | 6/3 11:15pm | 4th flood of 2018 Highest since 2003 |
| Front Royal, VA | SF Shenandoah River | 12.0 | 16.52 | 6/3 11:30pm | Highest since 2003 |
| Culpeper, VA | Rapidan River | 13.0 | 14.46 | 6/4 3:00am | 2nd flood of 2018 |
| Strasburg, VA | NF Shenandoah River | 17.0 | 17.93 | 6/4 4:30am | First flood since 2011 |
| Martinsburg, WV | Opequon Creek | 10.0 | 13.95 | 6/4 7:30am | 4th flood of 2018 |
| Remington, VA | Rappahannock River | 15.0 | 18.32 | 6/4 9:30am | 2nd flood of 2018 |
| Williamsport, MD | Potomac River | 23.0 | 24.49 | 6/4 10:47am | Highest since 2010 |
| Millville, WV | Shenandoah River | 10.0 | 17.52 | 6/4 12:15pm | 2nd flood of 2018 Highest since 1996 Comparable to 2003 |
| Fredericksburg, VA | Rappahannock River | 13.0 | 17.00 (E) | 6/4 1:00pm | First flood since 2014 |
| Harpers Ferry, WV | Potomac River | 18.0 | 21.74 | 6/4 4:00pm | Highest since 1996 Comparable to 2010 |
| Shepherdstown, WV | Potomac River | 15.0 | 23.15 | 6/4 5:15pm | 3rd flood of 2018 Highest since 1996 |
| Point of Rocks, MD | Potomac River | 16.0 | 25.83 | 6/4 8:30pm | 2nd flood of 2018 Highest since 1996 Comparable to 2010 |
| Edwards Ferry, MD | Potomac River | 15.0 | 22.45 | 6/4 11:30pm | 3rd flood of 2018 |
| Little Falls, MD | Potomac River | 10.0 | 12.38 | 6/5 4:30am | First flood since 2014 Highest since 2010 |
The table below lists the non-forecast locations which flooded, and their observed crests. Crest values are preliminary until verified by gauge operators:
| Location | River | Flood Stage |
Peak Observed |
Date/Time of Peak |
Notes |
| Burketown, VA | North River | 11.0 | 14.60 | 6/2 9:30pm | 2nd flood of 2018 Highest since 2013 |
| Berkeley Springs, WV | Warm Springs Run | 5.0 | 5.83 | 6/3 11:30am | First flood since 2012 Comparable to 2012 |
| Hayfield, VA | Hogue Creek | 8.0 | 8.39 | 6/3 12:45pm | First flood since 2001 |
| Berryville, VA | Opequon Creek | 10.0 | 13.12 | 6/3 1:45pm | 2nd flood of 2018 |
| New Market, VA | Smith Creek | 8.0 | 11.55 | 6/3 2:00pm | Highest since 2003 |
| Mount Jackson, VA | NF Shenandoah River | 13.0 | 14.20 | 6/3 2:30pm | 2nd flood of 2018 Comparable to May |
| Takoma Park, MD | Sligo Creek | 5.5 | 5.75 | 6/3 3:20pm | |
| Winchester, VA | Cedar Creek | 16.0 | 16.32 | 6/3 4:00pm | First flood since 2014 |
| Bellegrove, MD | Sideling Hill Creek | 7.5 | 8.02 | 6/3 5:00pm | Highest since 2011 |
| Huntington, VA | Cameron Run | 6.5 | 6.50 | 6/3 5:00pm | 2nd flood of 2018 |
| Locust Dale, VA | Robinson River | 11.0 | 17.93 | 6/3 5:30pm | 4th flood of 2018 Highest since 2004 |
| Washington, DC | Rock Creek | 7.0 | 8.57 | 6/3 5:45pm | 2nd flood of 2018 |
| Riverdale, MD | NE Branch Anacostia | 8.0 | 10.20 | 6/3 5:50pm | Highest since 2006 |
| Rixeyville, VA | Hazel River | 16.0 | 19.78 | 6/3 7:30pm | 2nd flood of 2018 |
| Buckton, VA | Passage Creek | 9.0 | 12.00 | 6/3 7:45pm | |
| Ellicott City, MD | Patapsco River | 122.5 | 122.60 | 6/3 8:30pm | 3rd flood of 2018 |
| Catonsville, MD | Patapsco River | 20.0 | 22.17 | 6/3 8:30pm | 2nd flood of 2018 |
| Columbia, MD | Little Patuxent River | 298.5 | 298.63 | 6/3 9:00pm | 2nd flood of 2018 |
| Mitchellville, MD | Collington Branch | 9.0 | 9.20 | 6/3 9:35pm | |
| Elkridge, MD | Patapsco River | 15.0 | 18.01 | 6/3 10:00pm | 2nd flood of 2018 |
| Burnshire Dam, VA | NF Shenandoah River | 13.0 | 15.70 | 6/3 10:44pm | 2nd flood of 2018 |
| Guilford, MD | Little Patxuent River | 11.0 | 11.27 | 6/3 10:45pm | 2nd flood of 2018 |
| Savage, MD | Little Patuxent River | 10.0 | 15.06 | 6/3 11:00pm | 2nd flood of 2018 |
| Allview, MD | Little Patuxent River | 280.0 | 280.39 | 6/3 11:10pm | 2nd flood of 2018 |
| Upper Marlboro, MD | Western Branch | 11.0 | 15.18 | 6/4 4:00am | 2nd flood of 2018 Highest since 2012 |
| Jones Springs, WV | Back Creek | 11.0 | 19.14 | 6/4 6:30am | 2nd flood of 2018 Highest since 1996 Comparable to 1996 |
On June 21-22, it happened yet again. A front was stalled across Central Virginia with deep easterly flow to the north of it. This (as also occurred at the end of May) caused significant precipitation in Madison and Greene Counties, as well as surrounding areas, particularly those with upslope to mountains.
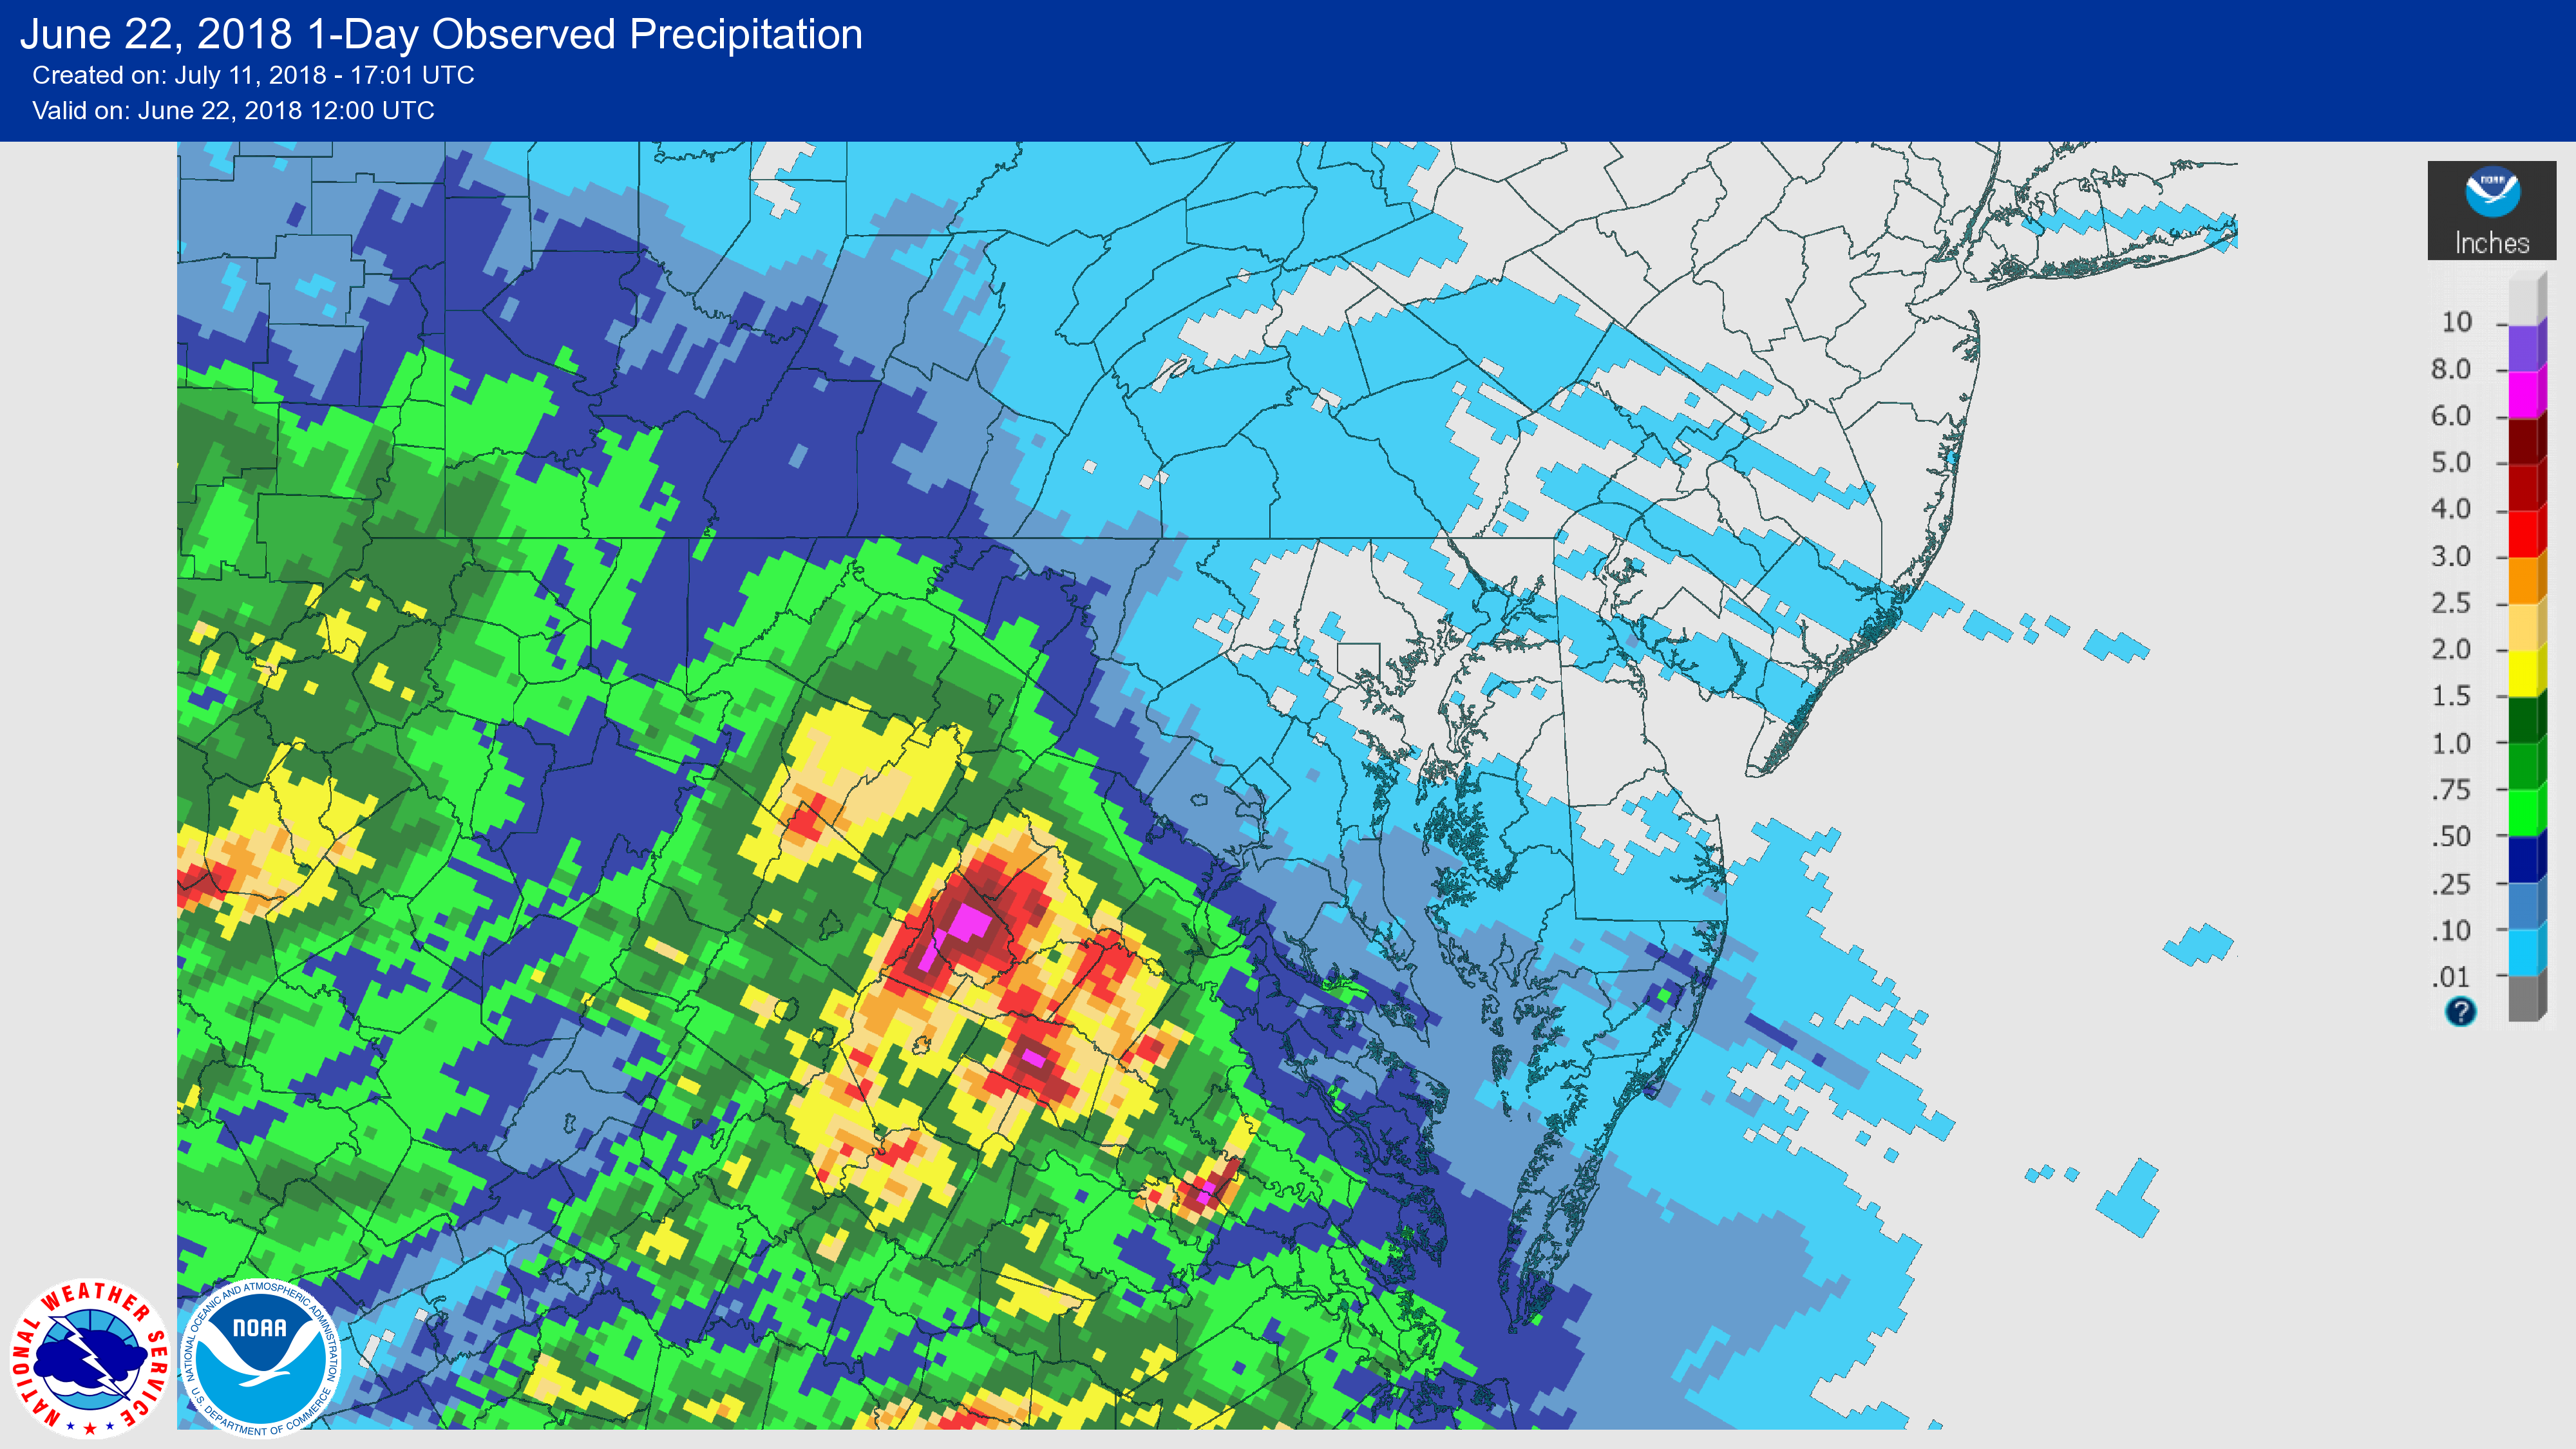
Moderate rain persisted into the next day, as the front moved northward as a warm front.
Widespread flooding occurred in the Rappahannock and Shenandoah basins, with some minor flooding at the susceptible area of the Potomac near Edwards Ferry.
The table below lists the forecast points which flooded during this time, and their observed crests. Crest values are preliminary until verified by gauge operators:
| Location | River | Flood Stage |
Peak Observed |
Date/Time of Peak |
Notes |
| Cootes Store, VA | NF Shenandoah River | 15.0 | 15.42 | 6/22 9:15am | 2nd flood of 2018 |
| Remington, VA | Rappahannock River | 15.0 | 23.10 (estimate) |
6/22 9:00pm | 2nd flood of 2018 Highest since 1996 Comparable to 1996 |
| Culpeper, VA | Rapidan River | 13.0 | 23.70 | 6/22 11:15pm | 3rd flood of 2018 Highest since 1996 |
| Great Cacapon, WV | Cacapon River | 9.0 | 11.38 | 6/23 2:15am | 5th flood of 2018 |
| Strasburg, VA | NF Shenandoah River | 17.0 | 17.57 | 6/23 9:00am | 2nd flood of 2018 |
| above Fredericksburg, VA | Rappahannock River | 13.0 | 17.55 | 6/23 3:15pm | First flood since 2014 Highest since 1996 Comparable to 1996 |
| Martinsburg, WV | Opequon Creek | 10.0 | 12.93 | 6/23 9:00pm | 5th flood of 2018 |
| Fredericksburg, VA | Rappahannock River | 13.0 | 25.20 | 6/23 9:30pm | 2nd flood of 2018 Highest since 1996 |
| Millville, WV | Shenandoah River | 10.0 | 12.62 | 6/23 10:30pm | 3rd flood of 2018 |
| Edwards Ferry, MD | Potomac River | 15.0 | 15.20 | 6/24 8:15am | 4th flood of 2018 |
The table below lists the non-forecast locations which flooded, and their observed crests. Crest values are preliminary until verified by gauge operators:
| Location | River | Flood Stage |
Peak Observed |
Date/Time of Peak |
Notes |
| White Hall, VA | Mechums River | 11.0 | 13.25 | 6/22 9:00am | 2nd flood of 2018 |
| Ruckersville, VA | Rapidan River | 14.0 | 16.93 | 6/22 9:15am | 2nd flood of 2018 Higher than May 31 Highest since 1996 |
| Laurel Mills, VA | Battle Run | 11.0 | 12.43 | 6/22 11:30am | Highest since 1996 |
| Earlysville, VA | NF Rivanna River | 14.0 | 15.55 (estimate) |
6/22 11:45am (estimate) |
2nd flood of 2018 |
| New Market, VA | Smith Creek | 8.0 | 8.03 | 6/22 12:45pm | 2nd flood of 2018 |
| Locust Dale, VA | Robinson River | 11.0 | 21.34 | 6/22 3:00pm | 5th flood of 2018 (also 5th in 35 days) Highest since 1996 |
| Mount Jackson, VA | NF Shenandoah River | 13.0 | 14.54 | 6/22 4:00pm | 3rd flood of 2018 Comparable to other two events this year |
| Rixeyville, VA | Hazel River | 16.0 | 26.20 (estimate) |
6/22 4:15pm | 3rd flood of 2018 (Gauge did not operate during the 1995/1996 seasons so cannot compare) |
| Berryville, VA | Opequon Creek | 10.0 | 10.23 | 6/23 7:30am | 3rd flood of 2018 |
| Bristow, VA | Broad Run | 9.5 | 10.17 | 6/24 6:02am | 3rd flood of 2018 |


 Coastal Flood
 FAQ
FAQ