Overview
For the second time in just 22 months, torrential rain fell in the Ellicott City and Catonsville areas of Howard and Baltimore Counties. The heavy rainfall, between 6 and 12 inches in the heaviest band, caused catastrophic damage, especially in Historic Ellicott City. One person -- 39-year old Eddison Hermond, died while trying to help a woman who was seeking assistance after the first flood wave. Many buildings were damaged and dozens of vehicles experienced flood damage. Hundreds of people were addressed by first responders during the event, with around 1100 separate 911 calls reported in to Howard County. Some roads were washed out and land erosion and localized landslides were reported.
Timeline
The National Weather Service (NWS) began highlighting the potential for flooding in the Hazardous Weather Outlook (link) beginning on Friday morning, May 25th:
Thunderstorms capable of producing locally heavy rain may lead to isolated incidents of
flooding on Saturday and Sunday.
On Sunday morning, May 27th, a Flash Flood Watch was issued for the Baltimore/Washington corridor, highlighting the potential for showers and thunderstorms capable of producing heavy rain during the afternoon and evening.

Social Media slide showing the Flash Flood Watch.
Just as the rain began, a Flood Warning was issued at 3:19pm for portions of Howard County, Baltimore County, and Baltimore City, including Ellicott City, Catonsville, Dundalk, and Baltimore City, all of which experienced significant flooding during this event. This initial rain pushed south of Ellicott City after causing an estimated 1.5 to 2 inches of rain, but by 4:00pm, had built back over both Ellicott City and Catonsville. At 4:00pm, video footage showed a small amount of flowing water near the curbs on Main Street in Ellicott City, with rain increasing in intensity. Video shows Main Street was still passable until around 4:20pm.
Between 4:00pm and 4:30pm, the heavy rain persisted, quickly dropping an estimated two inches of rain in a band just south of Ellicott City to near Catonsville. This heavy rain caused a major rise in the New Cut Branch (click here for an annotated map of the watershed), and the added water pushed the Tiber River out of its banks at 4:18pm near Tiber Alley. Two minutes later, at 4:20pm, the water level in the Tiber further increased, exceeding the capacity of the channel in the 8100 block of Main Street and near Tiber Alley, sending water both into nearby structures and down the Alley onto Main Street.
As initial reports of this more significant water came in to the National Weather Service, the Flood Warning was upgraded to a Flash Flood Warning, at 4:26pm. Remarkably, conditions continued to worsen throughout the Ellicott City area between 4:30pm and 5:00pm as the rain shifted just south of the city, with overland flooding occurring in West End as well as even more significant water coming down the Tiber and through both Tiber Alley and the buildings on the south side of Main Street. The highest water -- up to the top of the first floor of buildings -- was observed between 4:40pm and 5:00pm, then water levels began to recede somewhat.
At the time of this highest water (4:40pm), a Flash Flood Emergency was declared by the National Weather Service, in coordination with Howard County Emergency Management, due to the ongoing catastrophic flooding, and the heaviest rain was still falling at that point. Total rainfall estimates reached six inches by 5:15pm just south of Old Town Ellicott City, and in the Oella and Catonsville areas.
A second round of heavy rain pushed across Ellicott City between 5:00pm and 6:00pm, with the heaviest rain occurring between 5:20pm and 5:50pm. This second round was of nearly equal intensity to the first, and had equal or greater impacts. This second round of heavy rain prompted even stronger statements in the Flash Flood Emergency:
HEAVY RAIN HAS MOVED BACK INTO THIS AREA. THOSE CURRENTLY RESPONDING TO EARLIER FLASH FLOODING
MUST SEEK HIGHER GROUND IMMEDIATELY AS A NEW ROUND OF FLOODING IS IMMINENT! THIS NEW FLOODING
COULD BE MORE SIGNIFICANT THAN THE INITIAL ROUND! YOU MUST GO TO THE HIGHEST POSSIBLE LOCATION
IMMEDIATELY AND STAY AWAY FROM ANYWHERE WHERE THERE IS WATER OR COULD BE WATER!!!
On the Hudson Branch, water levels were higher than the first round by 5:35pm, going over a deck near Court Street by 5:40pm. Water levels on the Hudson Branch peaked at 5:53pm at a level almost equal to the 2016 flood. Downstream at Tiber Alley, the relative lull ended around 5:40pm as well, with floodwaters rising back up to the top of the first floor of buildings for about half an hour, until 6:10pm.
The second round of rainfall shifted south by 6:00pm, but another round of heavy rain, which caused flash flooding in the Sykesville area, was moving toward the affected region. Luckily, it weakened as it approached Ellicott City, sparing the area from a third flood wave. Therefore, all the small streams in the Tiber-Hudson basin were back within their banks by around 6:45pm.
Radar
This radar loop of the full event (Warning: Very large file!) shows conditions from approximately 2:00pm to 7:00pm on Sunday. Multiple low-level boundaries (moving blue lines to the west) can be seen which aided in forming new showers and storms to move over the same areas repeatedly.
Zoomed Radar Loops
The first loop shows the time period from 2:46pm to 4:26pm. The initial rain shown caused minor street flooding between 3pm and 4pm. The heavier rain toward the end of the loop sparked the more significant flooding which began around the time this loop ends. Note that at the end of the loop -- 4:26pm -- a lull in the heavy rain is occurring in Ellicott City proper, with much of the rain area shifting south and east.
The next loop picks up at 4:26pm and goes until 6:03pm. The heavy rain to the south backbuilds over Ellicott City and persists for at least an hour, with a second round of heavy rainfall. Across the river in Catonsville and Oella, the brief break in the rain observed over Howard County never occurs, with persistent torrential rain throughout.
The third and final loop shown is from 6:03pm to 7:59pm. Another round of heavy rain, which caused flash flooding near Sykesville (top left of image) moves southeastward and threatens Ellicott City and Catonsville for a third time. Fortunately, the intensity weakens as it moves into the affected areas, avoiding a potential third flood wave.
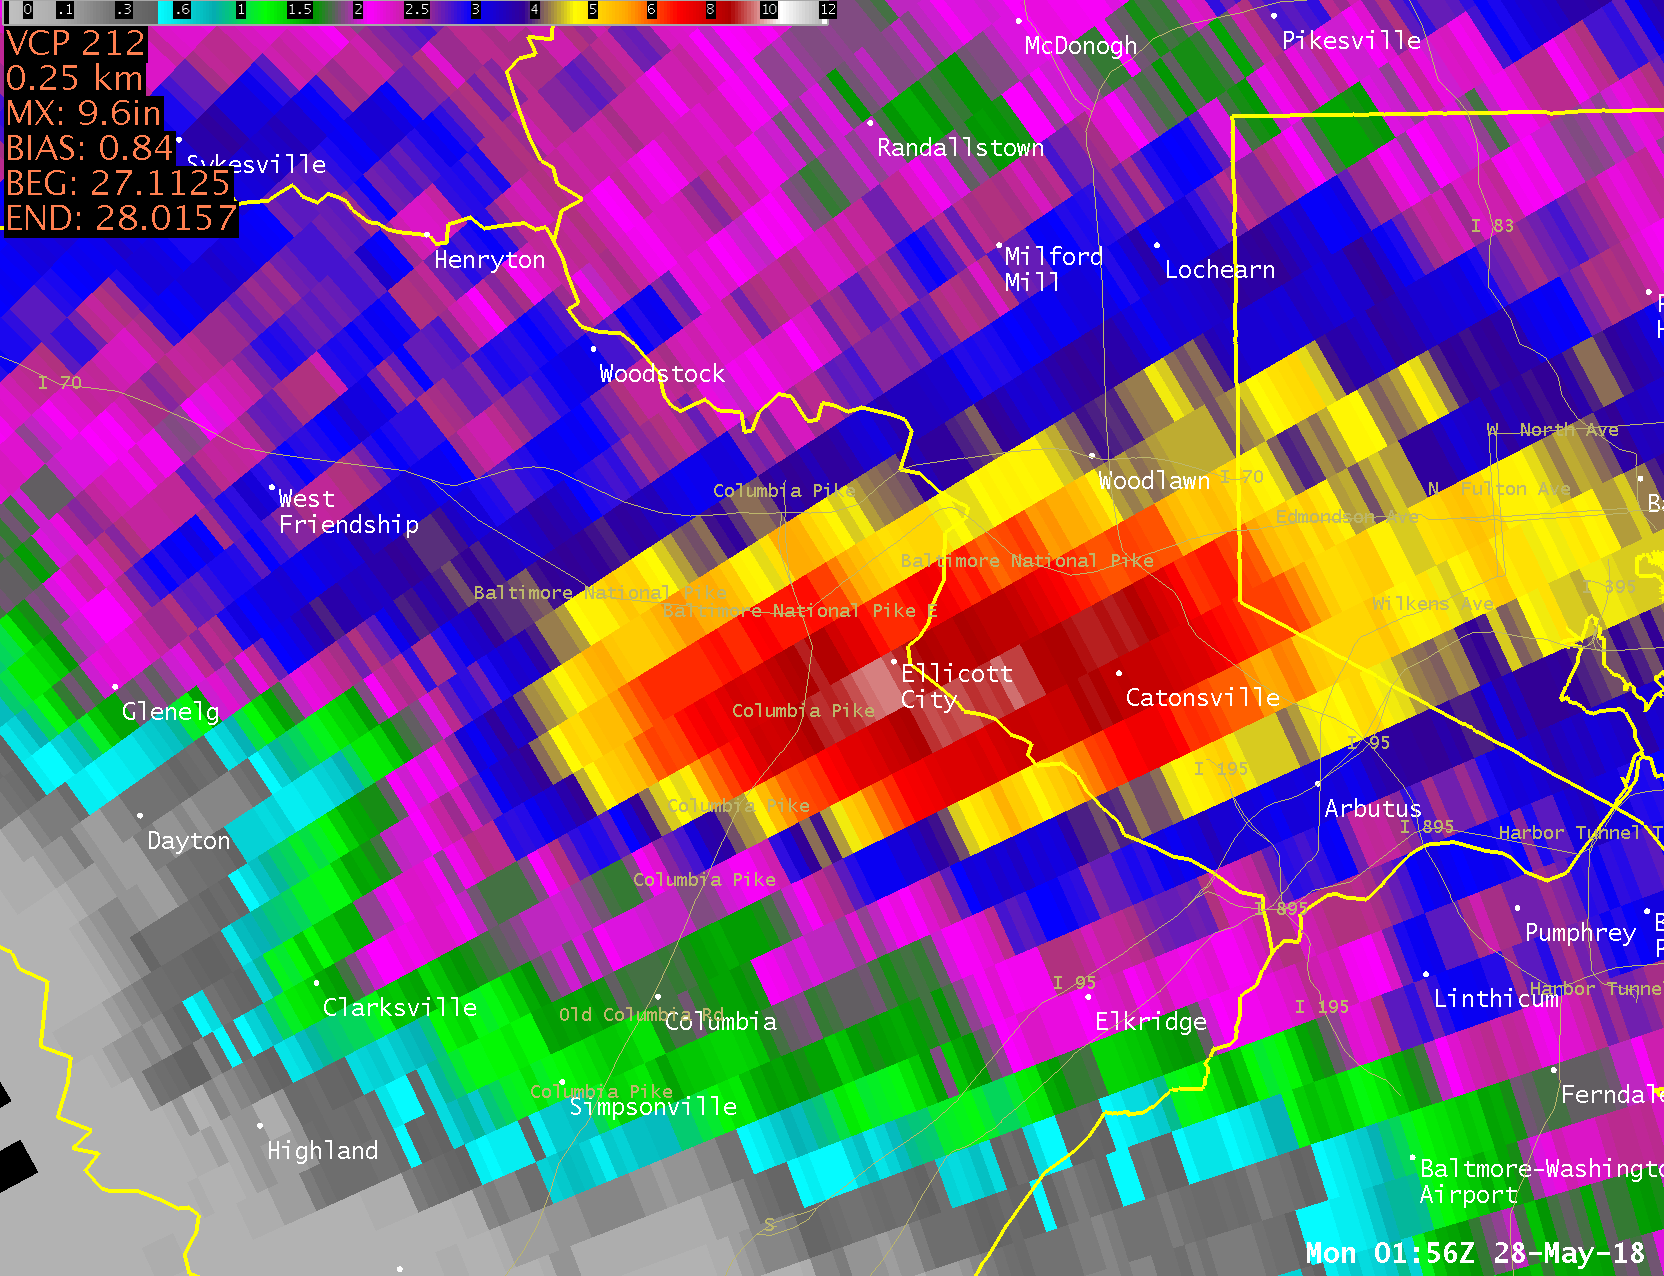
Total Rainfall
The image below shows radar rainfall estimates from the entire event. Radar estimated an unusually large area which received 4.5 inches or more, as indicated by the yellow, red, and white colors in the image. Areas colored in red were estimated to have received 6.5 inches or more, and the white/grey areas near and southwest of Old Town Ellicott City as well as across the river toward Catonsville received an estimated 9 inches or more.
To view the evolution of this rainfall, you can click below to view three loops showing the accumulation of Storm Total Precipitation over time. These loops correspond to the same three timeframes of the radar loops above:
2:46pm-4:26pm | 4:26pm - 6:03pm | 6:03pm - 7:59pm
As with the 2016 event in Ellicott City, Howard County's rain gauge at the Howard County government facility provided real-time rainfall observations.
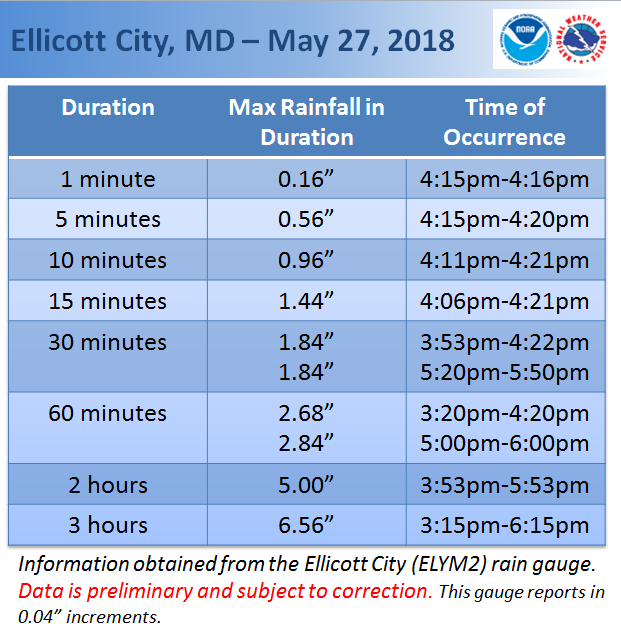
As you can see from the 30 and 60 minute durations, there were two distinct waves of heavy rain in Ellicott City, with a bit of a lull in between (only 0.32" was observed between 4:22pm and 5:00pm, with little or no measurable rain observed between 4:22pm and 4:33pm or between 4:50pm and 4:59pm). As noted in the rainfall estimates, heavier rain was estimated to have fallen to the south of this gauge's location, so this gauge was not within the heaviest rainfall area.
An image with selected observed rainfall totals on a background map of estimates is available here. A comparison of the 2018 rainfall to the 2016 rainfall can be found later in this review.
Stream Response / Flooding
The heavy rain was reflected in sharp rises on area streams monitored by the NWS. The gauges shown in the map below are referenced on this page.

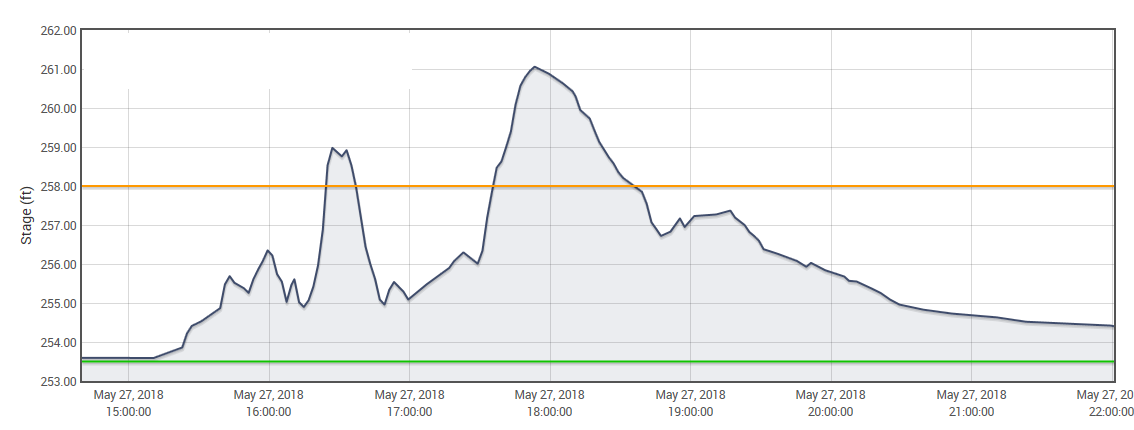
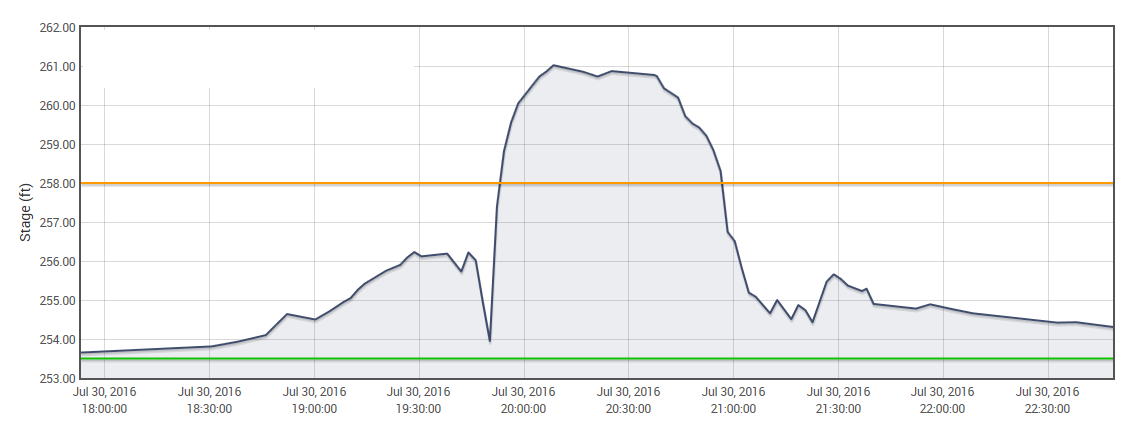
A stream gauge owned by Howard County on the Hudson Branch in Ellicott City was installed just before the 2016 flood, and operated during both the 2016 and 2018 flood events. In the 2018 flood, due to the two distinct periods of heavier rain, there were two peaks with a drop in water level in between. This differs from 2016 when there was a continuous one-hour period where water was out of banks and on Frederick Road / Main Street. A comparison of both events can be found later in this review.
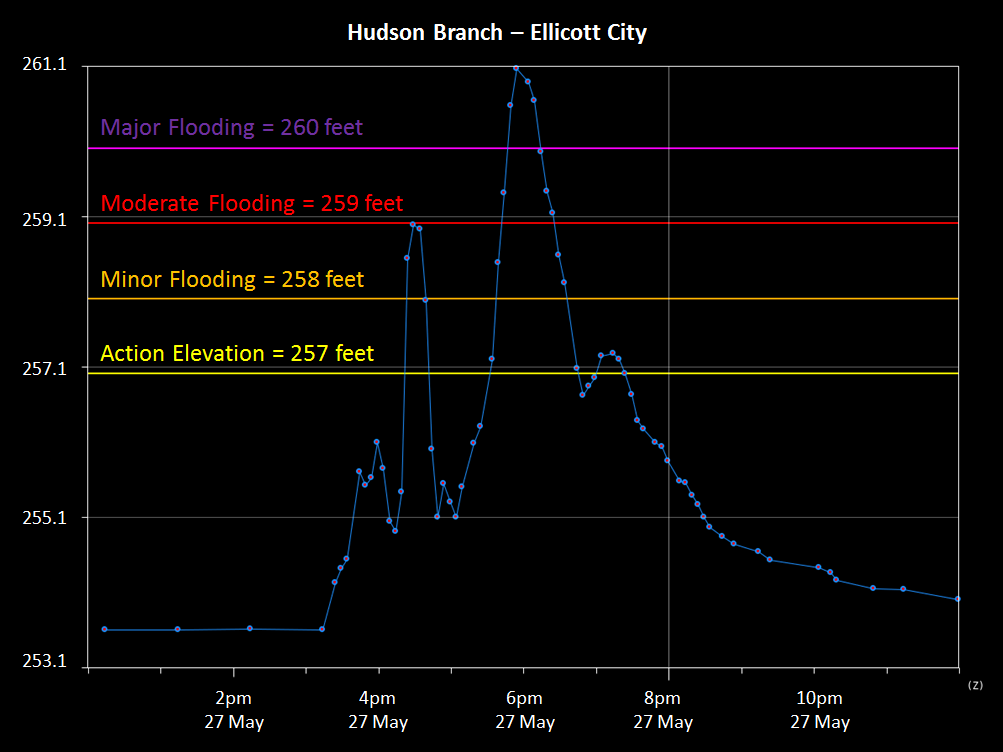
The stream rose a couple feet from the rain between 3pm and 4pm, but was still within its banks. The heavy rain just after 4pm caused the stream to rise about four feet between 4:14pm and 4:27pm, exceeding the capacity of the stream channel by nearly a foot. This lasted just 14 minutes and the stream then returned to the level it had been previously. A gradual rise was observed in the half hour between 5:00pm and 5:30pm, but the second round of heavy rain caused the stream to swell out of its banks again, rising five feet in 24 minutes, and exceeding the minor flood elevation of 258 feet for nearly an hour. The peak elevation observed was 261.06 feet at 5:53pm, a level almost equal to what occurred in the 2016 event (261.02 feet). A third rise occurred around 7pm as the third round of rain weakened while moving into the area; as a result of the weakening precipitation, there was not a third flood wave, just a small rise.
Although we do not have gauge information for the main Tiber River at the bottom of Main Street, video evidence clearly shows the event on lower Main Street was extremely significant during the first round of heavy rain, indicating that other branches of the Tiber were primary contributors to the initial flooding.
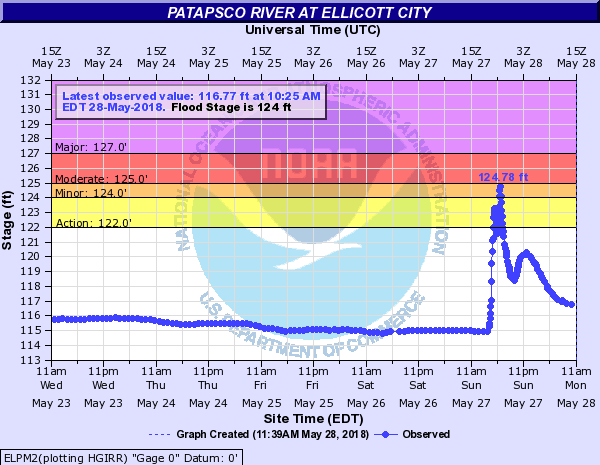
Meanwhile, the Patapsco River played less of a role in 2018 than in the 2016 event. The gauge at Ellicott City peaked at 124.78 feet elevation, which is more than three feet lower than 2016 (comparison is at the end of this review), but still high enough that the Patapsco's height probably kept water from being able to drain off Main Street as quickly as it otherwise would have. Similar to what occurred on the Hudson Branch, there were two separate peaks:
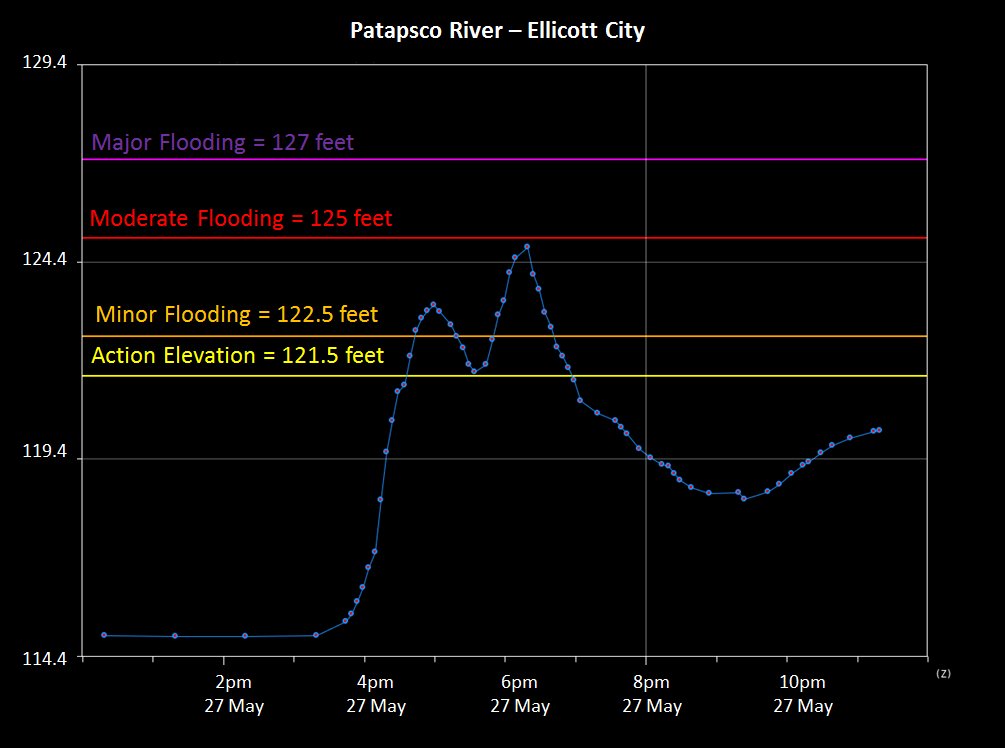
The first was around 5:00pm as a result of the first wave of rainfall; the second and higher peak was around 6:15pm. This gauge is located upstream of the mouth of the Tiber River and other small streams which flooded from the heaviest rainfall, so this location is not representative of the complete mass of water caused by this extreme event. In fact, the upstream gauge at Hollofield, which reached 14 feet in 2016, peaked at only half that level this time.
Downstream, preliminary data from USGS monitoring gauges near Catonsville and in Patapsco Valley State Park near Elkridge shows the river at those locations came close to, or exceeded, their levels from 2016. The USGS has responsibility for making final determinations regarding these peak levels, and the data values shown here could be revised after their review.
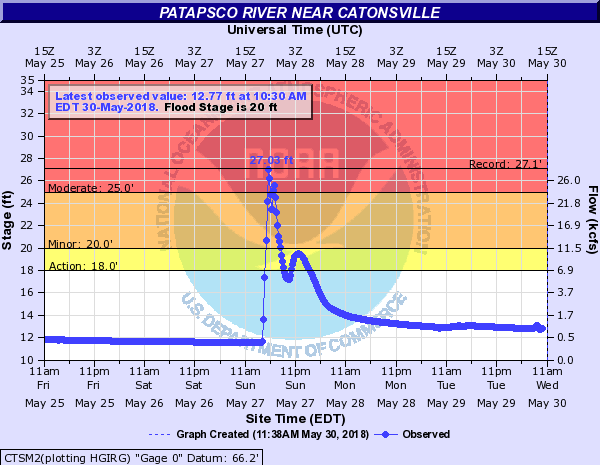
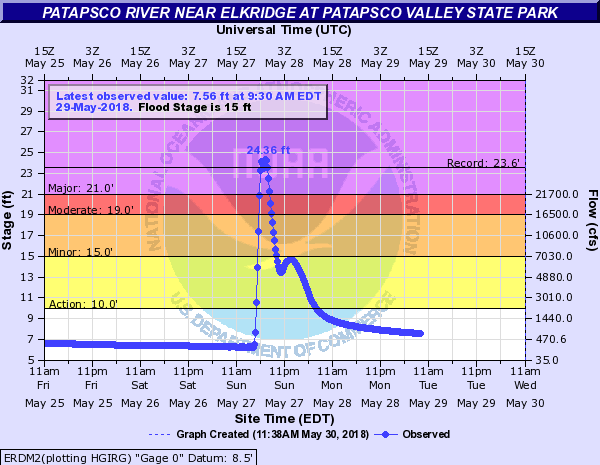
Although the rises observed (about 13.5 feet in an hour at both locations) were impressive, they were actually slightly less than what was observed in the 2016 event (about 14 feet in an hour at Catonsville and about 16 feet in an hour at Elkridge). Also note that although these values were near or above the levels shown on the graph as "records", the period of record at Catonsville and Elkridge dates back only to 2010.
Outside Ellicott City
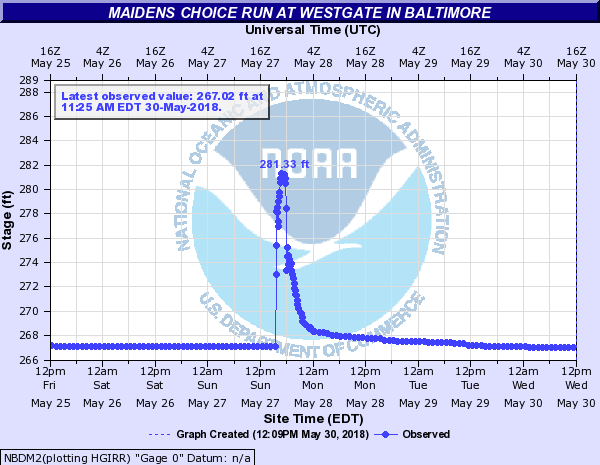
Although Ellicott City received most of the attention during this event, Catonsville, portions of Baltimore City, and the Dundalk and Perry Hall areas all also experienced significant flooding. Numerous images on social media showed water up over the bottoms of cars in the downtown area of Catonsville, and up to a foot deep in some backyards. A chunk of road was washed out on Thistle Road southwest of Catonsville, and a landslide was reported on Old Frederick Road in Oella. At least one water rescue was conducted in deep water on Ingleside Avenue near the Baltimore Beltway. Flooding was also reported in the Dundalk area, mostly of standing water in flood prone areas. Flooding also occurred in Baltimore City with damage in the Frederick Avenue area near Westgate. A stream gauge there on Maidens Choice Run rose over 11 feet in 30 minutes, with over four inches of rain in less than three hours:
Comparisons to 2016 Event
The pictures and video that came from the affected area in 2018 looked incredibly similar to those recorded in 2016. As noted above, however, there were differences in the timing of the rainfall (two rounds of rain in 2018 versus one in 2016), and the location (slightly further south in 2018 than in 2016).
Rainfall Comparison

Patapsco River at Ellicott City
2018 Graph
2016 Graph

Hudson Branch at Ellicott City
2018 Graph
2016 Graph


 Coastal Flood
 FAQ
FAQ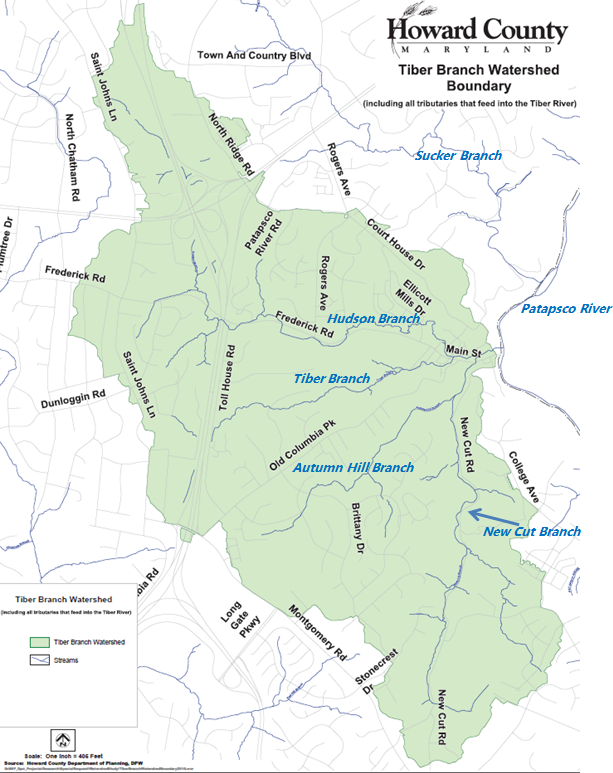