
Severe thunderstorms which can bring large hail, damaging winds, and isolated tornadoes will be possible over parts of the central U.S. through this weekend. Thunderstorms with heavy to excessive rainfall moving from Texas into the mid-Mississippi Valley through this weekend may produce areas of flooding. Read More >
On Saturday, July 30th, 2016, torrential rainfall occurred in and near Ellicott City, Maryland, causing severe flash flooding and destruction to the historic Old Town portion of the city. Two fatalities have been reported. Many buildings in Old Town Ellicott City were damaged, some significantly, and hundreds of vehicles were impacted. Significant land erosion also occurred.
Radar
This radar loop, from around 5:30pm to around 9:00pm and centered on Ellicott City, shows the evolution of the rain across the Ellicott City/Baltimore area. Several convective cells formed ahead of a larger area of rain, which then was followed by persistent heavy rain, with very little lightning, in a west-to-east band for around 90 minutes between 6:45pm and 8:30pm, and especially heaviest between 7:45 and 8:00. The National Weather Service issued a flash flood warning, which included Ellicott City and Baltimore, at 7:18pm. The first report of flooding near Ellicott City was in the Chatham area west of downtown at 8:01pm. Based on video evidence and resident interviews, the most severe flooding occurred between 8:05pm and 9:00pm.

Total Rain
The MRMS (Multi-Radar/Multi-Sensor) precipitation estimates from the event show the swath of most persistent heavy rain that occurred from northern Montgomery County, Maryland to Baltimore City. The image below is filtered to show only amounts over two inches. Areas in yellow are over 2.5 inches; red is over 4 inches; and the pixels of white near Ellicott City are estimates of over 6 inches. Much of this rain fell in 90 minutes or less.

Howard County operates an automated rain gauge at their county government facility and provides the data from it to the National Weather Service. Using data from this gauge, which reports in one-minute increments, the following information was determined:

(Please note: The table above, and the daily total, are slightly updated from previous information. NWS was able to obtain more precise -- in timescale -- data from this location on August 2nd.) The data remains preliminary and subject to further correction.
An interactive map of additional rainfall reports is also available.
Precipitation Frequency
The National Weather Service's Hydrometeorological Design Studies Center (HDSC) has completed an exceedance probability analysis for this rainfall event, based on the rainfall estimates and observed data shown above. A link to their analysis can be found here. At time durations of 5 minutes to 3 hours, the observed rainfall at the Ellicott City gauge has a probability of occurrence of less than or equal to 1/1000. This does not mean this extreme rainfall will only occur once in a thousand years. However, it is a rare and unlikely event. Based on statistical analysis, there is a 0.1% chance or less of this rainfall occurring in these time durations and location in any given year. For more details on the calculations, see the full report.

Stream Response / Flooding
Certainly, rain of this severity will cause a sharp rise on streams, and this was reflected in numerous automated stream gauges monitored by the NWS. The largest river impacted in this event was the Patapsco River, which is the county border between Howard and Baltimore Counties for much of its reach. At Ellicott City, the Patapsco rose just over 13 feet in 100 minutes (7:20pm - 9:00pm), and rose over two feet in just five minutes (8:40pm-8:45pm). This sharp 2+ foot rise coincides with the time when the most significant reports of flooding began to be received by the National Weather Service.
Hydrographs are shown below for the Patapsco River, from upstream to downstream. Click on any of them to view a larger version.


Although the values at Catonsville and Elkridge exceeded the "record" level, it is important to note that gauge readings at these two locations have only been in place since October 2010. Upstream at Hollofield, records date back to 1933, and the water levels observed in this event are nowhere near the record flood, as shown in the graphic below from the United States Geological Survey (USGS):

Numerous streams in the western Baltimore suburbs experienced flood conditions. The following graphics show all the USGS stream gauges that exceeded defined flood stages in this event. This data is provisional and subject to correction.


Post-Storm Survey
The National Weather Service joined the Howard County Office of Emergency Management and Howard County Department of Public Works in conducting a survey of affected areas of Ellicott City, Maryland on August 1st, 2016. The survey revealed clear signs of flooding both from the Patapsco River and from flash flooding within Ellicott City. Signs of flooding, including damaged pavement, were observed as far up as the intersection of Rogers Avenue and Frederick Road, where Hudson Branch came out of its banks. From this location, eyewitnesses reported seeing water not only in the creek, but moving swiftly down Main Street beginning "just after dark". The intersection of Rogers Avenue and Frederick Road is about 140 feet higher in elevation than the lower part of Old Town Ellicott City. Erosion was noted on both the street side and the creek side of homes along Main Street in a portion of the 8500 block.
The next signs of damage were in the 8300 block of Main Street, with damage again observed both on the creek/river side and the street side of Main Street. The creek/river side is where the most vehicles were impacted, in "Lot D".
In the 8200 block, surveys and surveillance footage show water anywhere from 6 inches to two feet inside buildings on Main Street along with substantial damage to sidewalks and infrastructure outside the buildings.
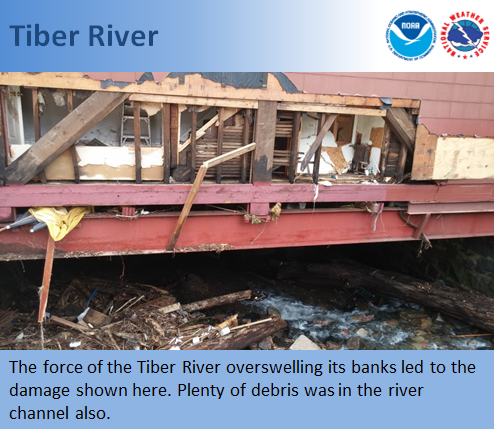
The most significant damage observed was near 8100 Main Street, where the street curves slightly. Based on topographic maps, this general area is also approximately where the extent of the Patapsco flooding would have reached based on the observed peak of 128.05 feet. Although we cannot say for certain, it is possible that this area being the meeting point of the upstream and Patapsco floodwaters could have caused more significant damage in that immediate area. Video surveillance footage reviewed after the event clearly indicates that water from the Tiber River was flowing through buildings on the south side of Main Street in this area, toward the street.
Closer to the Patapsco, damage continued with water marks observed 6-8 feet high on and in most buildings. The force of the floodwaters swept away the iconic Ellicott City clock as well as the historical flood marker that was attached to the railroad bridge. Although the survey team did not visit the Baltimore County side of the river during the survey, there are multiple reports of at least minor flooding of Oella Avenue and Route 144 due to the Patapsco escaping its banks.
We extend our appreciation to Howard County for coordinating the survey and accompanying the NWS to the affected area. After the 2016 flood, Howard County completed a case study throughout the affected area detailing damage and water movement pathways. This report can be accessed here.
Damage Photos
A selection of damage photos follows. These pictures were all taken August 1st by National Weather Service personnel. Additional pictures may be added to this collection in the future.


 Coastal Flood
 FAQ
FAQ