
Strong to severe thunderstorms will continue tonight across portions of the Ohio Valley into the Mid-Atlantic. Heavy rains may bring an isolated flash flooding threat over the central Appalachians, particularly in West Virginia. Moderate to heavy snow will continue over portions of northern Minnesota and the Upper Peninsula of Michigan through Tuesday morning. Read More >
(Page last updated February 11, 2019. Information is still being added to this page.)
All information presented here is preliminary and subject to future correction.
Click or tap on each header below to view additional information.
2018 was a memorable year for the Mid-Atlantic region, with some of the most frequent and persistent flooding observed in many years. While the severity of the flooding was not record breaking, the persistent nature of the rain kept conditions primed for flooding for about 75% of the year.
This page looks back at the significant and record-breaking rainfall from 2018, as well as the numerous flood events which occurred. Not all flood events are represented here; only the most significant are included.
Below is a map showing estimated rainfall (and melted snowfall) from the entire year. Click on it to make it larger:

PRELIMINARY RAINFALL RECORDS (with ending date):
Last updated after end of day 1/27/2019
2018 totals that did not set records are shown in purple. 2018 totals that did set records are in RED with the old record indicated. All information is preliminary and subject to correction.
|
|
BWI - Baltimore, MD |
DCA - Washington, DC/VA |
IAD - Dulles, VA |
|
1 day |
7.62 (8/23/1933) |
6.39 (8/23/1933) |
10.67 (6/21/1972) |
|
2 days |
8.50 (8/13/1955) |
9.41 (6/26/2006) |
12.63 (6/22/1972) |
|
3 days |
10.98 (8/23/1933) |
10.34 (6/27/2006) |
13.18 (6/22/1972) |
|
7 days |
13.87 (8/18/1955) |
11.37 (6/28/2006) |
14.13 (6/23/1972) |
|
14 days |
16.37 (7/28/2018) |
14.09 (7/2/2006) |
17.30 (7/3/1972) |
|
30 days |
18.90 (9/11/2011) |
17.45 (10/2/1934) |
18.78 (7/3/1972) |
|
60 days |
24.19 (9/13/2018) |
23.37 (9/22/1934) |
22.95 (7/1/1972) |
|
90 days |
31.21 (8/7/2018) |
28.85 (8/2/1886) |
27.71 (7/5/1972) |
|
120 days |
36.51 (9/9/2018) |
34.45 (9/9/2018) |
33.67 (9/9/2018) |
|
180 days |
48.39 (11/9/2018) |
44.66 (11/7/2018) |
44.15 (11/8/2018) |
|
365 days |
73.81 (1/27/2019)** |
70.60 (7/26/1886) |
68.75 (1/27/2019)** |
|
Calendar Year |
71.82 (2018) |
66.28 (2018) |
66.74 (2018) |
|
Wettest Calendar |
16.73 (July 2018) |
7.57 (Nov 2018) |
11.21 (July 2018) |
|
Wettest Two-month or Seasonal periods |
20.02 (Fall 2018) |
21.78 (Fall 1934) 13.39(Nov-Dec 2018) |
22.61 (Summer 2018) |
Other statistics
|
|
BWI |
DCA |
IAD |
|
Raindays |
169 (1889) |
159 (1889) |
155 (2003) |
|
Days ½” or more |
48 (2018) |
44 (1937) |
48 (2018) |
|
Days 1” or more |
20 (2018) |
24 (2018) |
23 (1996) |
|
Days 2” or more |
6 (2018) |
6 (1886 & 1878) |
5 (1993 & 1963) |
|
Consecutive Days |
|
>1/4 inch: |
>1/4 inch: |
Specifically at BWI:
The wettest June, July, September, October, November, and December have all been since 2005.
The July total of 16.73 is the second wettest calendar month on record, behind 18.35 in August 1955.
Preliminary Precipitation Totals for 2018
| Location | State | County | Total | Departure |
| MECHANICSVILLE 5 NE | MD | Saint Mary's | 80.78 | +35.03 |
| MILLERS 4 NE | MD | Carroll | 79.35 | +34.71 |
| FREE UNION | VA | Albemarle | 78.62 | +33.14 |
| EMMITSBURG 2 SE | MD | Frederick | 77.16 | +33.45 |
| FROSTBURG 2 | MD | Allegany | 74.58 | +30.17 |
| CHARLOTTESVILLE 2W | VA | Albemarle | 72.14 | +24.46 |
| BAYARD | WV | Grant | 71.86 | +21.66 |
| BWI AIRPORT | MD | Anne Arundel | 71.82 | +29.94 |
| MOUNT WEATHER 3 | VA | Clarke | 71.08 | N/A |
| CONOWINGO DAM | MD | Harford | 70.25 | +22.80 |
| MARYLAND SCIENCE CENTER | MD | Baltimore | 68.76 | +27.87 |
| NATIONAL ARBORETUM DC | DC | District of Columbia | 68.01 | +24.48 |
| WILLIAMSPORT | MD | Washington | 67.76 | +27.17 |
| KEYSER 2 SSW | WV | Mineral | 67.22 | +27.35 |
| HAGERSTOWN 1 E | MD | Washington | 67.10 | N/A |
| CUMBERLAND 2 | MD | Allegany | 67.06 | +29.70 |
| WASHINGTON DULLES INTL AP | VA | Loudoun | 66.74 | +25.20 |
| PURCELLVILLE | VA | Loudoun | 66.55 | N/A |
| WASHINGTON REAGAN NATIONAL AIRPORT | VA | Arlington | 66.28 | +26.54 |
| BELTSVILLE | MD | Prince George's | 65.90 | +24.06 |
| WINCHESTER | VA | Frederick | 65.86 | +27.53 |
| OXON HILL | MD | Prince George's | 65.26 | +20.72 |
| DAMASCUS 3 SSW | MD | Montgomery | 65.01 | +18.65 |
| WFO STERLING | VA | Loudoun | 64.66 | +21.73 |
| PATUXENT RIVER NAS | MD | Saint Mary's | 63.66 | +17.01 |
| CHARLOTTESVILLE ALBEMARLE AP | VA | Albemarle | 62.59 | +19.88 |
| STAUNTON WATER TREATMENT PLANT | VA | Augusta | 58.85 | +19.75 |
| MILL GAP | VA | Highland | 56.31 | +12.03 |
Autumn of 2017 and much of the winter of 2018 were quite dry in the mid-Atlantic region. Starting in April, greater and more routine rainfall began to occur, prompting several significant floods. We have done reviews of some of the events. Select the date (where available) for more information:
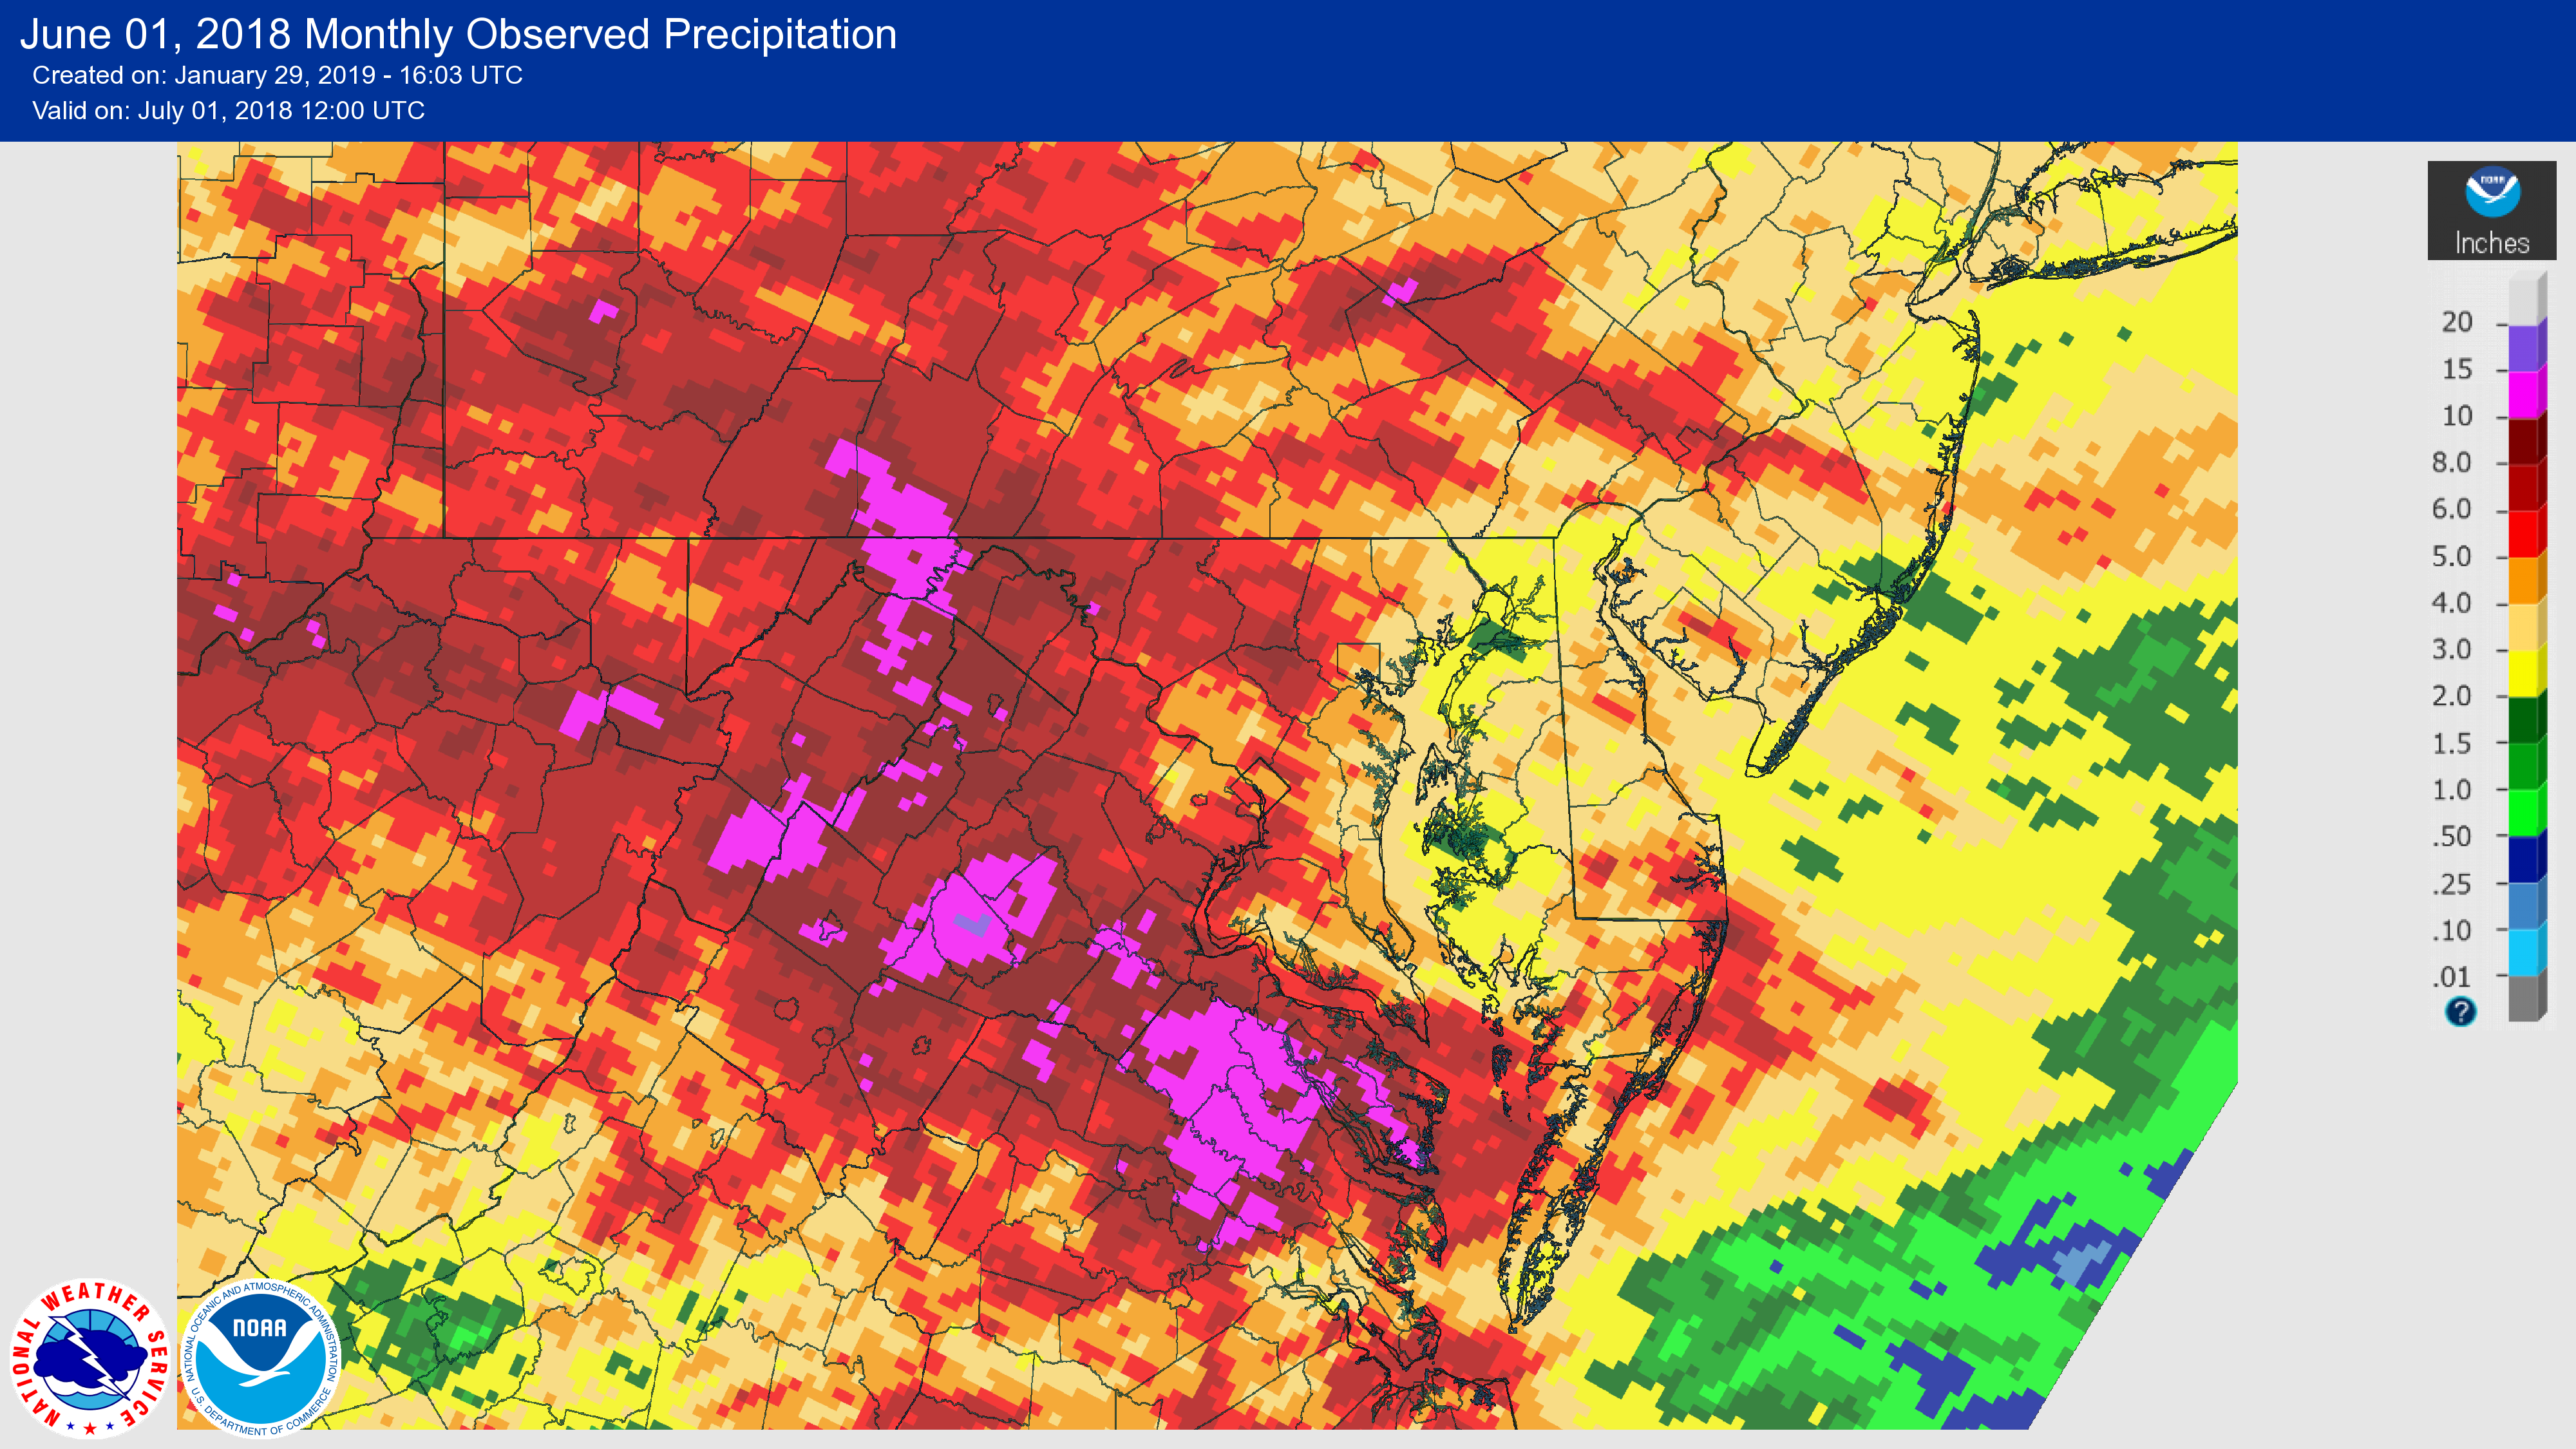
Below are the monthly estimated rainfall totals for each month, starting in April. (Currently only April through June are available due to webpage issues. We intend to add the rest of the months soon.) Click on each image to make it larger:


 Coastal Flood
 FAQ
FAQ