Baltimore/Washington
Weather Forecast Office
| Snow Amount Potential
Experimental - Leave feedback
|
|
| Expected Snowfall - Official NWS Forecast
Point Range
What's this? |
High End Amount 1 in 10 Chance (10%) of Higher Snowfall What's this? |
| Low End Amount 9 in 10 Chance (90%) of Higher Snowfall What's this? |
|
Low End Amount – 9 in 10 Chance (90%) of Higher SnowfallThis map depicts a reasonable lower-end snowfall amount for the time period shown on the graphic, based on many computer model simulations of possible snowfall totals. This lower amount is an unlikely scenario with a 9 in 10, or 90% chance that more snow will fall, and only a 1 in 10, or 10% chance that less snow will fall. This number can help serve as a lower-end scenario for planning purposes. Expected Snowfall - Official NWS ForecastThis map is the official NWS snowfall forecast in inches during the time period shown on the graphic. This snowfall amount is determined by NWS forecasters to be the most likely outcome based on evaluation of data from computer models, satellite, radar, and other observations. High End Amount – Only a 1 in 10 Chance (10%) of Higher SnowfallThis map depicts a reasonable upper-end snowfall amount for the time period shown on the graphic, based on many computer model simulations of possible snowfall totals. This higher amount is an unlikely scenario, with only a 1 in 10, or 10% chance that more snow will fall, and a 9 in 10, or 90% chance that less snow will fall. This number can help serve as an upper-end scenario for planning purposes. |
|
| Percent Chance That Snow Amounts Will Be Greater Than...
Experimental - Leave feedback
What's this?
Percent Chance That Snow Amounts Will Be Greater ThanThis series of maps shows the probability (that is, the likelihood) that snowfall will equal or exceed specific amounts during the time period shown on the graphic. These forecasts are based on many computer model simulations of possible snowfall totals. |
||||||||||||||||
|
||||||||||||||||
| Snowfall Totals by Location
Experimental - Leave feedback
What's this?
Snowfall Totals by LocationThese tables show the snowfall forecast for individual locations, and provide the same information as the graphics on this web page, just shown in a different way. All of these values are valid for the same time period as depicted on the graphics. |
||||||||||||||||||||||
|
|
||||||||||||||||||||||
| Ice Accumulation Potential
|
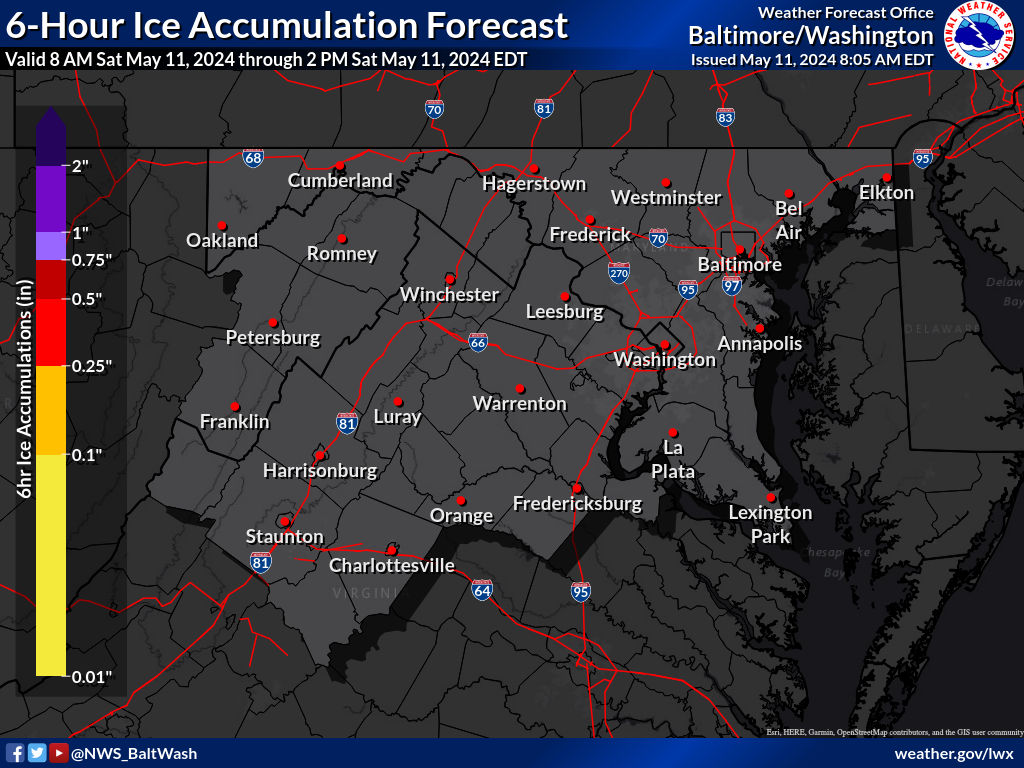
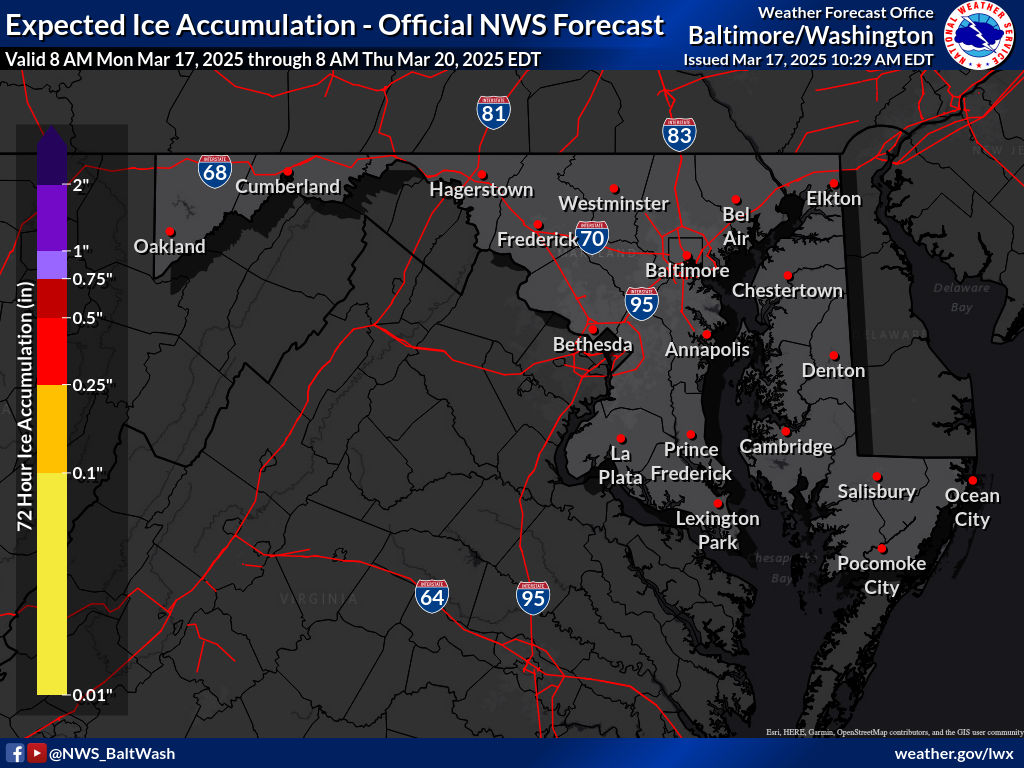
| Expected Ice Accumulation - Official NWS Forecast |
|---|
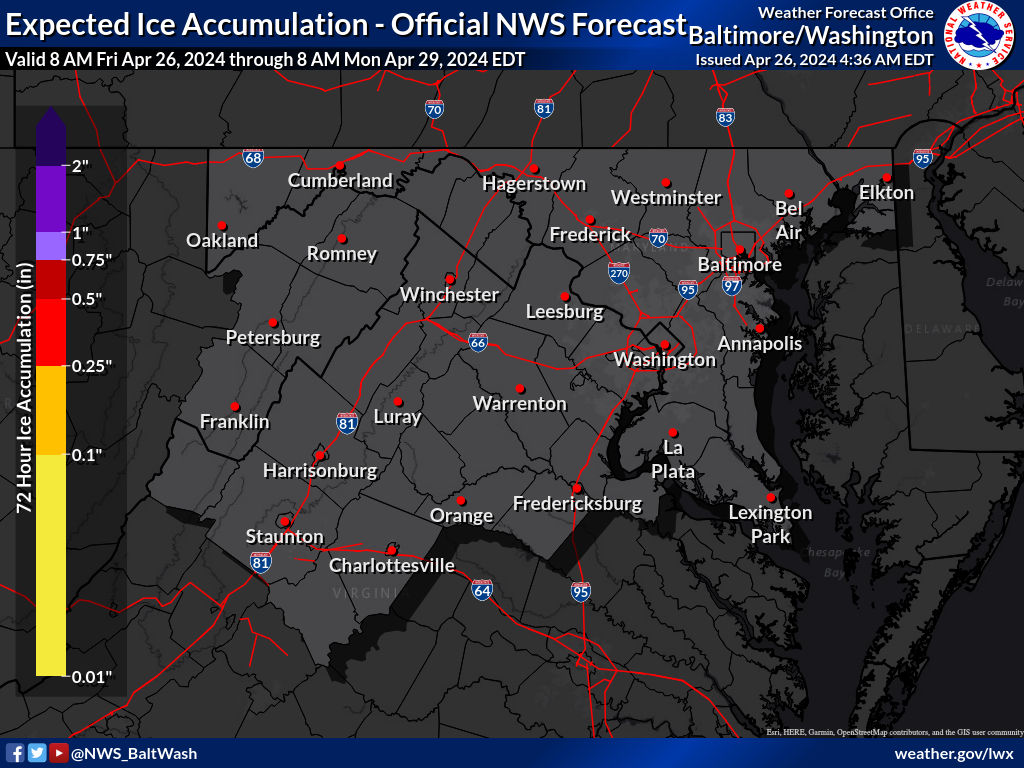 What's this? |
Most Likely Ice AccumulationRepresents our official ice forecast in inches within the next one to three days. The ice accumulation amounts are provided in ranges. |
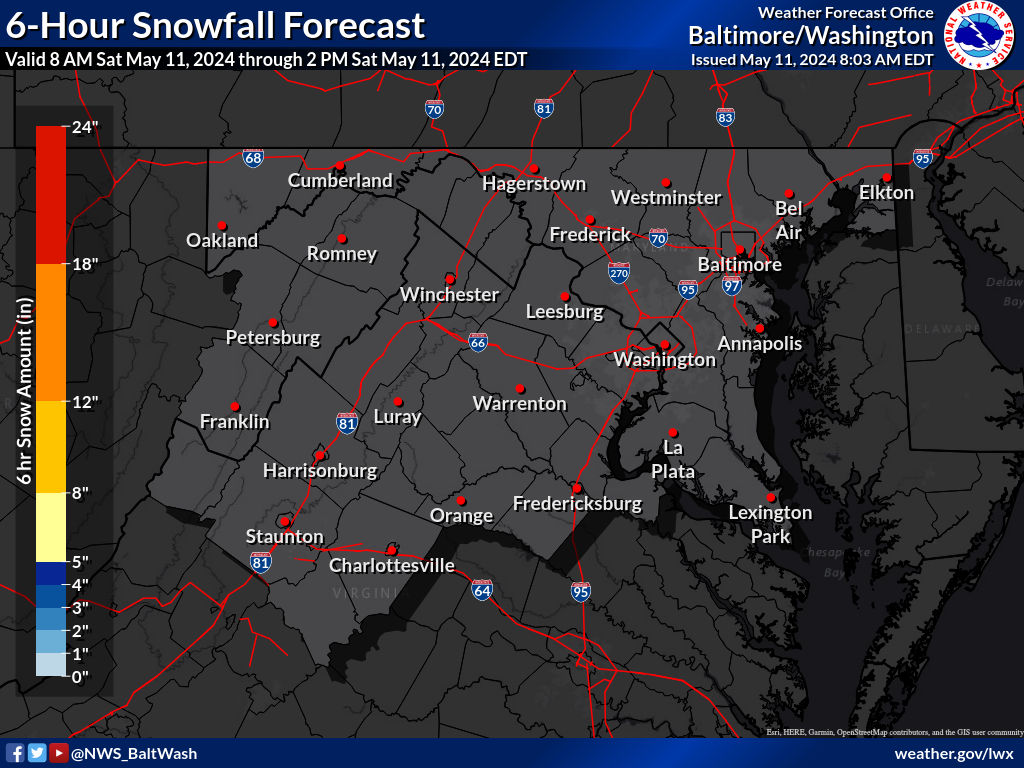 |
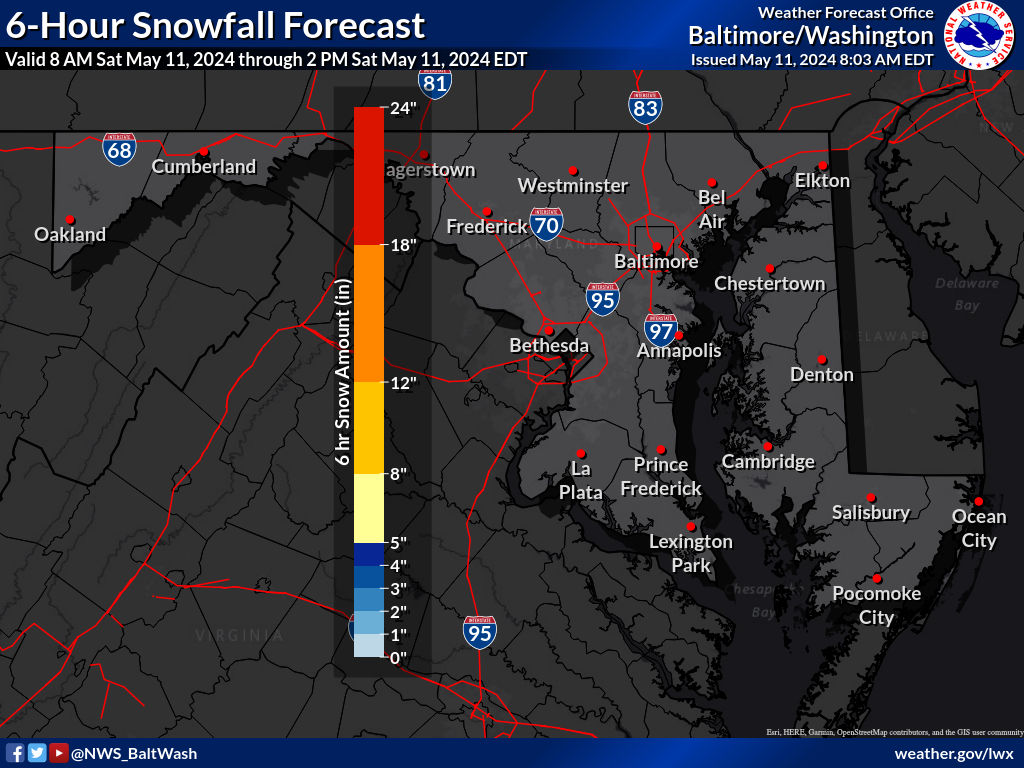 |
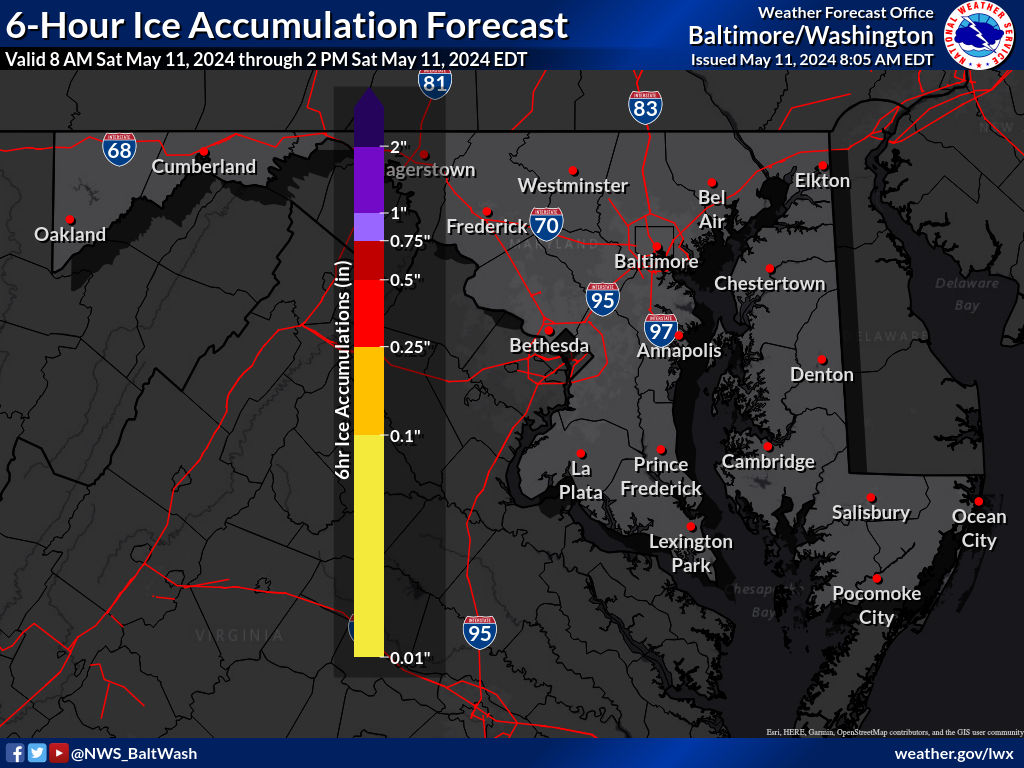 |
 |
| Snow Amount Potential
Experimental - Leave feedback
|
|
| Expected Snowfall - Official NWS Forecast
Point Range
What's this? |
High End Amount 1 in 10 Chance (10%) of Higher Snowfall What's this? |
| Low End Amount 9 in 10 Chance (90%) of Higher Snowfall What's this? |
|
Low End Amount – 9 in 10 Chance (90%) of Higher SnowfallThis map depicts a reasonable lower-end snowfall amount for the time period shown on the graphic, based on many computer model simulations of possible snowfall totals. This lower amount is an unlikely scenario with a 9 in 10, or 90% chance that more snow will fall, and only a 1 in 10, or 10% chance that less snow will fall. This number can help serve as a lower-end scenario for planning purposes. Expected Snowfall - Official NWS ForecastThis map is the official NWS snowfall forecast in inches during the time period shown on the graphic. This snowfall amount is determined by NWS forecasters to be the most likely outcome based on evaluation of data from computer models, satellite, radar, and other observations. High End Amount – Only a 1 in 10 Chance (10%) of Higher SnowfallThis map depicts a reasonable upper-end snowfall amount for the time period shown on the graphic, based on many computer model simulations of possible snowfall totals. This higher amount is an unlikely scenario, with only a 1 in 10, or 10% chance that more snow will fall, and a 9 in 10, or 90% chance that less snow will fall. This number can help serve as an upper-end scenario for planning purposes. |
|
| Percent Chance That Snow Amounts Will Be Greater Than...
Experimental - Leave feedback
What's this?
Percent Chance That Snow Amounts Will Be Greater ThanThis series of maps shows the probability (that is, the likelihood) that snowfall will equal or exceed specific amounts during the time period shown on the graphic. These forecasts are based on many computer model simulations of possible snowfall totals. |
||||||||||||||||
|
||||||||||||||||
| Other Snow/Ice Information | ||
| Storm Track | Observed Snow/Ice Amounts | Winter Storm Severity Index |
|---|---|---|
 |
||
| What's this? | What's this? | What's this? |
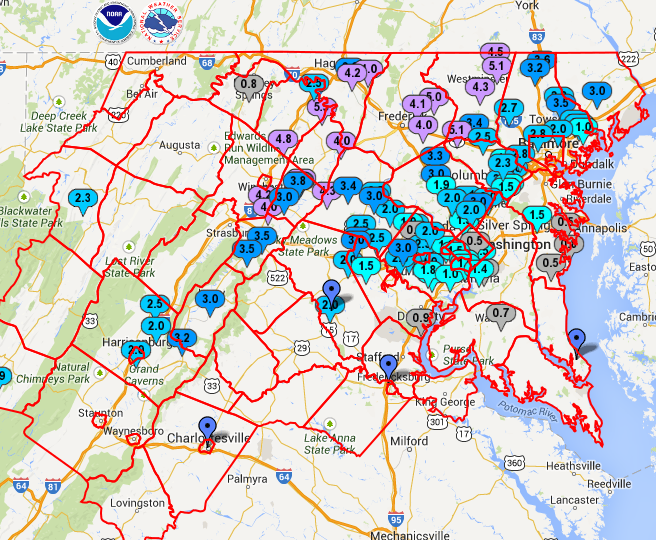
Low Tracks GraphicThe graphic depicts the forecast location of significant surface lows impacting the 48 contiguous United States in 12 hour increments out to 72 hours into the future. The low position and track forecast by NCEP WPC meteorologist is in white. Each low position is accompanied by a lead time (Eastern Time). The circles around each low represents a 75% probability the observed low will be located with the circle. Note: The probability is derived using previous season's verification data. For reference, existing surface lows are depicted with a red marker without yellow circles. ReportedAs snow and/or ice reports come into the NWS (you can email reports to lwx.webmaster@noaa.gov or Tweet to @NWS_BaltWash), we will pass them on here. With the map linked here, and the supporting reports below it, you can keep tabs on how much has fallen.Winter Storm Severity IndexThe purpose of the Winter Storm Severity Index (WSSI) is to provide NWS partners and the general public with an indication of the level of winter precipitation (snow and ice) severity and its potential related societal impacts. |
||
| Useful Winter Weather Information | ||
| Historic Mid-Atlantic Winter Storms |
Winter/Snowfall Statistics |
El Niño and DC/Baltimore Winters |
| Watches, Warnings, & Advisories |
How to Measure Snow |
La Niña and DC/Baltimore Winters |
|
|
||
| At Home | On the Road | Outside in the Cold |
| Onset/End of Wintry Precipitation | ||
| Onset of Wintry Precipitation (For areas under Warning or Advisory) |
End of Wintry Precipitation (For areas under Warning or Advisory) |
|
|---|---|---|
 |
||
| What's this? | What's this? | |
Precipitation OnsetMost likely time of winter precipitation onset (snow, sleet, freezing rain). Rain is not included here. This information is provided when we issue a Warning or Advisory for expected snow or ice accumulation; typically six to 24 hours in advance. Times are only given for places that are under a Warning or Advisory. They will be blank in areas outside Warnings or Advisories. Precipitation End TimeMost likely time that the accumulating winter precipitation ends (snow, sleet, freezing rain). Rain is not included here. This information is provided when we issue a Warning or Advisory for expected snow or ice accumulation; typically six to 24 hours in advance of the onset. Times are only given for places that are under a Warning or Advisory. They will be blank in areas outside Warnings or Advisories. |
||
| Maryland Ice Accumulation Forecast | ||
  |
||
US Dept of Commerce
National Oceanic and Atmospheric Administration
National Weather Service
Baltimore/Washington
Weather Forecast Office Baltimore/Washington
43858 Weather Service Rd.
Sterling, VA 20166
(571) 888-3500
Comments? Questions? Please Contact Us.
Thank you for visiting a National Oceanic and Atmospheric Administration (NOAA) website. The link you have selected will take you to a non-U.S. Government website for additional information.
NOAA is not responsible for the content of any linked website not operated by NOAA. This link is provided solely for your information and convenience, and does not imply any endorsement by NOAA or the U.S. Department of Commerce of the linked website or any information, products, or services contained therein.
You will be redirected to:


 Coastal Flood