Meteorological Processes in the Atmosphere (Part 1)
Across the Ohio and middle Mississippi Valleys and southeastern United States, a number of major precipitation events (including snowstorms) typically are associated with significant isentropic lift, entrance regions of jet streaks, frontogenetical forcing, some degree of instability, and sometimes fronts aloft. These processes are not separate; they are inter-related in a non-linear atmosphere. Atmospheric temperature structure also is crucial. Therefore, we must understand these processes well in order to produce accurate forecasts.
THERMODYNAMIC/TEMPERATURE PROCESSES
- Temperature advection, adiabatic warming/cooling, and diabatic effects can have major influences on atmospheric temperatures and precipitation type in the cool season, especially during borderline rain/snow situations.
- Effects of these processes on temperature: Warm (cold) air advection causes a temperature increase (decrease) at a particular level or in a layer. Adiabatic cooling (warming) occurs when air rises (descends), resulting in a temperature decrease (increase). When the air is stable, then adiabatic cooling due to lift will have a more substantial effect on temperature than for an unstable atmosphere. Diabatic effects include diurnal heating/nocturnal cooling, condensation, evaporative cooling, and melting.
- Diurnal heating/nocturnal cooling affects temperature (especially in low levels).
- Condensation produces latent heat release, which produces warming that can counteract somewhat the effects of adiabatic cooling from lift. Latent heat release is most noteworthy in convection.
- Evaporative cooling occurs as precipitation falls into relatively dry low levels. The precipitation evaporates in the drier air which causes cooling in low levels and at the surface. In borderline rain/snow cases, this can cause frozen precipitation to remain as such until low-level saturation occurs, or it could cause liquid precipitation to temporarily change to frozen or freezing precipitation. Once the low-level air mass saturates, then evaporative cooling no longer is a factor.
- Melting (of snow to rain aloft or snow on the ground) causes a small amount of cooling in the atmosphere since heat from the environment is needed to melt the ice crystals. If significant melting occurs aloft, then an isothermal layer at or below 0 deg C could result. A saturated isothermal layer is important for heavy precipitation production since the layer will be associated with a larger absolute moisture content than one in which temperature and mixing ratio decrease with height.
- Advection and vertical motion often oppose each other. Warm advection usually causes ascent, which in turn produces adiabatic cooling to at least partially counteract the warming. However, vertical motion due only to warm advection likely will not be strong enough to completely counteract the warming and any latent heat release. Thus, low-level (e.g., 850 mb) temperatures and thicknesses usually will rise during warm advection situations. However, occasionally temperatures and thicknesses may not rise (perhaps even fall) in the face of warm advection (models can show this). For this to occur, other forcing mechanisms must be present to produce much stronger vertical motion (often on a smaller scale), including significant jet streaks, frontogenesis, and/or CSI/convective instability. Therefore, models can hint that significant mesoscale processes may be present to produce strong enough lift and adiabatic cooling to overwhelm warm advection. This often is a scenario, given adequate moisture, for heavy precipitation production, such as was the case during the January 16-17, 1994 snowstorm in Kentucky in which 1 to 2 feet of snow fell across parts of north-central Kentucky in less than a 12-hour period.
- Strong adiabatic cooling could cause precipitation to fall as or change to snow during the period of maximum lift during borderline rain/snow situations.
COLD FRONTS ALOFT
- The classic Norwegian Cyclone Model (NCM; Fig. 1), developed many years ago, involves development of an incipient weather disturbance along a frontal zone into an mature open wave extratropical cyclone and then into an occluded system. In this model, steady precipitation usually occurs along and ahead of a warm front, with a band of showery precipitation along the cold front.
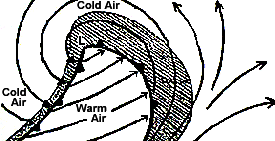 |
Fig. 1: Typical frontal structure (open wave cyclone) and precipitation pattern associated with the Norwegian Cyclone Model. Precipitation is located along and ahead of the warm front with a band of showers along the cold front. |
- The NCM possesses several problems, including the fact that it fails to explain detailed mesoscale frontal and precipitation structures associated with typical extratropical cyclones. Thus, alternative extratropical cyclone models have been devised to allow for a more scientific and correct analysis and evolution of cyclogenesis, fronts, airflow, and precipitation patterns within winter storms.
- Cold fronts are not all homogeneous, i.e., they vary in associated temperature contrast, wind shift, and precipitation regimes. Two basic groups of cold fronts have been suggested.
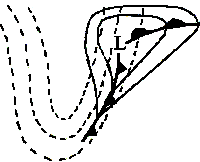
- Ana-cold fronts (Figs. 2a and 2b) are associated with relatively deep/sharp troughs aloft, i.e., the upper flow is roughly parallel to the surface front. In these cases, the surface fronts often possess sharp temperature changes and wind shifts, and significant vertical motion. System-relative airflow exhibits a sloping rearward ascent of warm, moist air which can result in a line of showers or thunderstorms along the front and extensive post-frontal precipitation.
 |
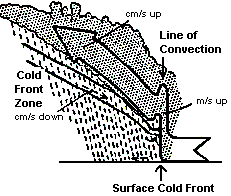 |
Fig. 2a (far left): Typical 500 mb (dashed height lines) and surface low and frontal pattern associated with a ana-cold front.
Fig. 2b (near left): Common precipitation pattern with ana-cold fronts. A line of convection may be along the front with post- frontal precipitation due to "system- relative" front-to-rear sloped ascent behind the front.
|
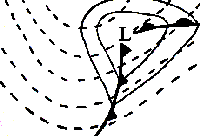
- Kata-cold fronts (Figs. 3a and 3b) are not as well-defined as ana fronts, and usually possess weak-to-moderate temperature gradients and scattered showery precipitation along the front. Kata fronts occur with a less amplified flow pattern (i.e., more westerly momentum) aloft, which results in a system-relative forward sloping ascent and a band or area of more significant precipitation ahead of the surface front.
 |
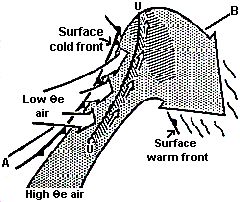 |
Fig. 3a (far left): Typical 500 mb (dashed height lines) and surface low and frontal pattern associated with a kata-cold front.
Fig. 3b (near left): Common frontal, precipitation, and flow (large hatched arrow) regime associated with a kata-cold front. Precipitation occurs along a cold front aloft (CFA; line U-U) located ahead of the surface front with drier air aloft behind the CFA. Precipitation also occurs along/ahead of the warm front. Scattered showers are possible along the surface cold front due to low-level moisture and any lift.
|
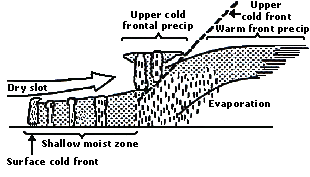
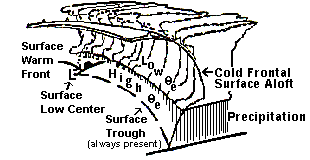
- Precipitation patterns associated with kata fronts have been explained via a split cold front or cold front aloft (CFA) model. The cold front aloft (Figs. 3b, 4a, and 4b) is associated with the leading edge of cold advection aloft (often evident at 700 mb and on satellite imagery), as well as with frontogenesis and convergence between warm, moist air ahead of the CFA and cooler, drier air behind it. This typically produces significant lift and a band or area of stratiform and/or convective precipitation along and ahead of the CFA within the surface warm sector. This is one explanation of why we often see "pre-frontal" squall lines.
 |
 |
| Fig. 4a: Vertical cross-section of clouds and precipitation patterns associated with a CFA (dashed line). Rain and possible convection occurs along and ahead of the CFA, with scattered showers and possible thunderstorms behind the CFA and along the surface cold front. |
Fig. 4b: A 3-D view of a CFA and surface cold front/trough and warm front. An area of rain and possible thunderstorms occurs along and ahead of the CFA with drier air aloft overtop low-level moisture behind the CFA. Scattered showers and thunderstorms are possible along the surface cold front assuming ample instability and lift. |
- At the same time, in general a less active surface boundary/cold front exists behind the CFA, especially in the cool season when only limited instability may be present. However, in the warm season, some sunshine could occur between the CFA and surface boundary (as drier air moves in aloft overtop low-level moisture). The convective instability may then be released through surface/low-level convergence along the surface boundary leading to development of a line of strong convection, especially if additional upper-level dynamics are present.
- It is very important to monitor fronts aloft via satellite imagery, the leading edge of 700/500 mb cold advection, and shortwaves (perhaps subtle) in model data. Sometimes, model data suggest fronts aloft via their relative humidity pattern, although many times, they indicate too high/widespread RH and precipitation duration forecasts versus that observed.
ISENTROPIC ANALYSIS
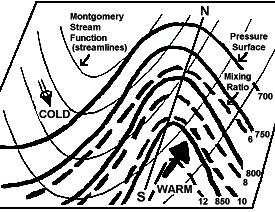
- An isentropic process is an adiabatic process (i.e., no parcel heat exchange with its environment). For synoptic scale weather systems, air parcels generally move along constant potential temperature/theta (i.e., isentropic) surfaces, NOT constant pressure (isobaric) surfaces (Figs. 5a and 5b). In other words, air moves in 3 dimensions, not on horizontal pressure surfaces.
 |
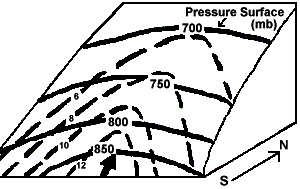 |
| Fig. 5a: Example of an isentropic surface in 2-dimensions. Bold solid (dashed) lines are lines of constant pressure/isobars (mixing ratio/isohumes) while the bold arrow is wind direction on the surface. Flow is from higher-to-lower values of pressure and moisture. Thus, ascent/upward moisture transport is occurring. |
Fig. 5b: Same as Fig. 5a except the isentropic surface is shown in 3 dimensions to more clearly show ascent and upward moisture transport. |
- Isentropic analysis allows the ability to attain quantitative estimates of vertical motion and coherently track air flow and the 3-dimensional transport of moisture in space and time (unlike pressure coordinates).
- Vertical motion on an isentropic surface is determined via pressure advection, which is analogous to temperature advection on a constant pressure surface (e.g., 850 mb). In other words, an area of warm air advection at 850 mb likely also is an area of isentropic lift.
- Isentropic ascent and upward moisture transport (Fig. 5) are present in areas where winds on the theta surface cross isobars and isohumes (mixing ratio lines) from higher-to-lower values of pressure (similar to warm advection on a pressure surface) and mixing ratio.
- For descent, wind flow is from lower-to-higher pressure, and often from lower-to-higher values of mixing ratio which produces drying.
- The stronger the winds, the tighter the pressure gradient (i.e., the steeper the slope of the isentropic surface), and the more perpendicular the winds are to the isotherms and isohumes, the stronger the upward motion and moisture transport will be. This can lead to significant precipitation.
- Vertical motion values associated with isentropic lift usually are "synoptic-scale" values, i.e., on the order of several (perhaps 5-10) cm/s.
- Divergence within entrance and exit regions of jet streaks (see below) can increase the flow along isentropic surfaces and isentropic lift.
- Significant diabatic effects, e.g., latent heat release or diurnal heating/cooling, and isentropic analysis near the ground are limitations and can make accurate isentropic analysis difficult.
JET STREAKS
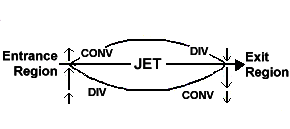
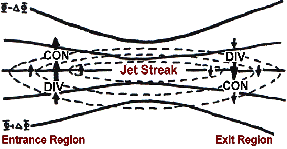
- A "jet streak" refers to a portion of the overall jet stream where winds along the jet core flow are stronger than in other areas along the jet stream. Entrance and exit regions of jet streaks are very important in terms of vertical motion, surface pressure systems, and organized precipitation given sufficient low-level moisture. Exit regions are where air parcels "exit" out of a jet streak and decelerate downstream from the jet core (Fig 6). Entrance regions are where parcels "enter" into a jet streak and accelerate upstream from the jet core (Fig. 6).
 |
 |
| Fig. 6a: Idealized example of the entrance and exit regions of a straight jet streak. Highest winds are within the streak along the line/arrow labeled "jet." Divergence (div) usually occurs within the left exit and right entrance regions, while convergence (conv) normally occurs in the right exit and left entrance regions. |
Fig. 6b: Example of the entrance and exit regions of a straight jet streak. Dashed lines are lines of equal wind speed (isotachs); solid lines are height lines along which the total wind blows. The small arrows denote a component of the ageostrophic wind due to jet streaks that results in divergence and convergence in exit and entrance regions. |
- Within the exit and entrance regions of jet streaks, air parcels moving at different speeds become out of balance with the existing thermal (temperature) gradient in these regions. Thus, the atmosphere attempts to restore (thermal wind) balance through vertical motion. The vertical motion is attained through ageostrophic winds. Thus, vertical motion is required within entrance and exit regions of jets.
- In general, the more the "along-stream variation of the total wind" within an exit and entrance region (i.e., the faster the winds are accelerating within an entrance region or decelerating in an exit region per unit area along the flow; Fig. 6b), the greater the vertical motion must be to restore thermal wind balance. The "cross-stream variation" (i.e., how quickly wind speeds change in a plane perpendicular to the jet axis) also is important in promoting vertical motion fields.
- Within jet entrance and exit regions, the cross-stream component of the inertial advective part of the ageostrophic wind (i.e., the small arrows in Fig. 6b) dictates the amount of divergence/convergence (and subsequent vertical motion) due to jet streak dynamics. Upper-level divergence (convergence) often is associated with upward (downward) vertical motion in the atmosphere.
- However, even without the presence of a jet streak, curvature in the flow (i.e., upper-level troughs and ridges) results in divergence/convergence (and subsequent vertical motion) due to the along-stream component of the inertial advective part of the ageostrophic wind (Fig. 7). The stronger the curvature (i.e., the more amplified the jet pattern) and the shorter the wavelength between a trough and ridge axis aloft, the greater the upper-level divergence pattern will be due to the along-stream component of the ageostrophic wind.
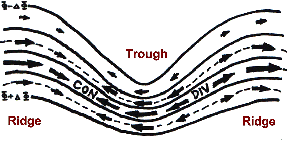 |
Fig. 7: Example of an upper-level flow pattern showing trough and ridge axes. Solid lines are constant height lines. Arrows are a component of the ageostrophic wind due to troughs and ridges that results in convergence (con) and divergence (div) aloft. |
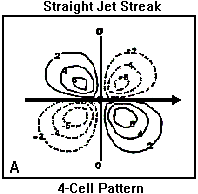
- Thus, upper-level divergence (of the ageostrophic wind) is caused by 1) jet streak entrance and exit regions, and 2) curvature and wavelength of the overall flow (troughs and ridges). It is very important to consider both these phenomena. It can be advantageous to look at the two components of the upper-level ageostrophic wind individually to assess which phenomena is most important to the production of vertical motion. These two components also explain 1) why 4-cell divergence patterns associated with straight jet streaks become 2-cell patterns for curved jets, and 2) why divergence values for curved jet streaks usually are stronger than that for straight jets (see below).
- For STRAIGHT jet streaks, a 4-cell pattern of divergence aloft and vertical motion usually occurs (Fig. 8a).
 |
 |
 |
| Fig. 8a: Four-cell pattern of divergence/vertical motion associated with a straight jet streak. In the dashed left exit (i.e, upper right portion of image) and right entrance jet regions (lower left portion of image), divergence aloft and upward motion usually occur. Convergence and downward motion usually prevail in the solid line right exit (lower right) and left entrance (upper left) regions of a straight jet streak. |
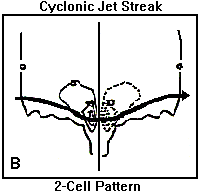
Fig. 8b: Two-cell pattern of divergence/upward motion (dashed; jet exit region, i.e., right half of image) and convergence/downward motion (solid; jet entrance region, i.e., left half of image) associated with a cyclonically-curved jet streak. Values often are greater than those with a straight streak. |
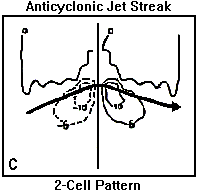
Fig. 8c: Same as Fig. 8b except for an anticyclonically-curved jet streak. Divergence aloft and upward motion occur in the jet right entrance region (left half of image) with convergence and descent in the jet right exit region (right half of image). |
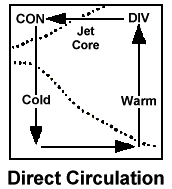
- Within entrance regions, a thermally direct secondary circulation (Fig. 9a) occurs associated with the ageostrophic wind. Warm air usually rises within the right entrance (right rear) region while cold air sinks in the left entrance region. To complete the circulation, horizontal ageostrophic winds often flow from warm-to-cold air at upper levels, and from cold-to-warm air at low levels. The circulation is on the order of approximately 400-600 km in horizontal extent.
- Within exit regions, a thermally indirect secondary circulation (Fig. 9b) occurs. Cold air rises in the left exit (left front) region and warm air sinks in the right exit region. The horizontal ageostrophic components include flow from warm-to-cold air at low levels and from cold-to-warm air at upper levels.
 |
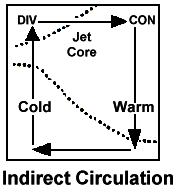 |
Fig. 9a (far left): Idealized "box" direct thermal circulation in the entrance region of jet streaks. Warm air rises in the right entrance region; cold air sinks in the left entrance region. Horizontal ageostrophic flow occurs from colder to warmer air in low levels.
Fig. 9b (near left): Idealized indirect thermal circulation in the exit region of jet streaks. The circulation is opposite that shown in Fig. 9a.
|
- However, circulations associated with jet streaks are not "boxes" as shown in the examples above. Typically, vertical components are sloped along isentropic surfaces (Fig. 10). Thus, jet streak circulations and isentropic surfaces are not independent. In other words, in jet entrance and exit regions, enhanced upper-level divergence may lead to enhanced flow and vertical motion along isentropic surfaces.
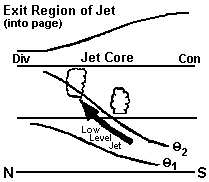 |
Fig. 10: Cross-section of an east-west jet streak exit region. The core of jet is directed into the page so that the right (left) side of the image is the right (left) exit region. A more realistic sloped ascent (bold arrow) roughly along isentropic surfaces (sloped thin solid lines) occurs toward the level of maximum upper-level divergence. |
- For CURVED jet streaks, the "classic" 4-cell (Fig. 8a) vertical motion pattern can be more complicated, and usually becomes a 2-cell vertical motion pattern.
- For a cyclonically-curved jet (Fig. 8b), maximum upper divergence values and subsequent ascent usually are found along and to the left of the core of the exit region, with descent along and to the left of the entrance region.
- For an anticyclonically-curved jet (Fig. 8c), upper divergence and ascent are strongest along and to the right of the entrance region, with descent along and to the right of the exit region.
- Ascent/descent values usually are greatest for cyclonically-curved jet streaks, second greatest for anticyclonically-curved jet streaks, and relatively weakest (but still significant) for straight jets assuming adequate along-stream variation in the wind (Fig. 8).
- If varying temperature patterns (isotherms) are superimposed on jet streaks, different thermal advection pattern will result aloft. This can cause the location of maximum divergence and convergence to shift slightly with respect to the jet core.
- Occasionally, the ascending branches of two separate jet streaks may be coincident over one location. This merger (coupling) is associated with the ascending branches of the direct circulation in the entrance region of one jet and the indirect circulation in the exit region of a second jet. This interaction maximizes upper-level divergence and vertical motion.
Let's look closer at entrance regions of jet streaks, since they are important to significant precipitation events (including snowstorms) in the Ohio Valley.
Part II
Back to Training Documents


