|
Van L. DeWald, Theodore W. Funk, and Joseph D. Kirkpatrick |
Yeong-Jer Lin |
|
|
National Weather Service Forecast Office |
Dept. Of Earth and Atmospheric Sciences |
1. INTRODUCTION
During the evening of 18 May 1995, a squall line and embedded intense bowing line segment across south-central Kentucky produced widespread straight-line wind damage, hail, funnel clouds, and several tornadoes. The bowing segment exhibited a very complex evolution during its 2.5 h lifespan, including a pronounced storm-scale frontal pattern (i.e., LEWP), intense rear inflow jet (RIJ), multiple cyclonic circulations (mesocyclones), and eventual high precipitation (HP) supercell characteristics.
This paper utilizes high-resolution reflectivity and velocity data from the Louisville-Ft. Knox (KLVX) WSR-88D radar to analyze the complex storm-scale evolution of the 18 May 1995 squall line, and to promote a better understanding of bow echo structure for forecasters responsible for issuing severe weather warnings. Particular emphasis is placed upon two cyclonic circulations within the bowing segment, each of which produced tornadoes.
2. SYNOPTIC ENVIRONMENT
The 0000 UTC 19 May synoptic environment was characterized by strong dynamic forcing, similar to that described by Johns (1993), which played an important role in the overall growth and sustenance of the squall line. The line moved across south-central Kentucky within an axis of upper-level divergence to the right of a 40-45 m/s jet core at 300 mb (Fig. 1). At the same time, a 25 m/s low-level jet caused enhanced moisture convergence and a northward transport of high equivalent potential temperature (theta-e) air along and ahead of the convective line, which was in progress in advance of a surface low and cold front at 0000 UTC. The resulting strong forcing helped maintain intensity of the squall line.
 |
Fig. 1: Composite synoptic chart at 0000 UTC 19 May. Thicker (thinner) arrow is the 300 (850) mb jet, while dashed lines are 850 mb theta-e (deg K). Also shown are surface fronts, 500 mb heights (in dm; thin solid lines), the 0000 UTC squall line (sqln) position, and the 2338 UTC 18 May vertical wind profile (VWP; in kts and 1000s of ft) from the KOHX (Nashville, TN) WSR-88D. |
A moderately unstable and strongly sheared environment existed across the Ohio Valley. Sounding data at 0000 UTC from Nashville, Tennessee (just ahead of the squall line) indicated a lifted index of -6 to -8 and a CAPE value of approximately 2300 J/kg (not shown). The sounding's vertical wind profile revealed about 20 m/s (mostly speed) shear in the 0-2 km layer, while WSR-88D data from Nashville (KOHX) showed nearly 25 m/s shear in this layer (Fig. 1). Johns (1993) stated that such shear values are associated with bow echo occurrence, while Weisman (1992) suggested that high ambient shear is conducive to maintenance of long-lived squall lines and embedded bowing segments. In addition, the Nashville sounding disclosed a 0-2 km storm-relative helicity value of nearly 300 m2/s2, which is associated with possible mesocyclone and tornado development (Davies-Jones et al. 1990).
3. OVERALL WSR-88D OBSERVATIONS
WSR-88D 0.5 base reflectivity data at 2255 UTC 18 May indicated the presence of strong convective clusters within a developing squall line over south-central Kentucky (Fig. 2). Corresponding storm-relative velocity (SRM) data (not shown) revealed the presence of rear-to-front flow behind these clusters associated with a developing rear inflow jet (RIJ). Storm-relative mid-altitude radial convergence (MARC) values as high as 30 m/s also were present between 3.5 and 6.5 km altitude above the southern edge of the northernmost cluster at 2255 UTC ("C1" in Fig. 2). Przybylinski (1995) and Schmocker et al. (1996) suggested that MARC values of 25 m/s or more at 3 to 7 km altitude were noted prior to the initial onset of damaging downburst winds and significant bowing in squall lines. In this case, substantial MARC apparently promoted downburst activity which contributed to a stronger and focused RIJ. The enhanced rear inflow then produced rapid development of a bowing line segment and tight reflectivity gradient by 2315 UTC near the southern edge of "C1" (Fig. 2), beneath the observed MARC aloft. Subsequent strong low-level convergence between the RIJ and sheared environment resulted in rapid multicellular growth and the maintenance of a damaging bowing segment across Kentucky (Fig. 2). The most pronounced bowing signature generally was observed within the highest reflectivity values, which revealed a convective-scale frontal/LEWP structure.
 |
 |
 |
Fig. 2: Low-level base reflectivity data (0.5 deg elevation) from the KLVX WSR-88D showing the evolution of "Storm 1" between 2255 and 0059 UTC. Contours are at 10 dBZ intervals starting at 30 dBZ. Values over 40 (50) dBZ are shaded light (dark). Values over 60 dBZ are shaded lighter inside the dark 50 dBZ area. "T" denotes the location of a tornado at 2330 UTC, while "WEC" identifies a weak echo channel behind the leading line. |
 |
 |
 |
|
 |
 |
 |
Straight-line wind damage was maximized along the apex of the bowing segment on the nose of the RIJ, similar to various previous studies (e.g., Przybylinski 1995). In addition, a total of 6 cyclonic circulations were identified within the bowing structure ("Storm 1" in Fig. 3). Circulations 1 through 3 matured just north of the bow apex and RIJ, while Circulations 4, 5, and 6 were associated with HP supercell characteristics which developed within the bowing segment after 0000 UTC. At least 4 of the 6 circulations produced tornadoes of F0 to F2 intensity. Multiple cyclonic circulation and tornado development within organized bow echoes also were noted by Funk et al. (1996a and 1996b). The two "Storm 2" circulations (Fig. 3) occurred within classic supercell structure on the southwest portion of the squall line (not shown). "Storm 2" findings are not presented in this paper.
 |
Fig. 3: Rotational cyclonic circulation ("Circ") tracks identified for "Storms" 1 and 2. Black dots along the tracks represent 5-min interval circulation positions, with beginning and ending times (in UTC) noted. |
4. EVOLUTION OF CIRCULATION 1
As the bowing segment ("Storm 1") developed, Circulation 1 (Fig. 3) initially was identified at 2305 UTC as a low-to-mid-level cyclonic-convergent area between the RIJ and the environmental inflow along the leading edge of the convection. As the bow echo matured rapidly, Circulation 1 quickly evolved into a tight, cyclonic circulation and increased in strength and depth (Fig. 4). During its mature stage (i.e., 2315 to 2330 UTC), Circulation 1 met the rotational velocity (Vr) criteria of a strong mesocyclone (Burgess et al. 1993). During this stage, the circulation produced an F1-F2 tornado, coincident with the period of maximum depth and Vr values (23 m/s or 46 kts at 1.8 km altitude). At 2330 UTC, the tornado was enveloped within precipitation just north of the bow apex, while the parent mesocyclone ("Circ 1") showed a tight circulation at 1.9 km altitude (0.5 elevation; Fig. 5). At 7.5 km height (3.4 elevation), the vortex also was clearly evident. Although Circulation 1 extended to appreciable depth, its highest Vr values remained in the lowest few km of the atmosphere.
 |
Fig. 4: Magnitudes of rotational velocity (Vr in kts) for Storm 1, Circulation 1. Time in UTC and depth (altitude) in km are shown. The "T" and adjacent straight line reveal the period of a tornado associated with the circulation. |
At 2330 UTC, highest reflectivity values showed significant bowing at 7.5 km altitude (3.4 elevation), and were tilted downwind from that at low levels (Fig. 5). However, prior to bow echo formation (e.g., 2255 UTC), convective towers generally were erect. Thus, the change in vertical storm structure appears directly related to intensification of an elevated RIJ, which clearly was evident aloft at 2330 UTC (Fig. 5). Weisman (1992) also has suggested that during the early stages of simulated bow echoes, convective towers tend to tilt downwind as the ambient vertical shear overwhelms the convective cold pool.
 |
 |
Fig. 5: Base reflectivity and storm-relative velocity (SRM) data at 2330 UTC at 0.5 deg (top row: 1-8-2.0 km altitude; 100-110 km range) and 3.4 deg (bottom row: 7.3-7.7 km altitude). Reflectivity contours and shading are the same as that in Fig. 2. SRM contours are at 10 kt intervals, with outbound radial velocities (solid lies) shaded dark and inbound velocities (dashed lines) shaded light. "Circ 1" denotes Circulation 1, while "T" denotes the location of a tornado. "WEC" and "RIJ" indicate the presence of a weak echo channel and rear inflow jet, respectively. Bold solid lines are county borders. |
 |
 |
SRM data at 0.5 and 3.4 revealed the presence of a pronounced RIJ, which was coincident with a weak echo channel (WEC) and the apex of the bowing structure (Fig. 5). At 3.4, the RIJ was surrounded by two regions of front-to-rear flow, which produced trailing stratiform precipitation. The cyclonic and anticyclonic shear zones suggested the possible presence of bookend vortices, which Weisman (1993) stated promotes an enhanced RIJ, subsequent continued multicellular development, and a long-lived bow echo. If present, the current case, however, suggests that these vortices may be more complex within organized squall lines than idealized vortices simulated by Weisman. Funk et al. (1996b) also noted apparent complex bookend vortices within a bow echo-producing MCS.
Between 2330 and 0000 UTC, the bowing segment progressed across south-central Kentucky, although less areal coverage of 50 dBZ cells was noted (Fig. 2) and convective towers showed decreased downwind tilt. This trend may have been attributable to a deeper convective cold pool, which briefly overwhelmed the ambient shear resulting in shallower cells. Nevertheless, wind damage continued along the bow apex during this period. In addition, Circulations 2 and 3 (Fig. 3) were identified near the apex, although they were less intense than Circulation 1 and did not produce any reported tornadoes.
5. EVOLUTION OF CIRCULATION 4
An apparent renewed balance between the cold pool and enhanced ambient shear produced deeper, intensified convection between 0000 and 0015 UTC (Fig. 2) and the emergence of Circulation 4 (Fig. 3). The circulation was initially identified as a low-level cyclonic-convergent area along the bow apex, similar to previous circulations. However, as Circulation 4 matured (Fig. 6), HP supercell characteristics emerged as the vortex produced a redistribution of the heaviest precipitation within the storm and the appearance of a subtle bounded weak echo region (BWER) between 0015 and 0024 UTC (Fig. 7). The corresponding SRM data (e.g., at 0024 UTC; Fig. 7) indicated a well-defined, deep-layered vortex coincident with the BWER that met mesocyclone depth and strength criteria (Vr of 20 m/s or 40 kts at 3.4 km altitude; Fig. 6). An F1-F2 tornado developed around 0014 UTC, coincident with the initial development of HP supercell characteristics and the rapid intensification and deepening of Circulation 4 (Fig. 6).
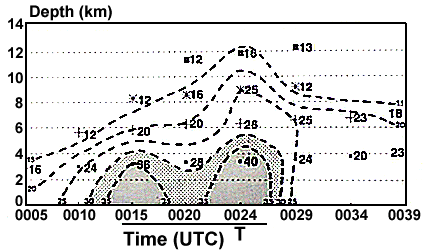 |
Fig. 6: Same as Fig. 4, except rotational velocity (Vr) for Storm 1, Circulation 4. |
 |
 |
Fig. 7: Base reflectivity and storm-relative velocity (SRM) data at 0024 UTC at 0.5 deg radar elevation (3.3-3.7 km altitude; 160-170 km range). Reflectivity (SRM) contours and shading are the same as that in Fig. 2 (Fig. 5). "Circ 4" denotes Circulation 4. The "X" within the small unshaded circle on reflectivity data denotes the location of both a subtle BWER and Circulation 4. "RIJ" indicates the presence of a rear inflow jet. Bold solid lines are county borders. |
It is interesting to note that Circulation 4 (160 km from the radar) appeared to weaken in the low levels between 0015 and 0020 UTC, then re-intensify considerably by 0024 UTC (Fig. 6). However, corresponding reflectivity and mid-level velocity trends suggested that the convection continued to strengthen between 0015 and 0024 UTC. Thus, it is likely that improper radar sampling, attributable to the radar's "aspect ratio" (Burgess et al. 1993), caused the apparent decrease in Vr at 0020 UTC. At increasing distant from the radar, one must carefully consider the overall character of storms to determine their true severity.
After 0024 UTC, Circulation 4 weakened and became less defined within the overall storm complex. As this occurred, a new cyclonic-convergent area (Circulation 5; Fig. 3) quickly developed along the nose of the RIJ, just south of Circulation 4. The new vortex strengthened rapidly and deepened with time (not shown), and produced an F2 tornado as the circulation merged with the existing HP storm complex. Circulation 6 (Fig. 3) then evolved in a similar manner as Circulations 4 and 5, and produced an F1 tornado during the period of maximum vortex intensity (not shown). Circulations 4 through 6 appeared to occur with multicellular elements within the overall HP storm, a structure that Funk et al. (1996a) also noted, and that Moeller et al. (1994) termed an "HP supercell-multicell hybrid" system. In addition, during most of its life cycle, two circulations existed simultaneously within "Storm 1," a trend which also was noted in a long-lived bowing line segment studied by Funk et al. (1996a).
6. SUMMARY
The 18 May 1995 squall line over south-central Kentucky organized quickly from clusters of convection in response to increasing rear inflow, mid-altitude radial convergence (MARC), and a dynamic, strongly-sheared environment. Subsequent rapid bow echo formation within the squall line exhibited multicellular growth during its 2.5 h lifespan, with an eventual transition to an HP supercell- multicell hybrid. Throughout its life cycle, the bowing segment produced straight-line wind damage along its apex, and 6 identifiable circulations, 4 of which produced tornadoes of F0-F2 intensity. Vortex genesis generally occurred in the lower levels along the bow apex, then increased in depth and strength, before weakening within the overall flow regime in the storm complex. Tornado development was coincident with low- and mid-level vortex intensification. Evaluation of distant mesocyclone evolution was hampered slightly by radar sampling problems.
The complicated evolution and interactions of the 18 May 1995 case, and other similar organized squall lines will continue to challenge forecasters' ability to issue timely and accurate warnings of such events. Examination of this case will continue. Future work will focus on further evaluation of mesocyclone evolution, MARC, mesoscale airflow structures, and radar sampling issues.
7. ACKNOWLEDGEMENTS
This paper was funded from a sub award under a cooperative agreement between NOAA and the University Corporation for Atmospheric Research (UCAR).
8. REFERENCES
Burgess, D.W., R.J. Donaldson, Jr., and P.R. Desrochers, 1993: Tornado detection and warning by radar. The Tornado: Its Structure, Dynamics, Prediction, and Hazards, edited by C. Church, D. Burgess, C. Doswell, and R. Davies-Jones, Amer. Geophys. Union, 203-221.
Davies-Jones, R.P., D. Burgess, and M. Foster, 1990: Test of helicity as a tornado forecast parameter. Preprints, 16th Conf. on Severe Local Storms, Kananaskis Park, Alberta, Canada, Amer. Meteor. Soc., 588-592.
Funk, T.W., K.E. Darmofal, J.D. Kirkpatrick, M.T. Shields, R.W. Przybylinski, Y.-J. Lin, G.K. Schmocker, and T.J. Shea, 1996a: Storm reflectivity and mesocyclone evolution associated with the 15 April 1994 derecho, Part II: Storm structure and evolution over Kentucky and southern Indiana. Preprints, 18th Conf. on Severe Local Storms, San Francisco, Amer. Meteor. Soc., 516-520.
____, B.F. Smull, J.D. Ammerman, 1996b: Structure and evolution of an intense bow echo embedded within a heavy rain producing MCS over Missouri. Preprints, 18th Conf. on Severe Local Storms, San Francisco, Amer. Meteor. Soc., 521-526.
Johns, R.H., 1993: Meteorological conditions associated with bow echo development in convective storms. Wea. Forecasting, 8, 294-299.
Moeller, A.R., C.A. Doswell III, M.P. Foster, and G.R. Woodall, 1994: The operational recognition of supercell thunderstorm environments and storm structures. Wea. Forecasting, 9, 327-347.
Przybylinski, R.W. 1995: The bow echo: Observations, numerical simulation, and severe weather detection methods. Wea. Forecasting, 10, 203-218.
Schmocker, G.K., R.W. Przybylinski, and Y.-J. Lin, 1996: Forecasting the initial onset of damaging downburst winds associated with a mesoscale convective system (MCS) using the mid-altitude radial convergence (MARC) signature. Preprints, 15th Conf. on Weather Analysis and Forecasting, Norfolk, Amer. Meteor. Soc., 306-311.
Weisman, M.L., 1992: The role of convectively generated rear-inflow jets in the evolution of long-lived meso-convective systems. J. Atmos. Sci., 49, 1826-1847.
____, 1993: The genesis of severe, long-lived bow echoes. J. Atmos. Sci., 50, 645-670.


 Weather Story
 Weather Map
 Local Radar