Louisville, KY
Weather Forecast Office
 |
Historical Leap Day Weather | |
| Louisville | Lexington | Bowling Green | Frankfort | |
| Highest Temperature | 77° in 1972 | 75° in 1972 | 77° in 1972 | 70° in 1972 and 1976 |
| Highest Average Temperature | 62° in 1972 | 61° in 1972 | 64° in 1904 | 63° in 1904 |
| Lowest Temperature | 9° in 1884 | 13° in 1960 | 8° in 1884 | 17° in 1964 and 1980 |
| Lowest Average Temperature | 19° in 1884 | 21° in 1980 and 1960 | 16° in 1884 | 29° in 1984 |
| Wettest | 0.54" in 2012 | 1.11" in 2012 | 1.38" in 2012 | 0.98" in 2012 |
| Snowiest | 2.2" in 1912 | 0.5" in 1996 and 1968 | 3.0" in 1920 | 1.0" in 1920 |
| Deepest Snow Cover | 6" in 1984 | 3" in 1984 and 1960 | 3" in 1884 | 3" in 1984 |
Detailed weather for each Leap Day:
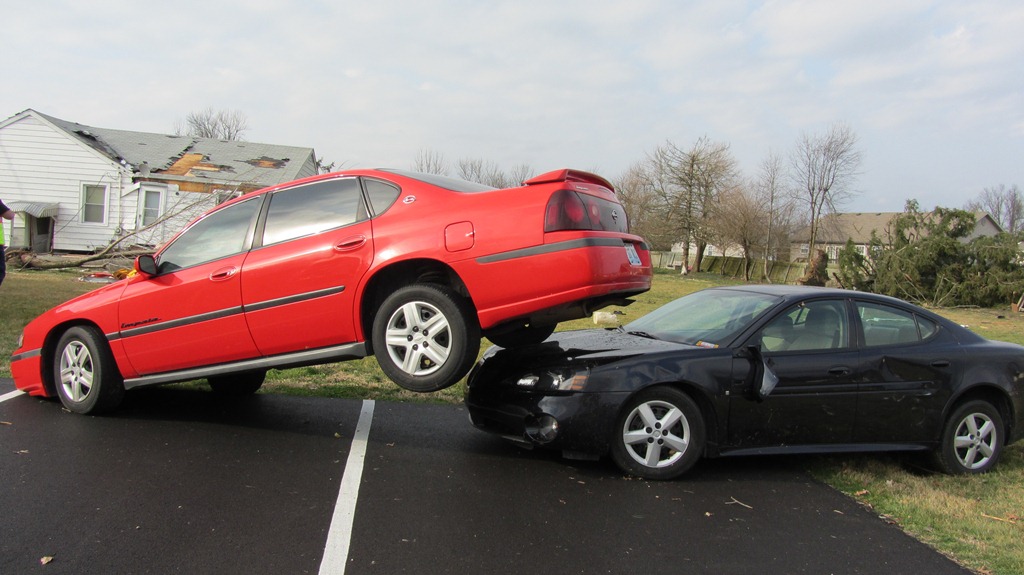
Hodgenville, Kentucky after an EF2 tornado on February 29, 2012. Photo: NWS
Note on the data presented here:
At Bowling Green and Frankfort data presented here may differ from data presented elsewhere. That is due primarily to "time shifting," which is when observers give their 24-hour reports at 7am. The high temperature, for example, may be given by the observer as 80 degrees on the 7am report on June 1, meaning that the 80 degree reading actually happened on the calendar day of May 31 (the previous afternoon). Unfortunately that high temperature may have gone into the climatological record as having happened on June 1, since that is the date of the report. Additionally, data may be time shifted for only a portion of a location's history.
An additional problem at Bowling Green is that there have been many observers over the years, occasionally simultaneously, and a difference can arise depending on which observer's data are used.
These issues are not present at Louisville and Lexington.
Current Hazards
Hazardous Weather Outlook
Storm Prediction Center
Submit a Storm Report
Advisory/Warning Criteria
Radar
Fort Knox
Evansville
Fort Campbell
Nashville
Jackson
Wilmington
Latest Forecasts
El Nino and La Nina
Climate Prediction
Central U.S. Weather Stories
1-Stop Winter Forecast
Aviation
IDSS Forecast Points
Air Quality
Fire Weather
Recreation Forecasts
1-Stop Drought
Event Ready
1-Stop Severe Forecast
Past Weather
Climate Graphs
1-Stop Climate
CoCoRaHS
Local Climate Pages
Tornado History
Past Derby/Oaks/Thunder Weather
Football Weather
Local Information
About the NWS
Forecast Discussion
Items of Interest
Spotter Training
Regional Weather Map
Decision Support Page
Text Products
Science and Technology
Outreach
LMK Warning Area
About Our Office
Station History
Hazardous Weather Outlook
Local Climate Page
Tornado Machine Plans
Weather Enterprise Resources
US Dept of Commerce
National Oceanic and Atmospheric Administration
National Weather Service
Louisville, KY
6201 Theiler Lane
Louisville, KY 40229-1476
502-969-8842
Comments? Questions? Please Contact Us.


 Weather Story
 Weather Map
 Local Radar