The incredible amounts of rainfall that inundated the region May 1-2, 2010 were a result of a complex weather setup. Below, you will find an image explaining how so much Gulf of America moisture was able to find its way into the Ohio Valley, and why it stayed for such a prolonged period of time. Many locations in south central Kentucky along the Tennessee border received 8 to 10 inches of rainfall from early Saturday morning (May 1) to late Sunday evening (May 2). The copious rain that fell caused widespread and dangerous impacts across the region, including flash flooding, areal flooding, mudslides, dam failure, road closures, evacuations, and swift water rescues. Almost all streams and rivers in southern Indiana and central Kentucky experienced some sort of flooding. Areas along the Green River in south central Kentucky attained "major flood" criteria, which had significant impacts on local communities. Dunham Lake Dam on the south fork of the Little Barren River in Metcalfe County was put at a high risk of failing due to flood waters eroding the barrier. The Dunham Lake Dam has since been stablized. Nearly the entire southern Indiana and central Kentucky warning area was put in a flood emergency Sunday and Sunday night.
Damage totalled about $30,000,000, and five people were killed in central Kentucky:
Strong high pressure anchored off the mid Atlantic coast helped to stall the frontal boundary over the mid Mississippi River Valley. This also tightened the pressure gradient between the two systems, which strengthened the near surface winds. A 60 to 70 mph low level jet of winds was able to quickly and efficiently transport the incredible amounts of moisture northward. Waves of low pressure at the surface, combined with waves of energy aloft, helped kick off showers and thunderstorms. With so much moisture to work with, the showers and thunderstorms produced incredible rainfall rates of 1 to 2 inches per hour in some spots!
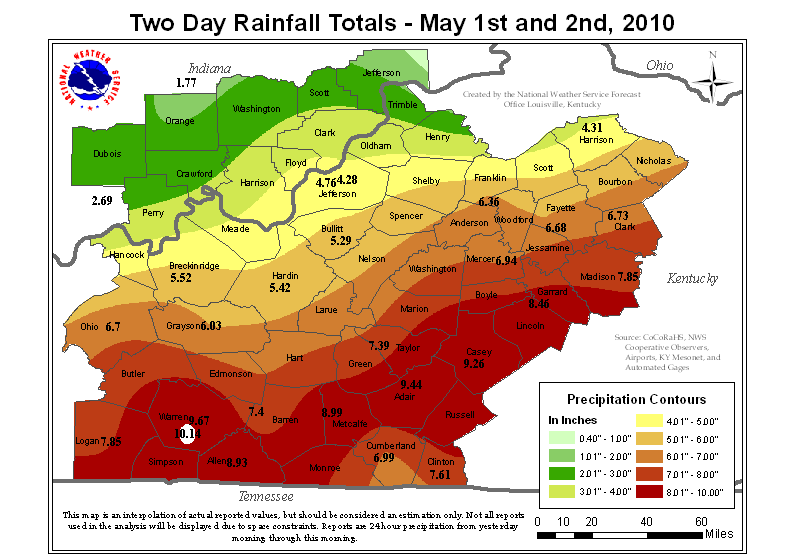
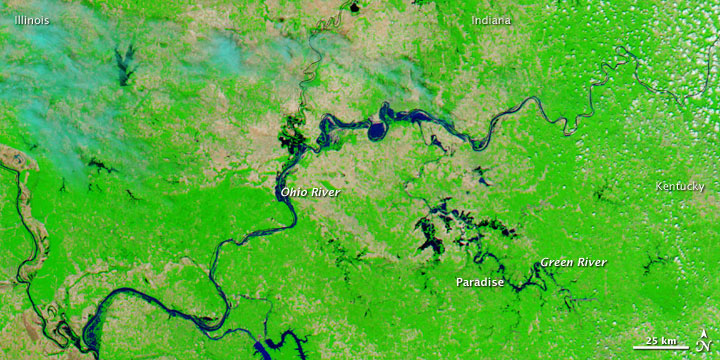
Above is an image of total rainfall received from early Saturday morning through late Sunday evening. Notice the large swath of 8 to 10 inches across south central Kentucky. Southern Warren county received just over 10 inches!
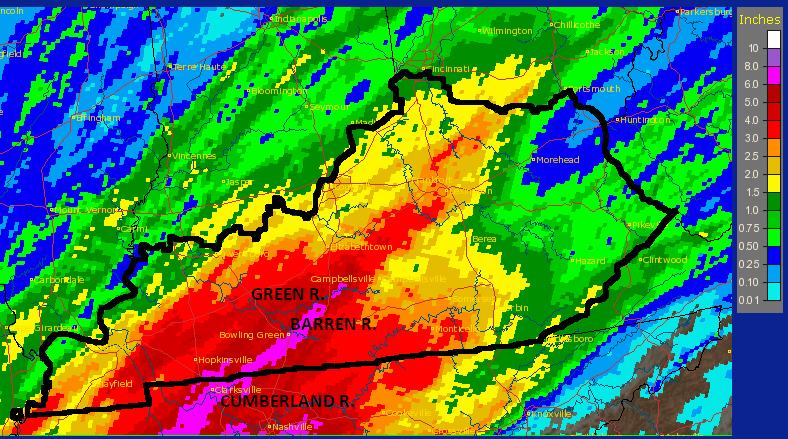
Below are precipitation maps from the 1st and 2nd of May:
MAY 1:
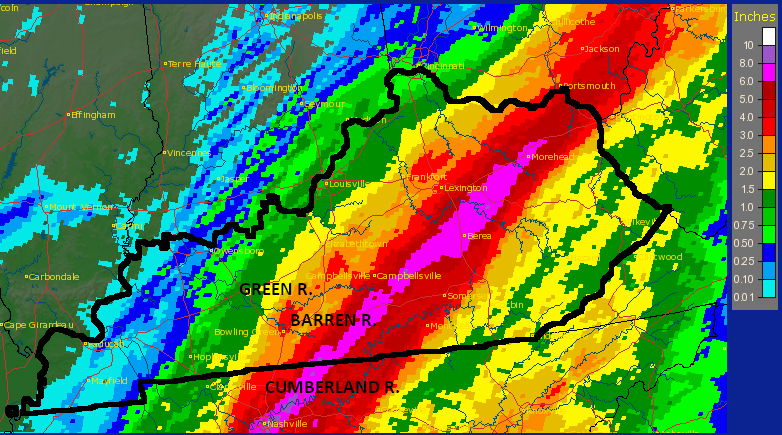
MAY 2:
Several locations set new records:
|
Location (County) |
2 day rainfall totals |
Rank |
All time 2 day total ending…. |
|
Bowling Green |
9.67 inches |
|
|
|
Lexington |
6.03 inches |
6th |
8.06 (August 2nd….1932) |
|
Louisville |
4.76 inches |
20th |
8.33 (March 1st….....1997) |
|
Marrowbone ( Cumberland) |
8.93 inches |
1st |
|
|
Bardstown (Nelson) |
6.11 inches |
2nd |
7.46 ( March 2nd…..1997) |
|
Bradfordsville (Marion) |
8.04 inches |
1st |
|
|
Richmond (Madison) |
8.50 inches |
1st |
|
|
Scottsville |
8.86 inches |
3rd |
10.58 ( June 24th….1969) |
|
Aberdeen (Butler) |
6.60 inches |
10th |
8.21 ( March 2nd..…1997) |
|
Madison Water Plant (Jefferson Co, In) |
7.29 inches |
1st |
|
|
Albany (Clinton) |
8.02 inches |
1st |
|
Flood crests:
| River/Location | Flood Stage | Crest/Date | Rank | Highest Since |
| Stoner Creek at Paris | 20 | 26.15 5/3 | 3rd | 1997 |
| S Fork Licking River at Cynthiana | 20 | 21.92 5/4 | 9th | 1997 |
| Licking River at Blue Licks Springs | 25 | 40.95 5/5 | 6th | 1997 |
| Kentucky River at Ford | 26 | 32.30 5/3 | 10th | 2003 |
| Kentucky River at High Bridge | 30 | 42.6 5/3 | 3rd | 1978 |
| Kentucky River at Frankfort | 31 | 42.84 5/3 | 5th | 1997 |
| Rolling Fork River at Boston | 35 | 50.74 5/5 | 6th | 1997 |
| Rough River at Dundee | 25 | 28.72 5/3 | 14th | 2008 |
| Barren River at Bowling Green | 28 | 43.69 5/3 | 5th | 1962 |
| Green River at Munfordville | 28 | 51.88 5/4 | 5th | 1984 |
| Green River at Brownsville | 18 | 37.50 5/5 | 5th | 1984 |
| Green River at Woodbury | 33 | 49.52 5/5 | 6th | 1984 |
| Green River at Rochester | 17 | 28.6 5/7 | 9th | 1997 |
BEFORE:
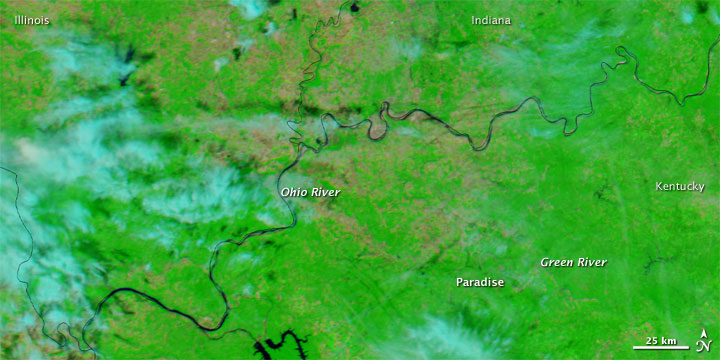
AFTER:


 Weather Story
 Weather Map
 Local Radar