Portions of these pages may not be routinely updated when there is no drought in southern Indiana or central Kentucky |
|||||||||||||||||||||||||||||||||||||||||
| Local Drought Information Statement | |||||||||||||||||||||||||||||||||||||||||
|
U.S. Drought Monitor: The data cutoff for Drought Monitor maps is Tuesday at 8 a.m. Eastern.
Risk of Rapid Drought Intensification (Experimental) Palmer Drought Severity Index:
Standardized Precipitation Index:
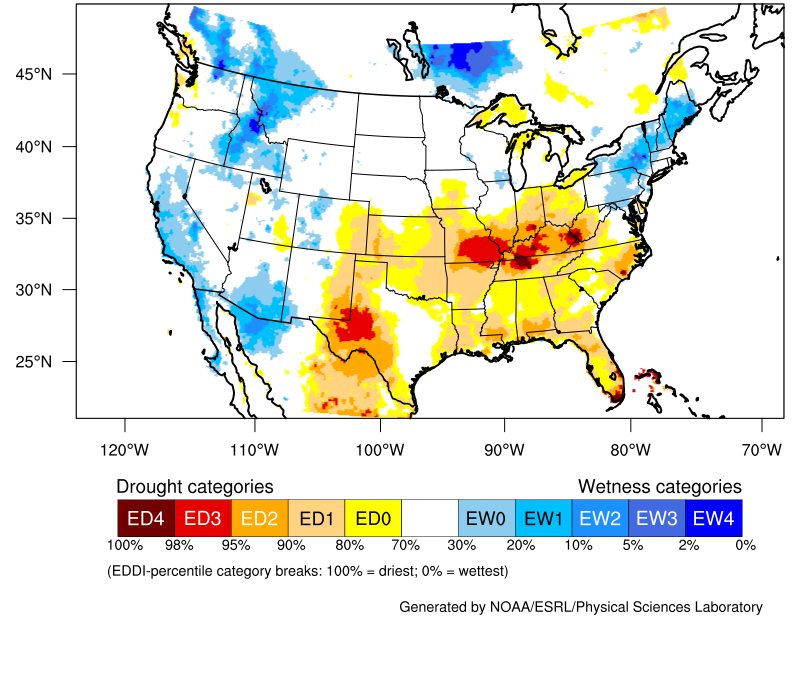
Landscape Evaporative Response Index
U.S. Monthly Drought Outlook National, State and Local Actions: Drought Condition Monitoring Observations and Reports Precipitation:
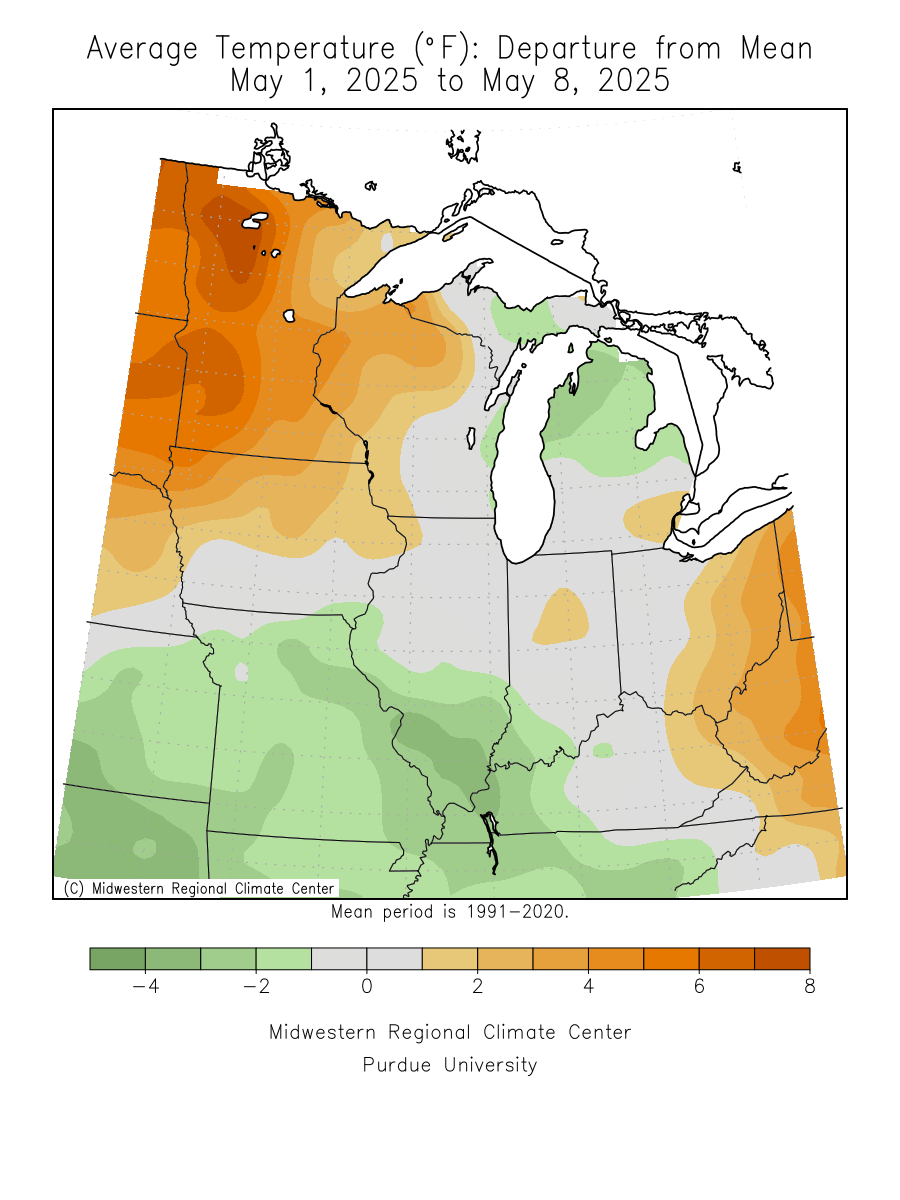
Temperature:
|
The U.S. Drought Monitor is a weekly collaborative effort between a number of federal agencies including NOAA/NWS, U.S. Department of Agriculture and the National Drought Mitigation Center. Details and explanations of the Drought Monitor can found at the web site: https://droughtmonitor.unl.edu/ The categories of drought are defined as follows: Moderate Drought (D1) - Some damage to crops, pastures; fire risk high; streams, reservoirs, or wells low, some water shortages developing or imminent, voluntary water use restrictions requested. Severe Drought (D2) - Crop or pasture losses likely; fire risk very high; water shortages common; water restrictions imposed. Extreme Drought (D3) - Major crop/pasture losses; extreme fire danger; widespread water shortages or restrictions. Exceptional Drought (D4) - Exceptional and widespread crop/pasture losses; exceptional fire risk; shortages of water in reservoirs, streams, and wells, creating water emergencies. State of the Science Drought Fact Sheet Disaster & Drought Assistance: Drought ACIS: Drought ACIS allows you the ability to explore data related to drought from the Regional Climate Centers (RCCs). You can look at length or periods without rain, temperature data, and more. Click on the logo below to gain access to this tool. Kentucky Drought Mitigation and Response Plan Indiana Drought Conditions & Impacts
|
||||||||||||||||||||||||||||||||||||||||
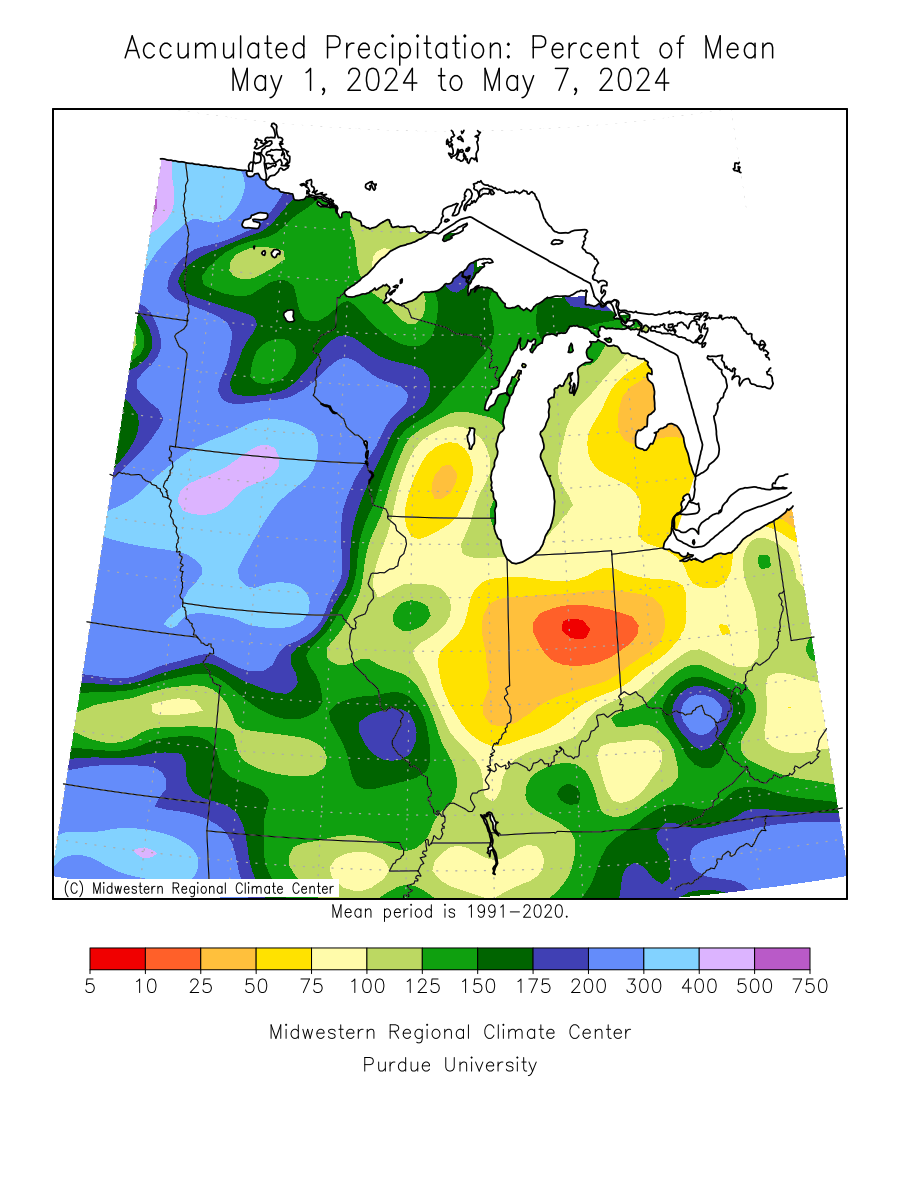
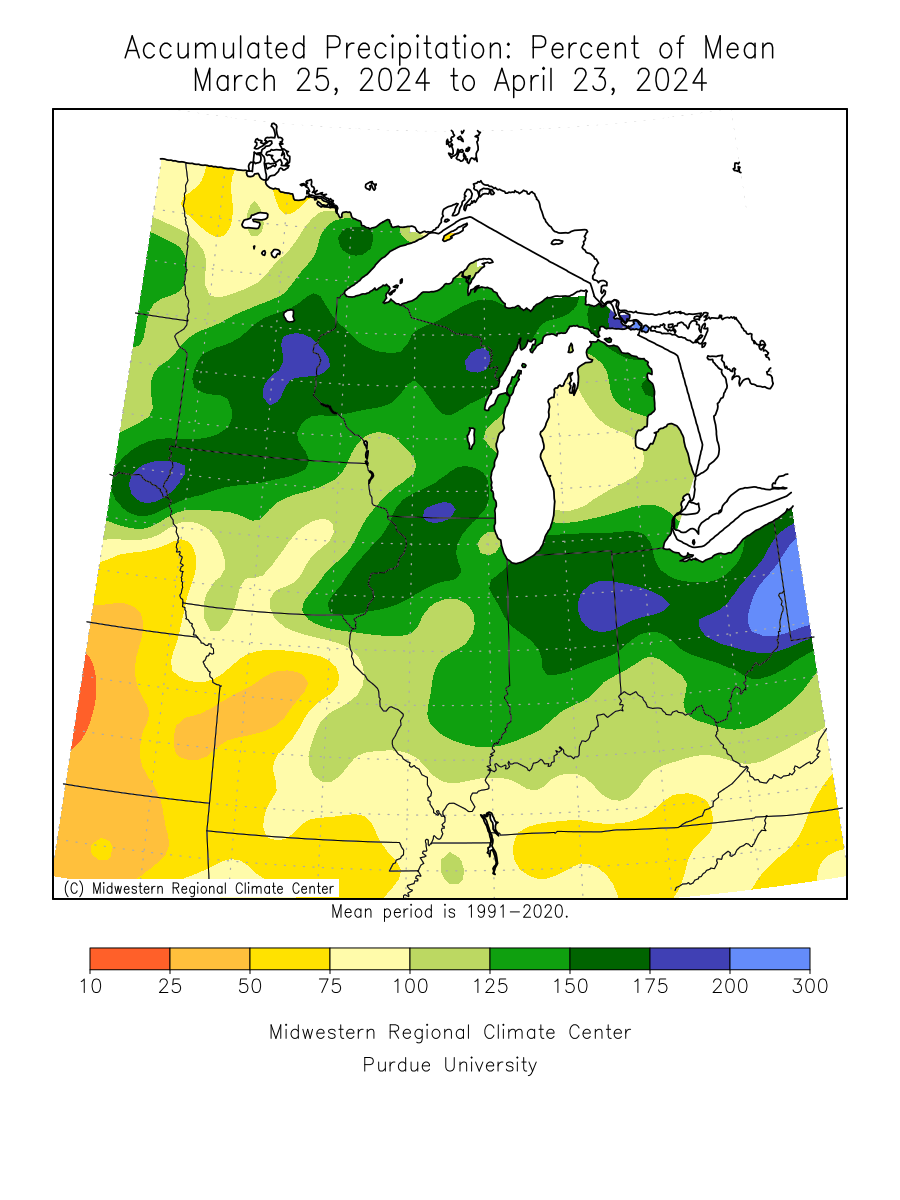
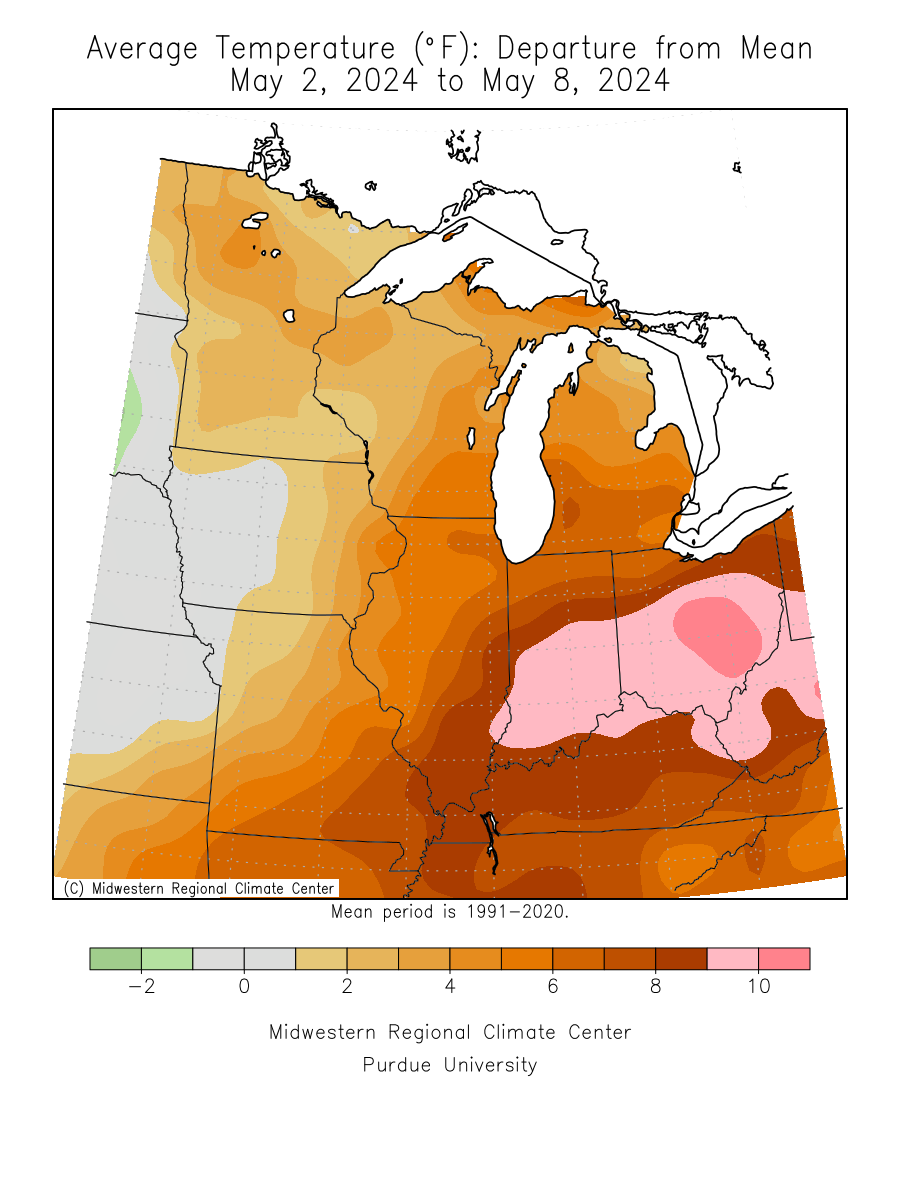
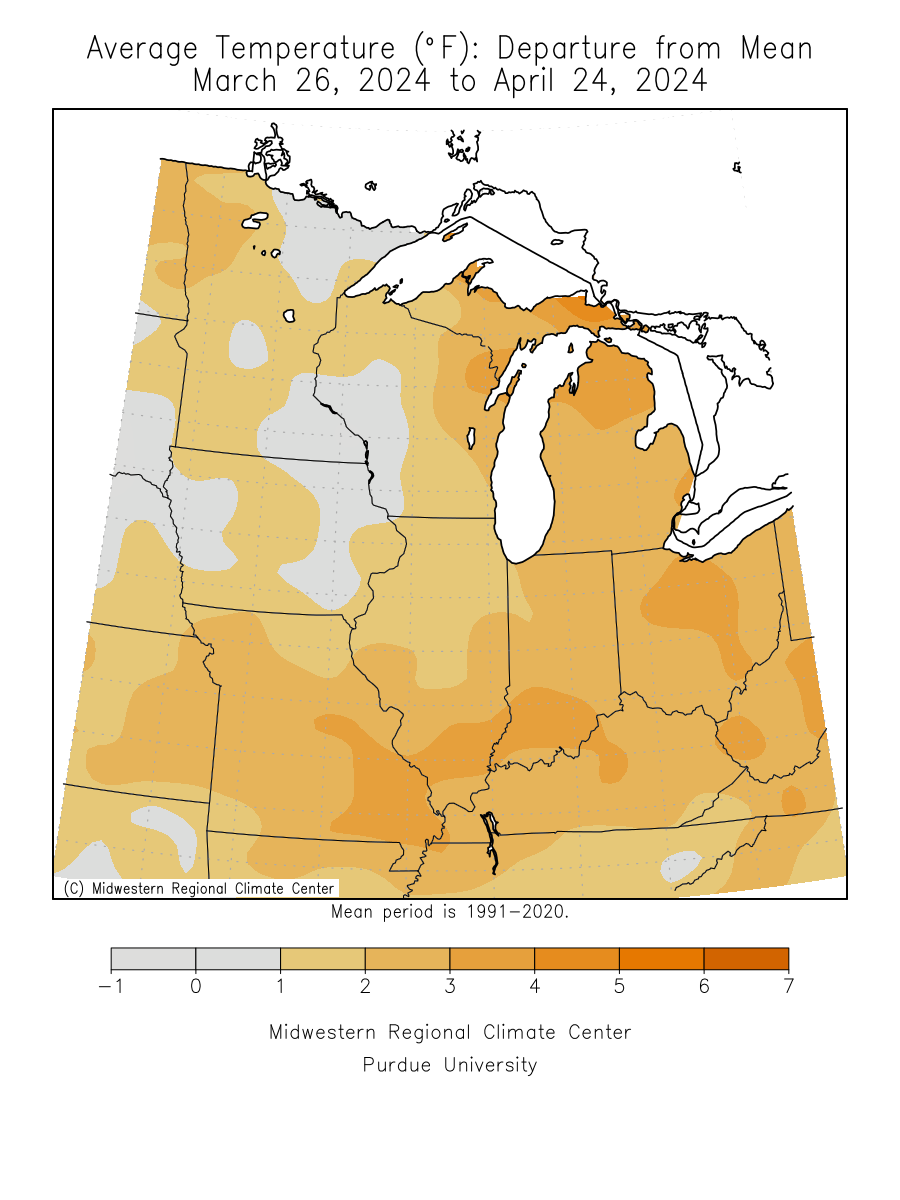
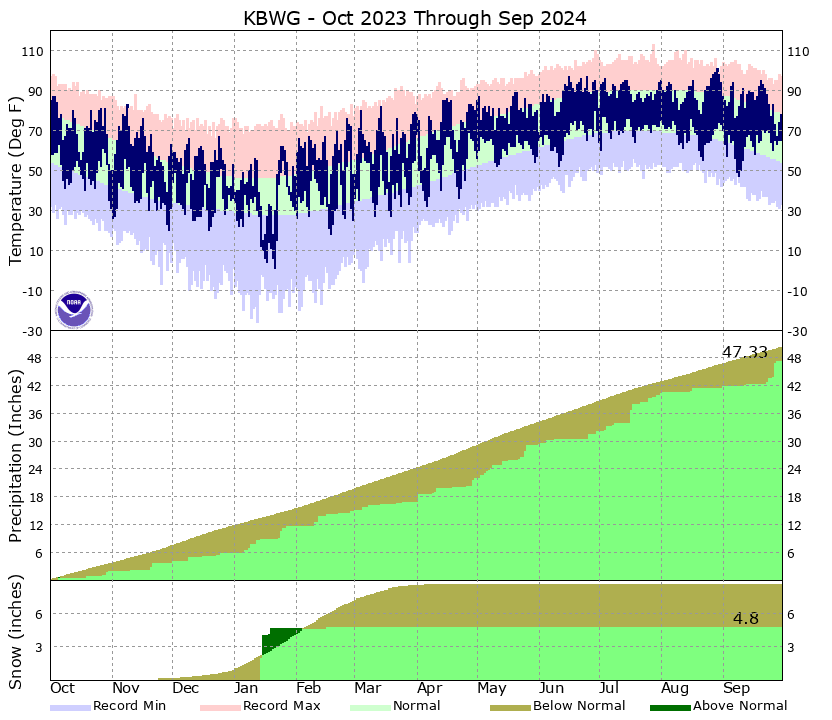
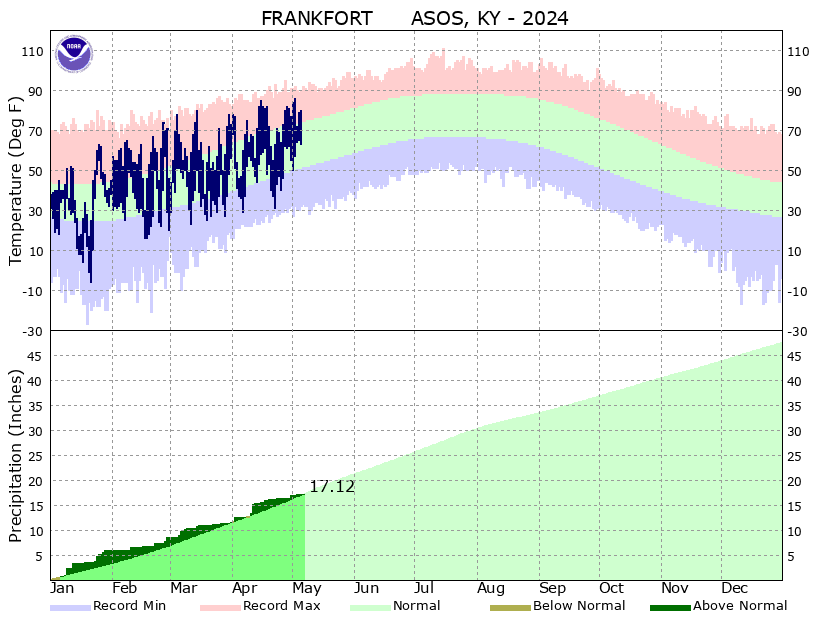
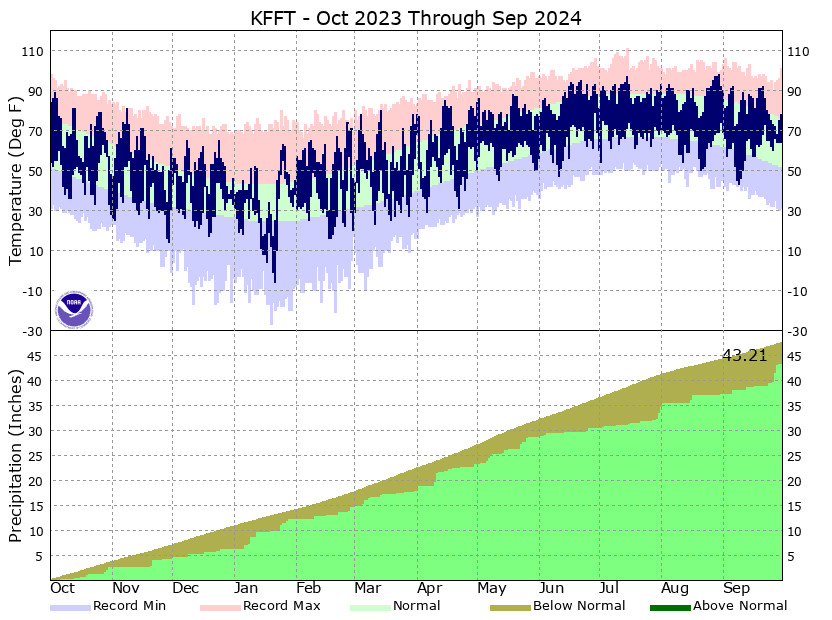
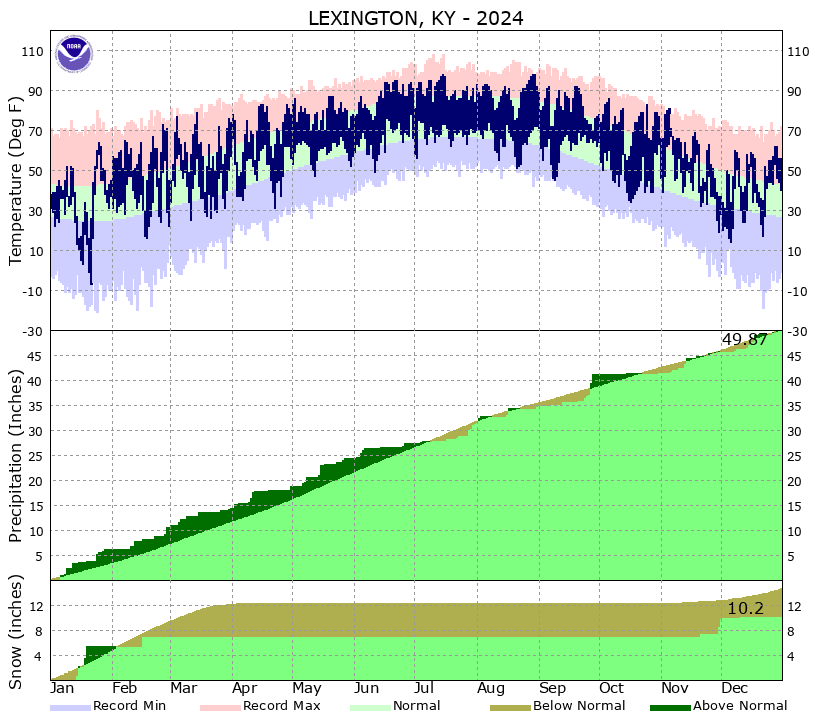
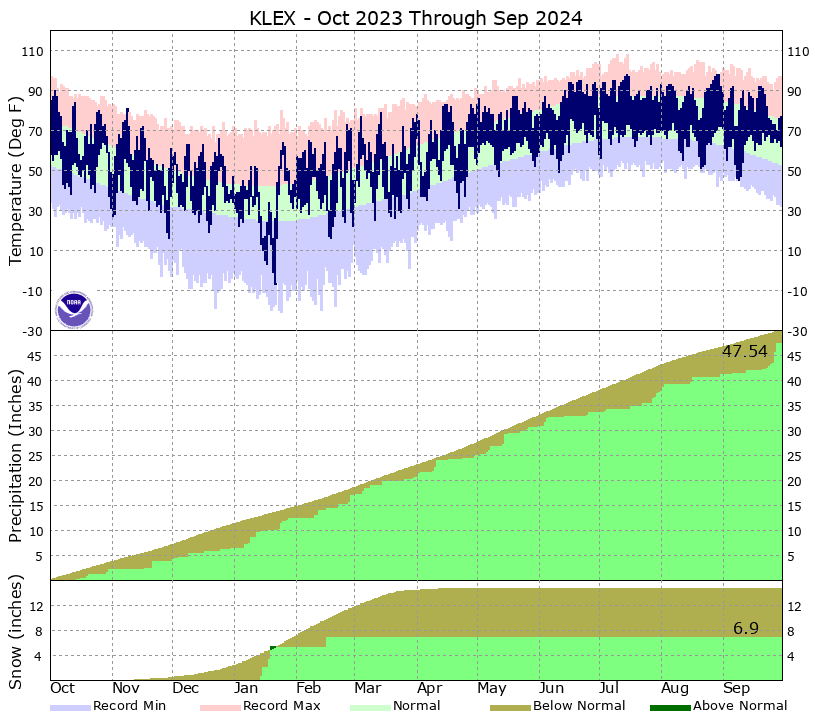
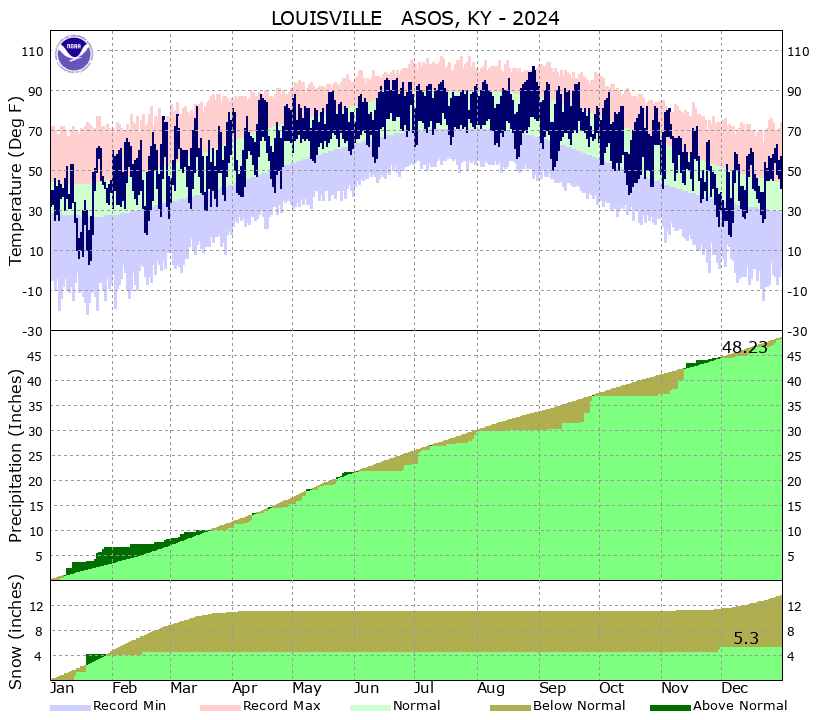
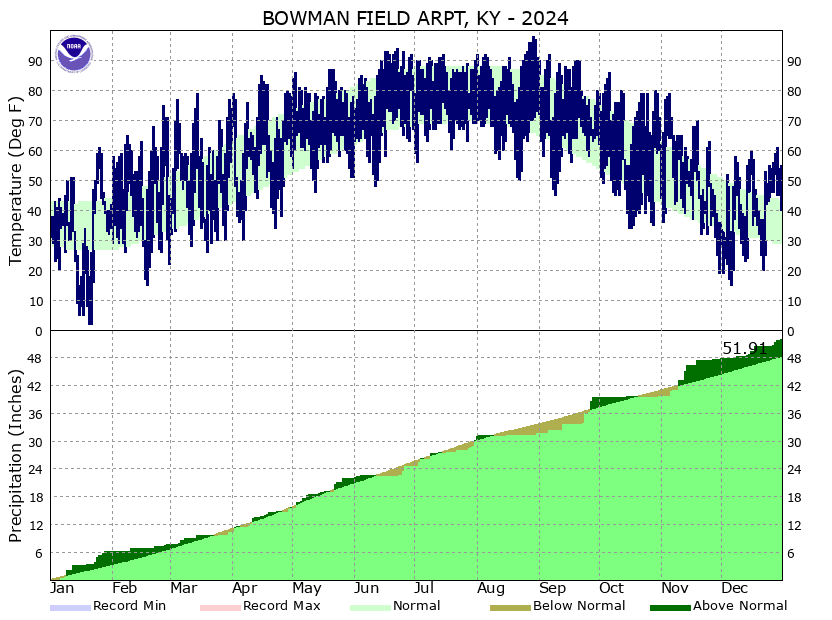
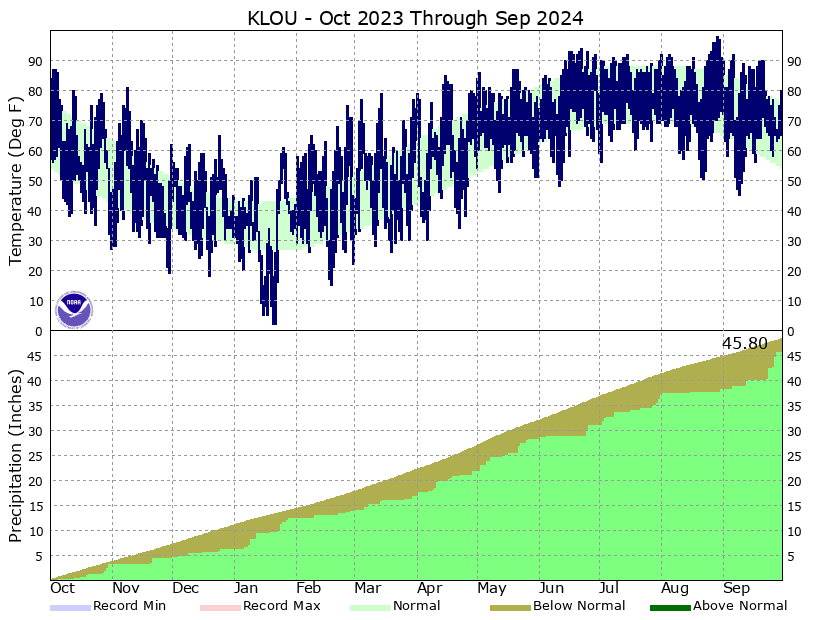
| Plots of Temperatures and Precipitation: | |||||||||||||||||||||||||||||||||||||||||
|
|||||||||||||||||||||||||||||||||||||||||
Jump to:
|
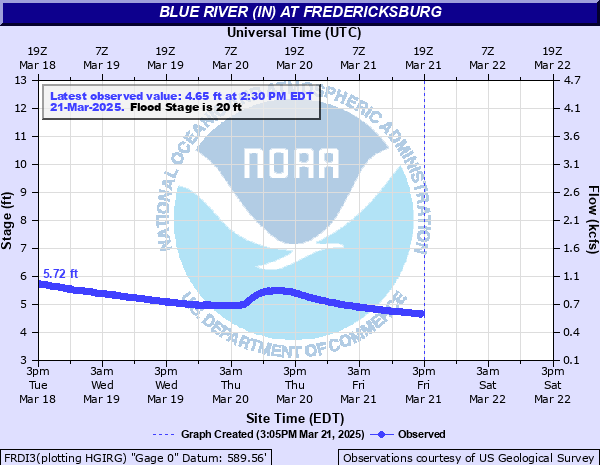
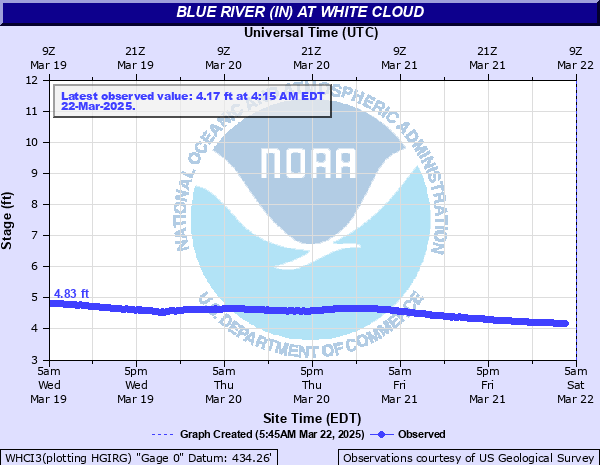
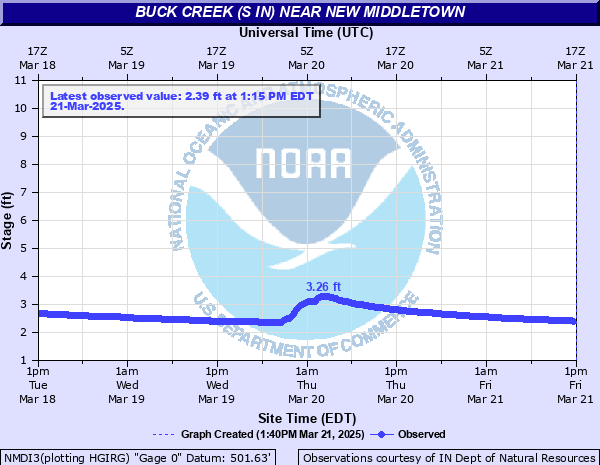
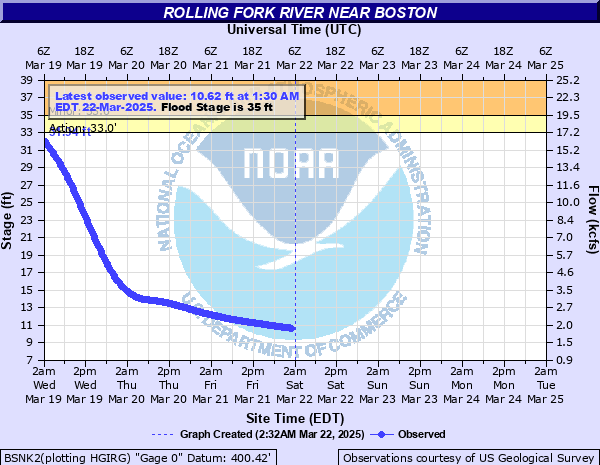
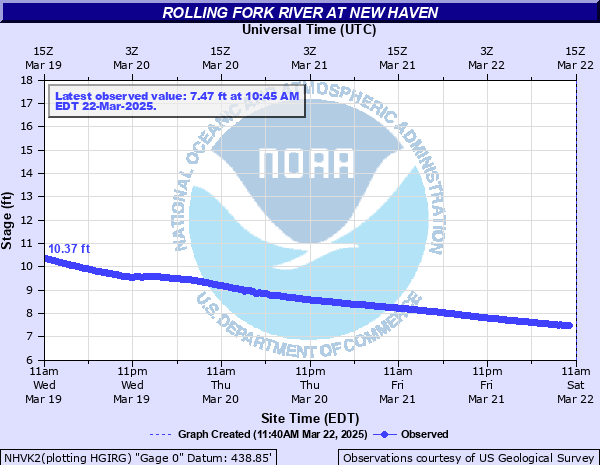
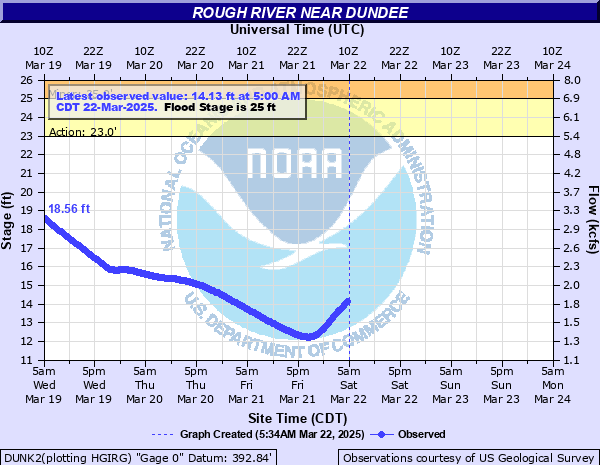
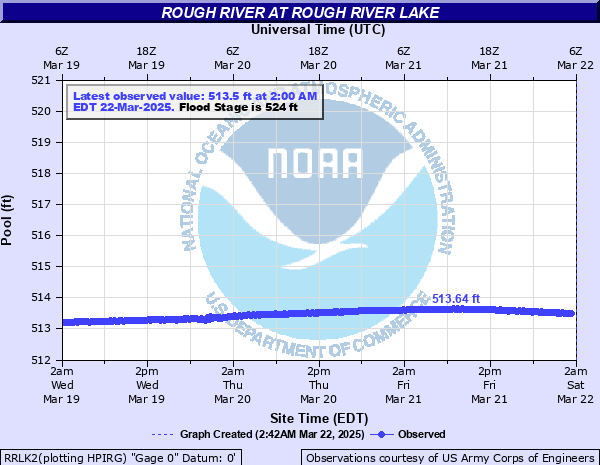
Central Southern Indiana (NWS Louisville) |
 |
Tip: Use CTRL-F and enter a search term to find something quickly. For example, if you're interested in the Ohio River at Ashland, hit CTRL-F and in the box that pops up type Ashland. Note that there may be more than one match (like if you enter the search term Ohio), in which case you can hit the enter key to go through all the matches.
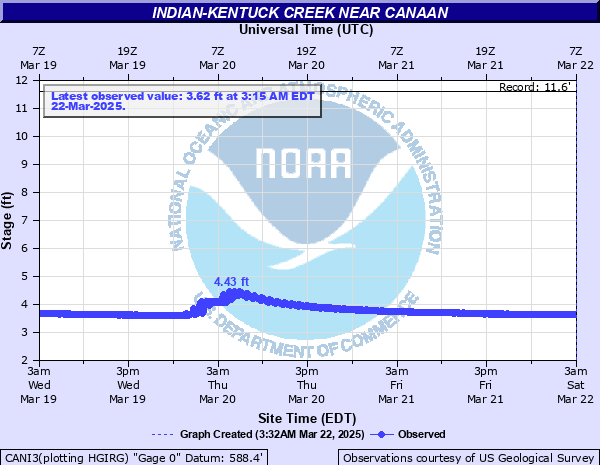
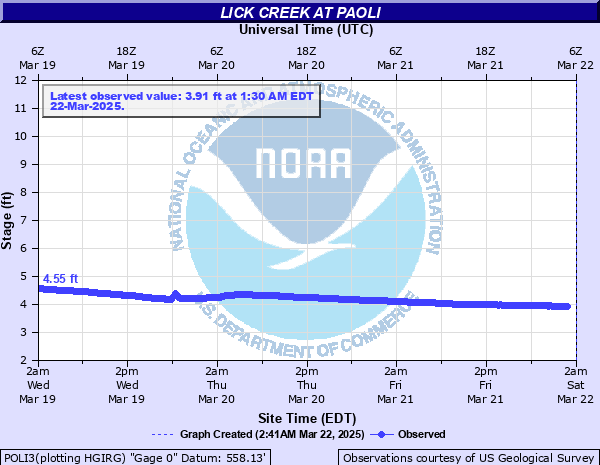
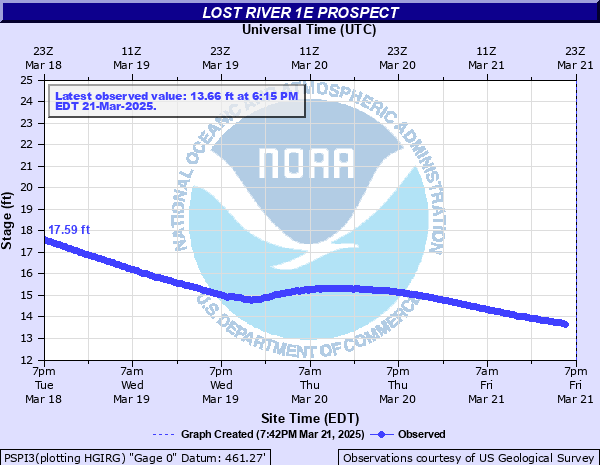
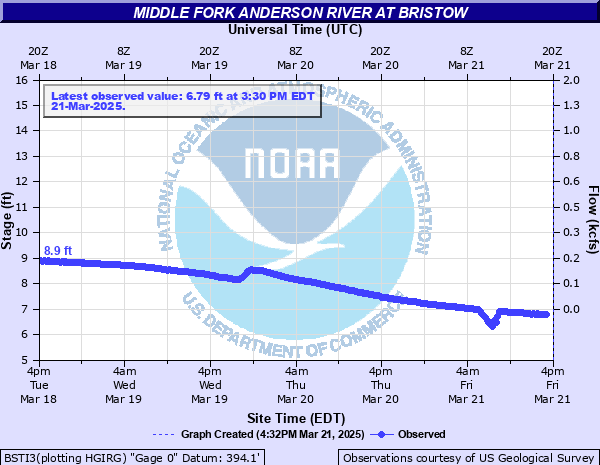
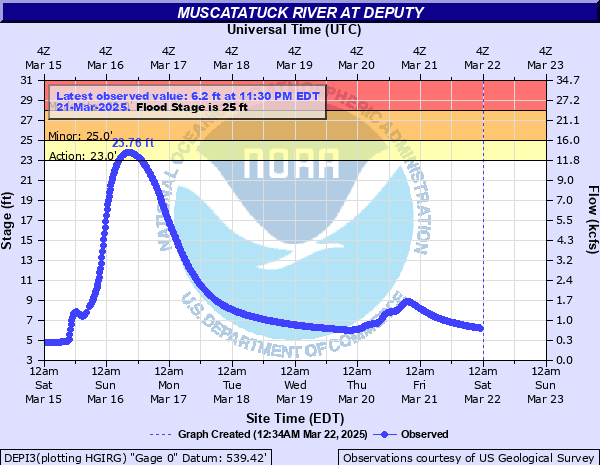
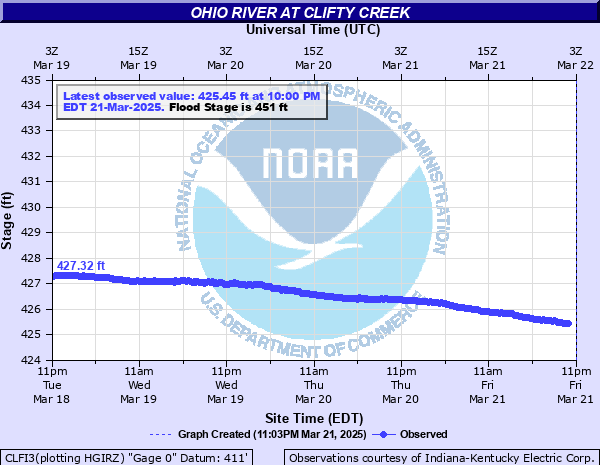
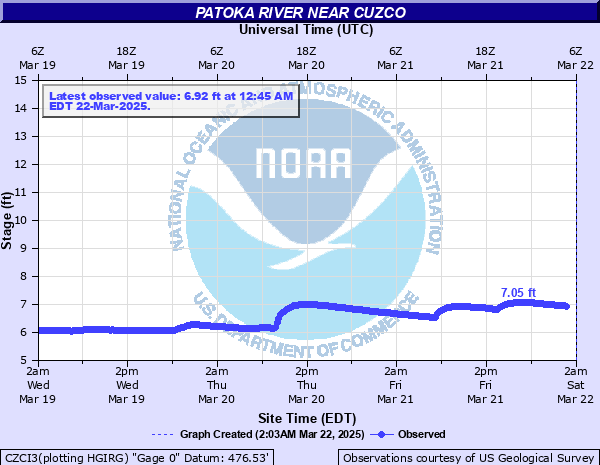
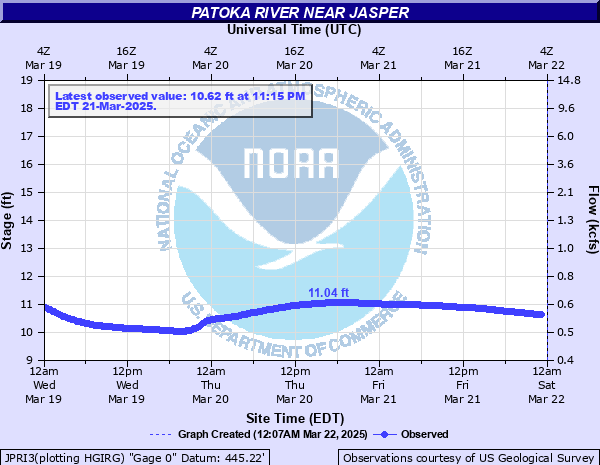
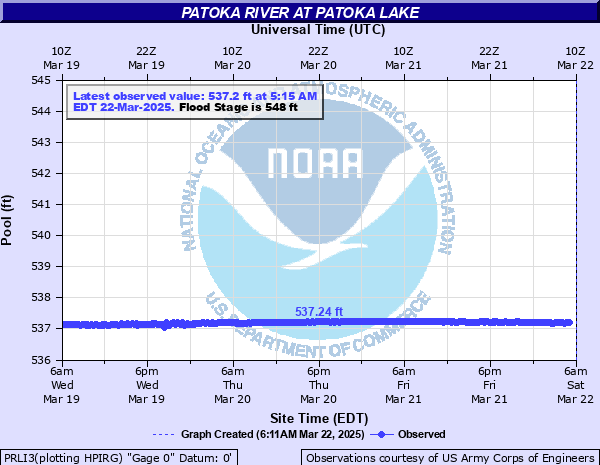
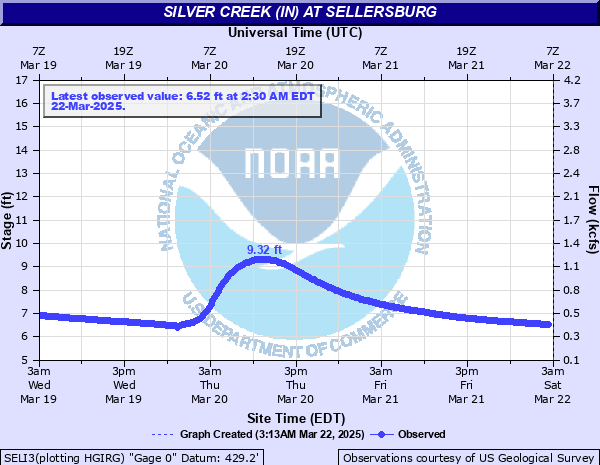
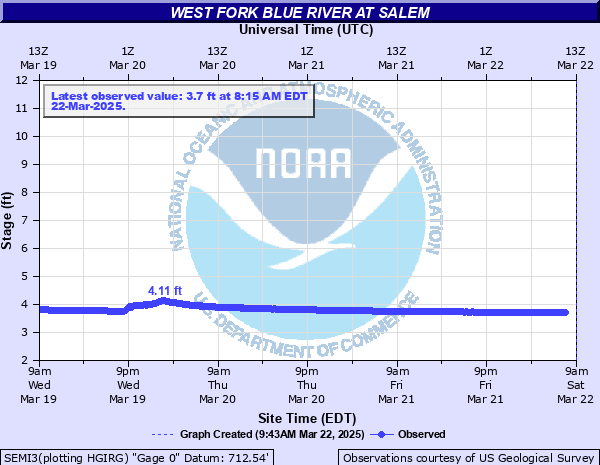
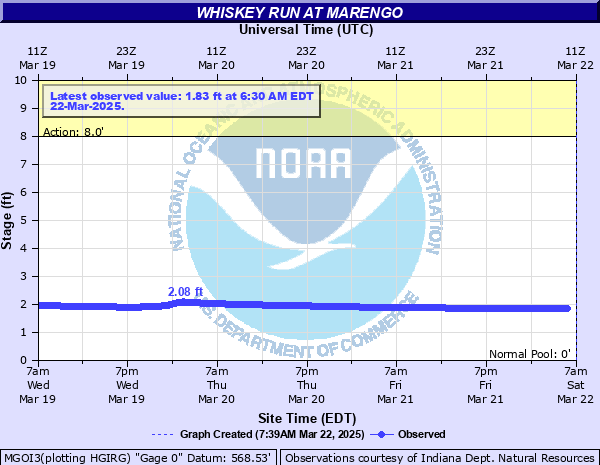
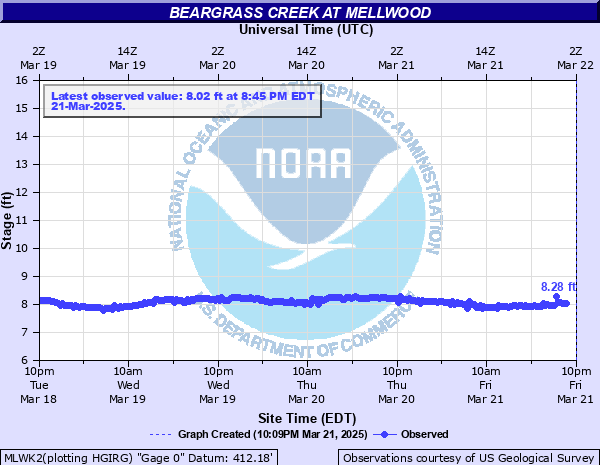
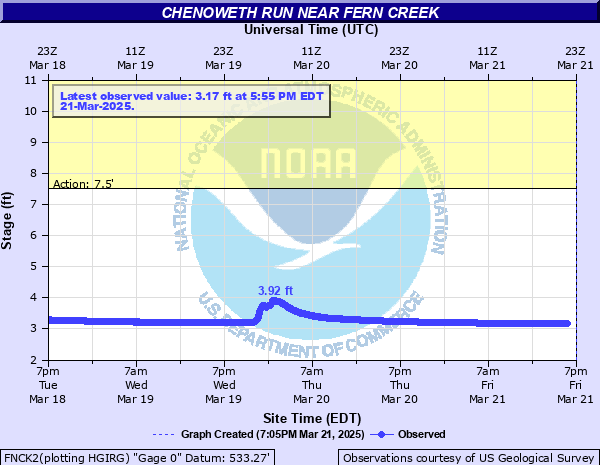
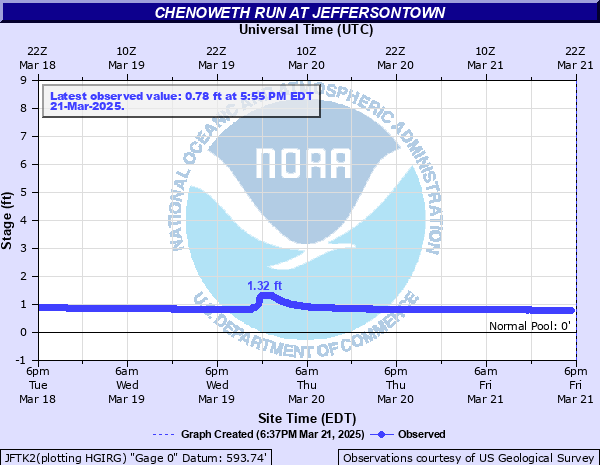
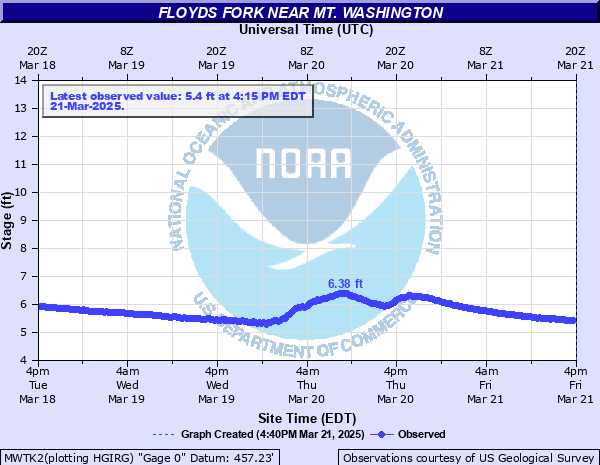
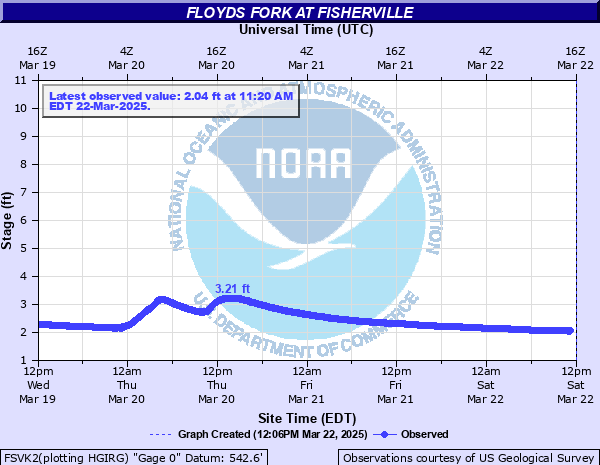
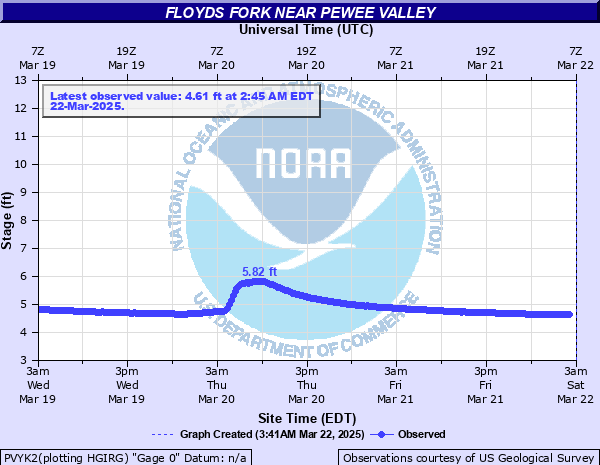
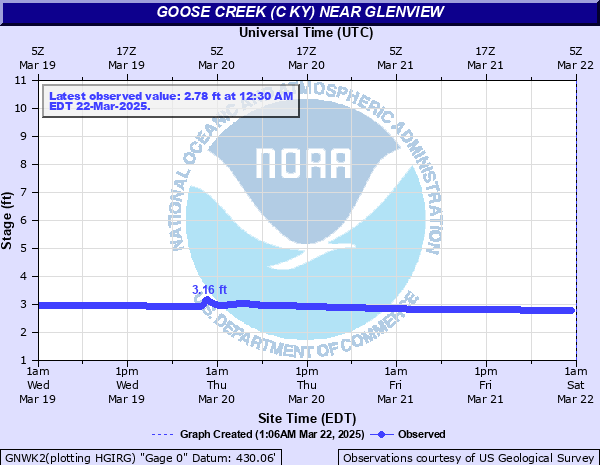
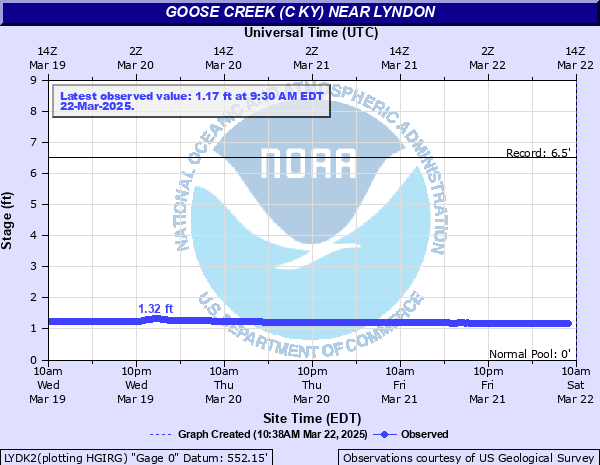
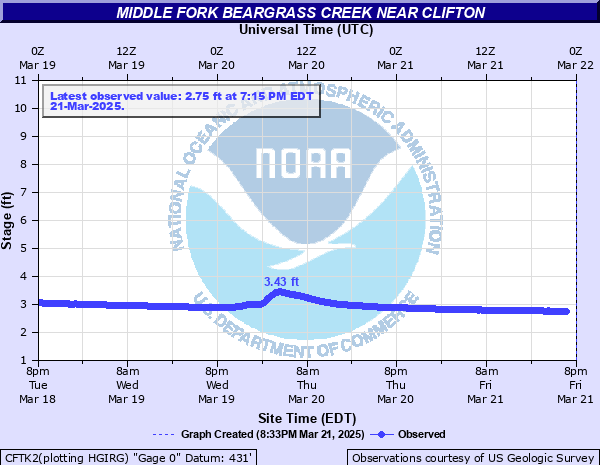
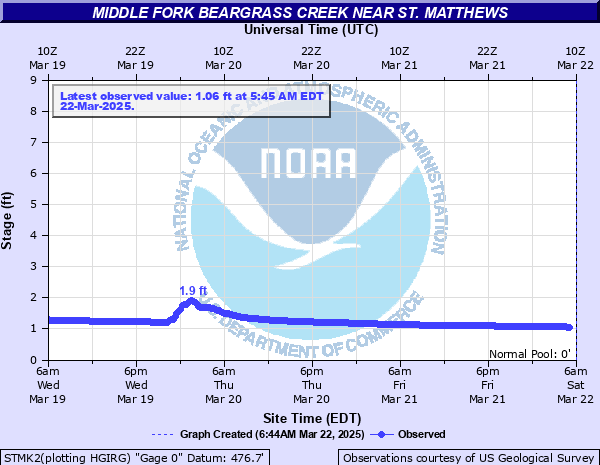
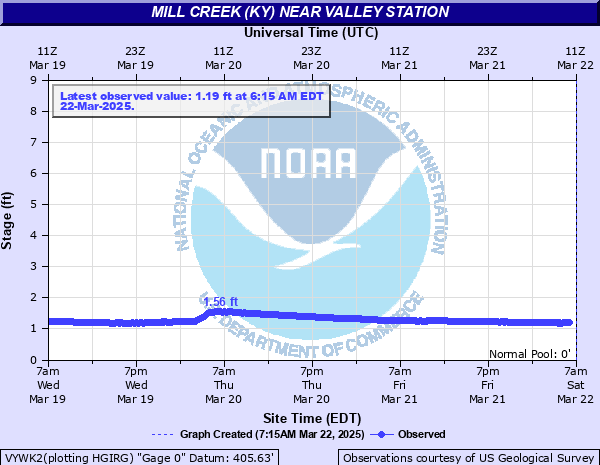
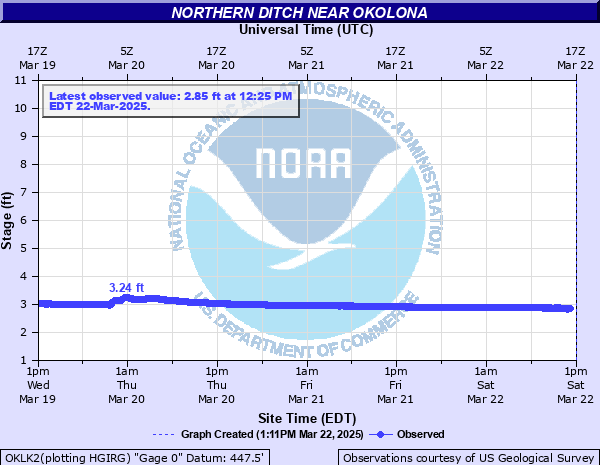
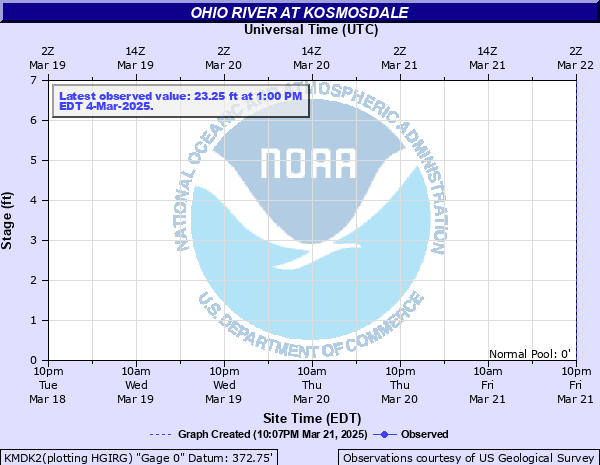
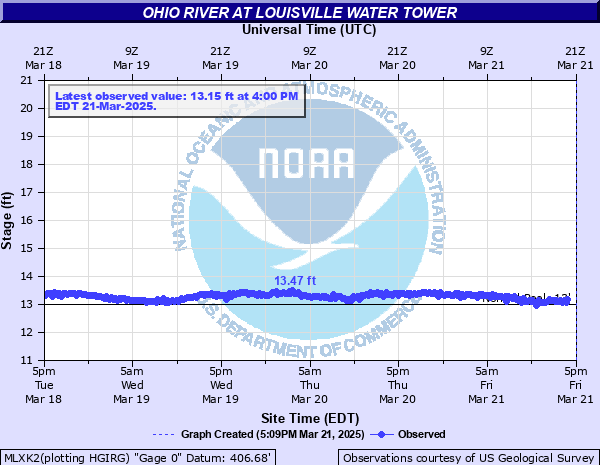
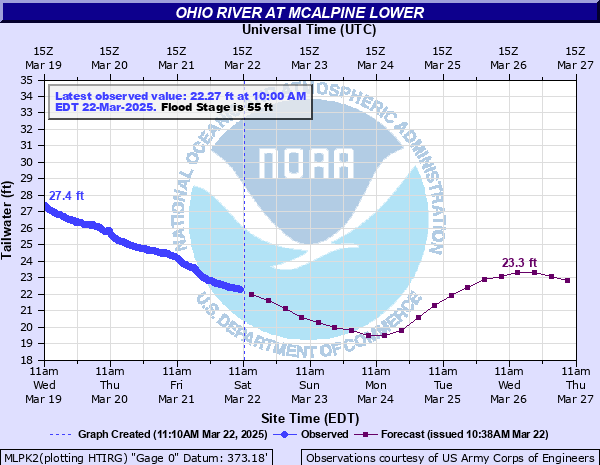
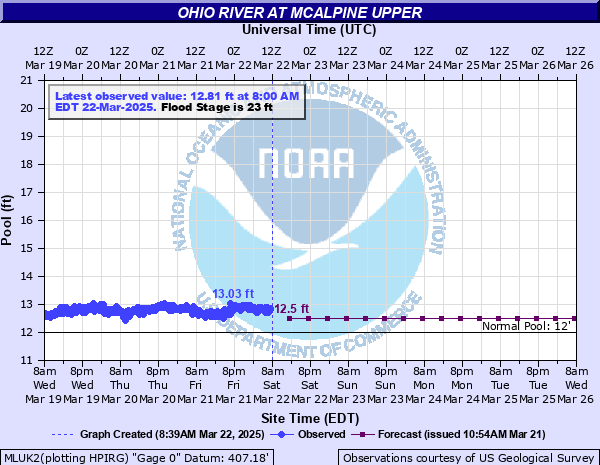
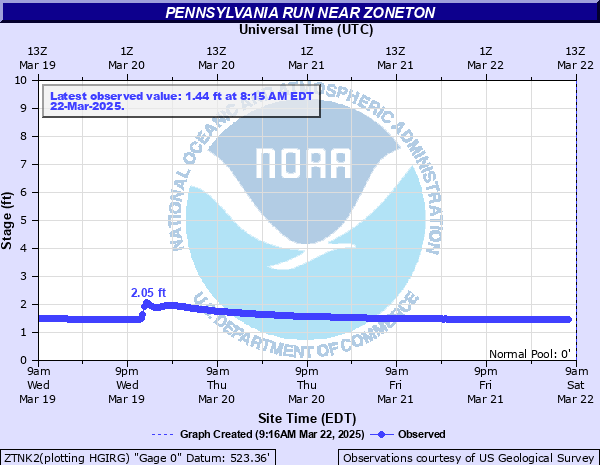
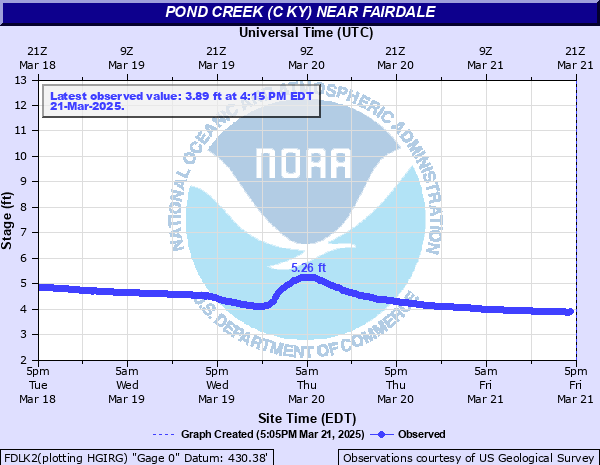
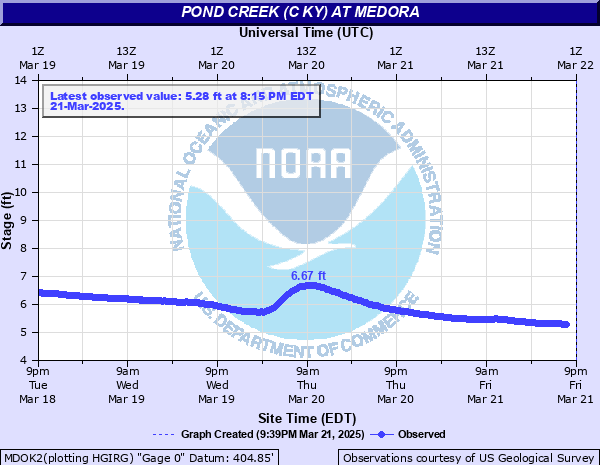
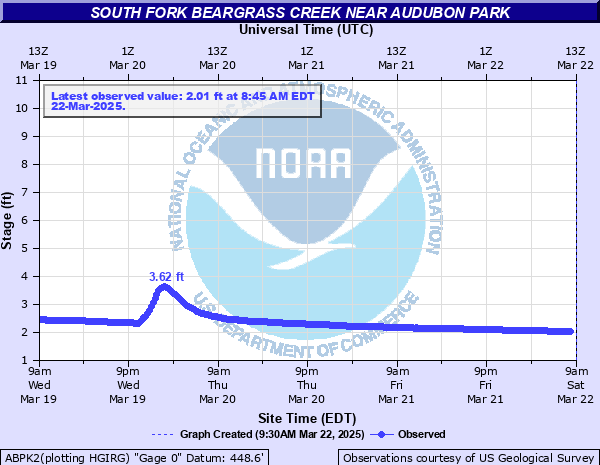
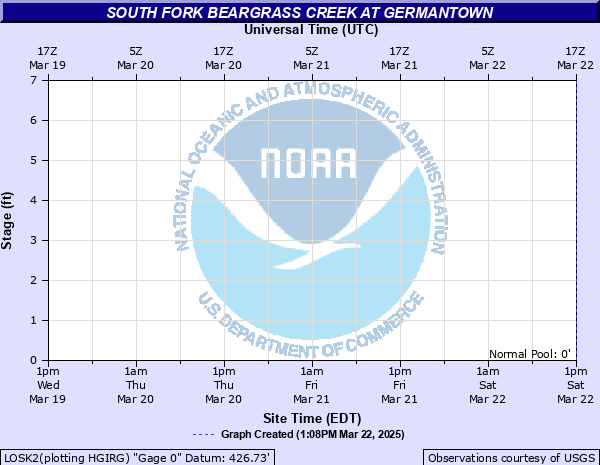
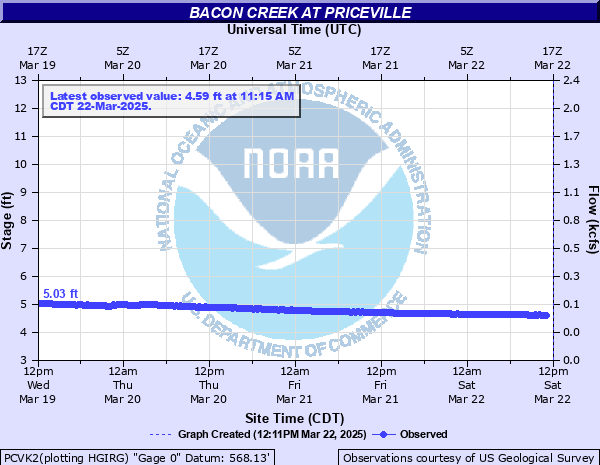
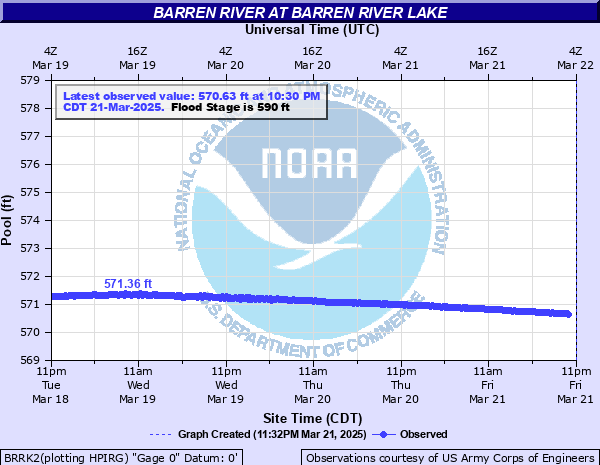
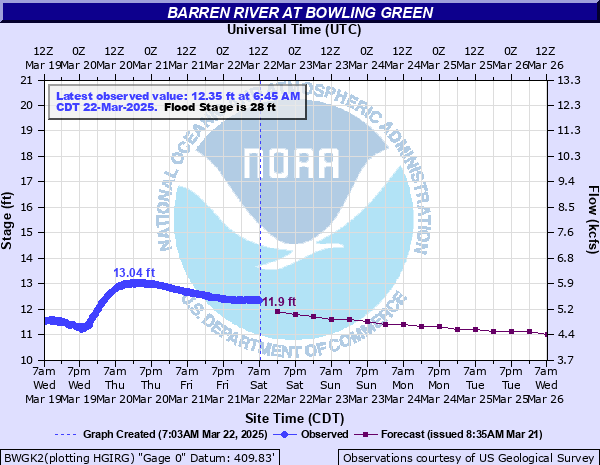
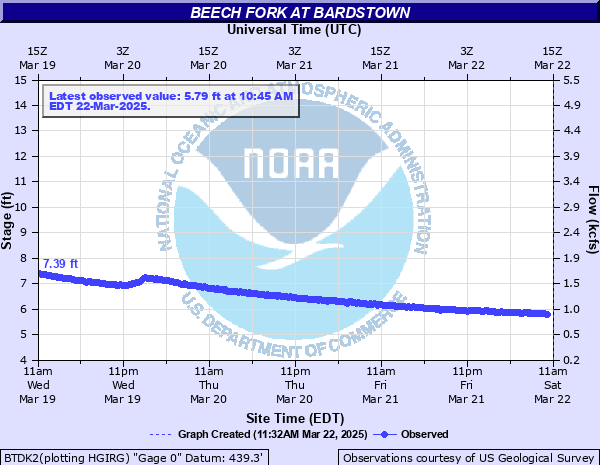
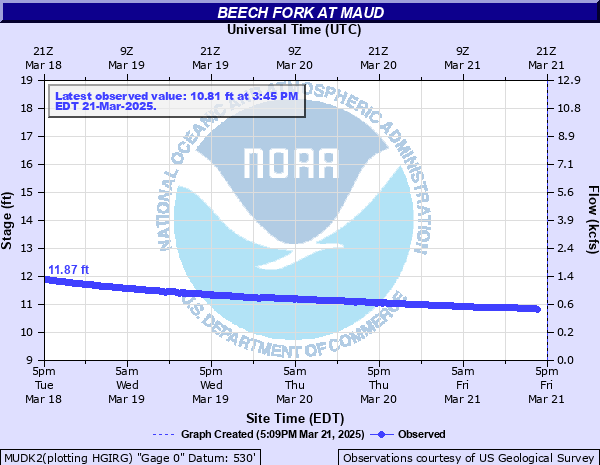
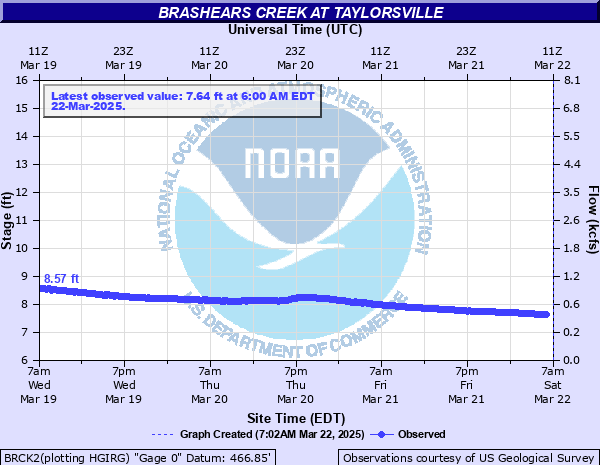
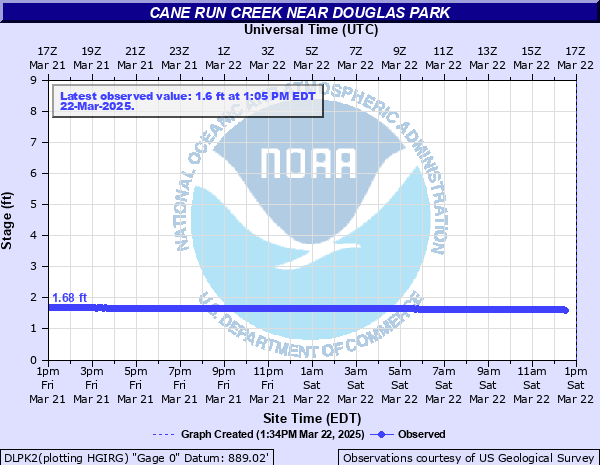
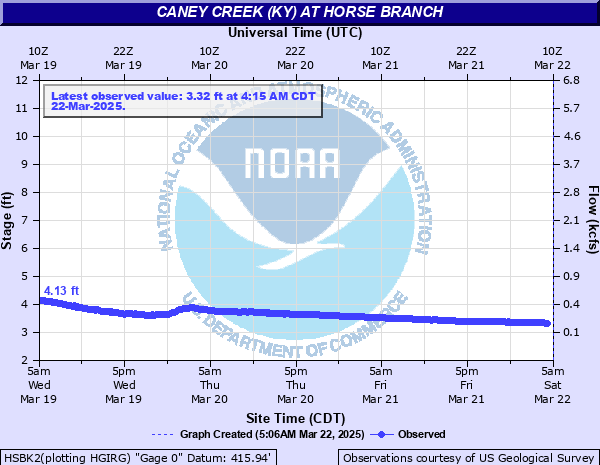
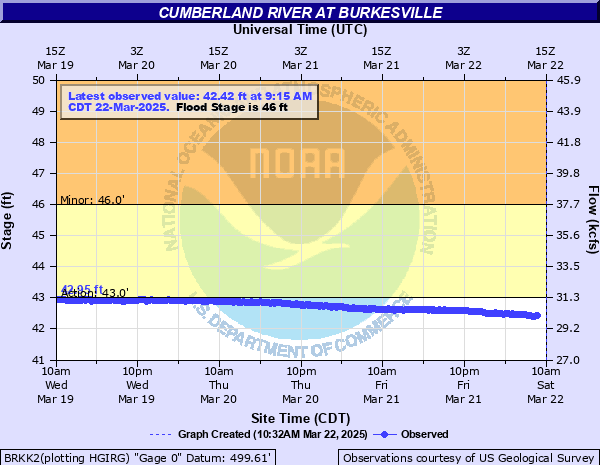
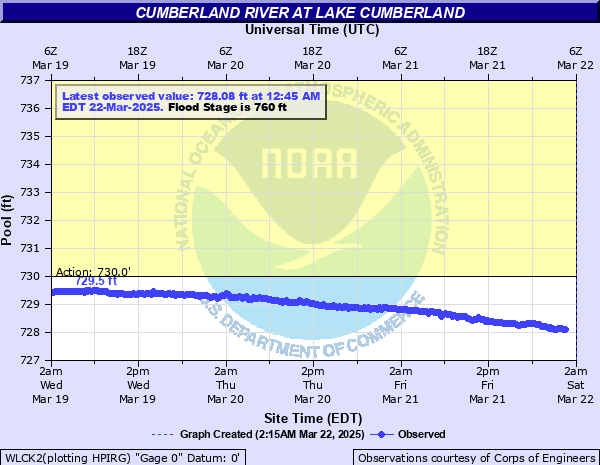
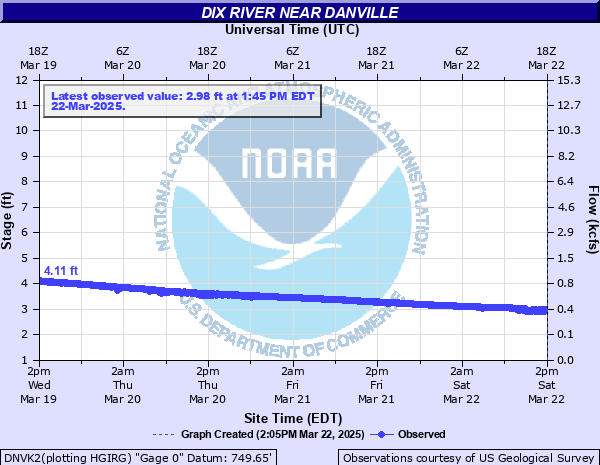
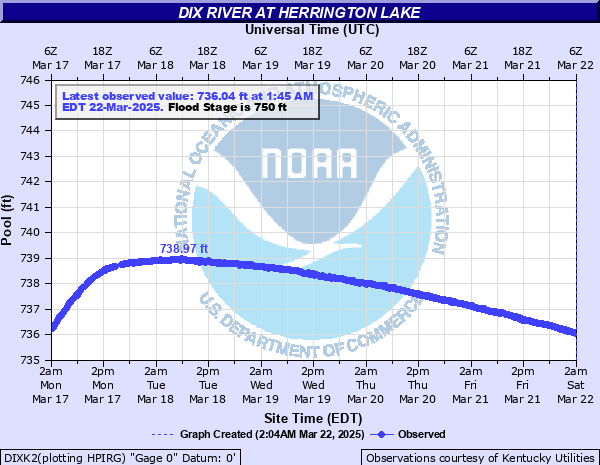
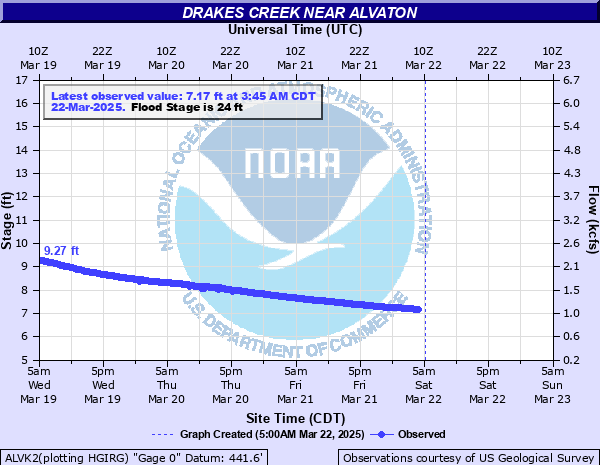
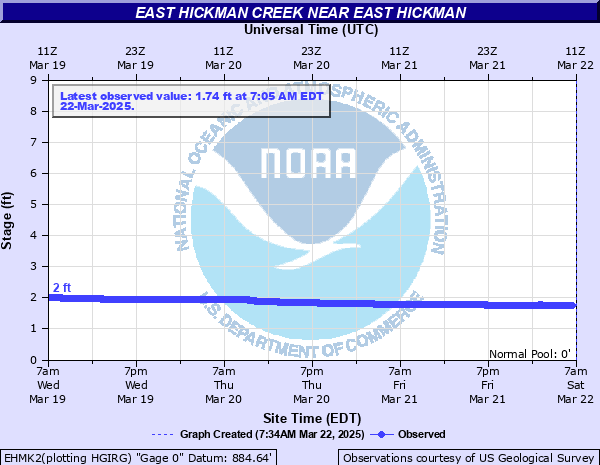
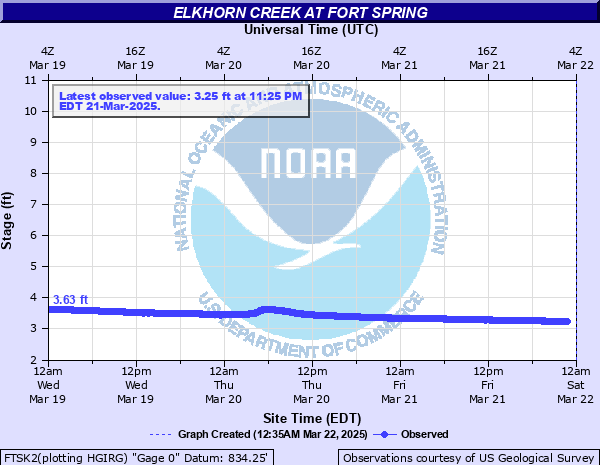
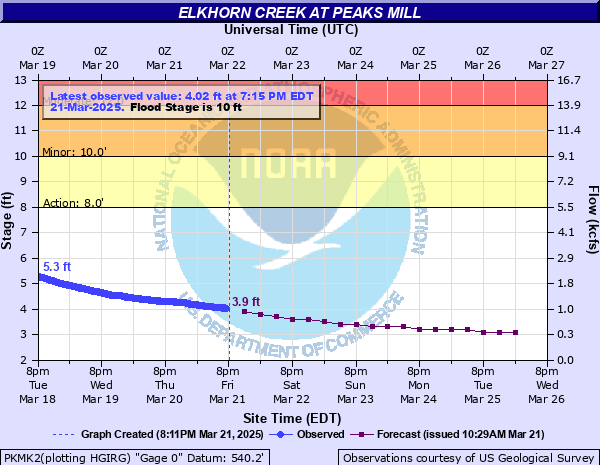
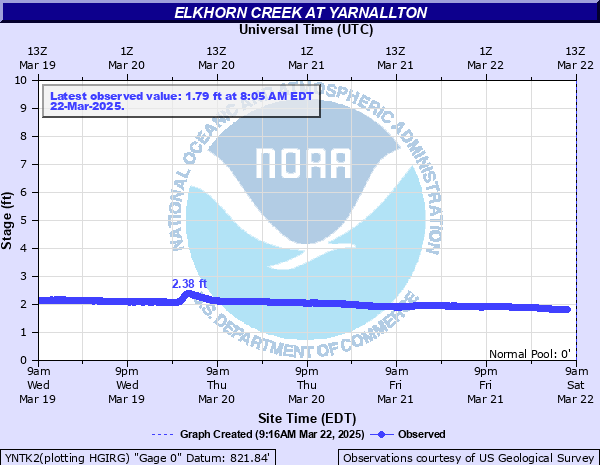
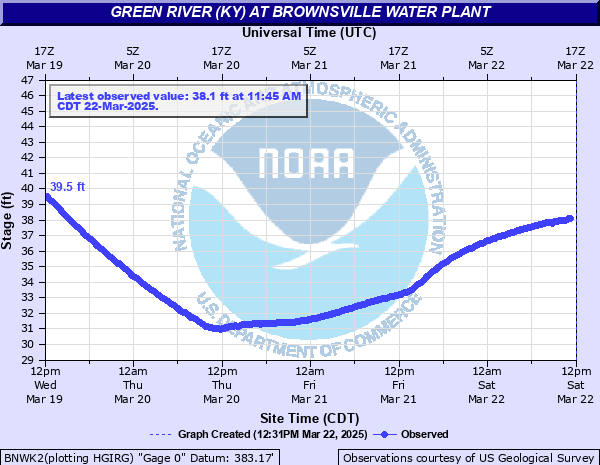
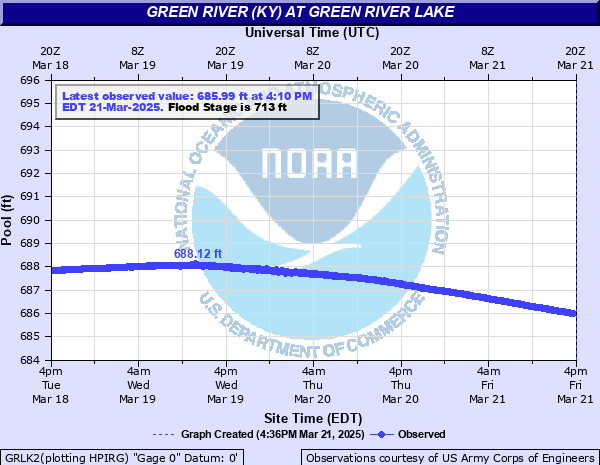
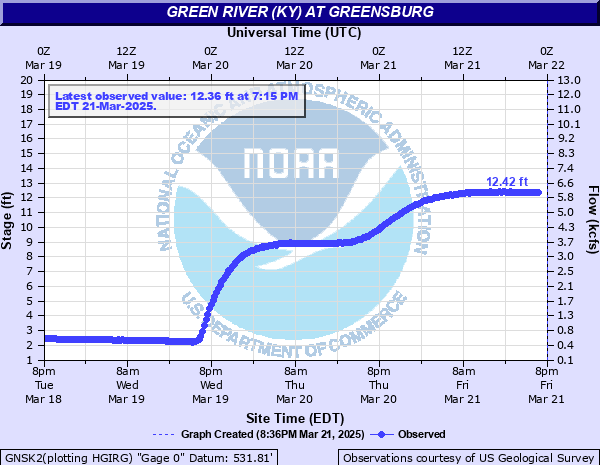
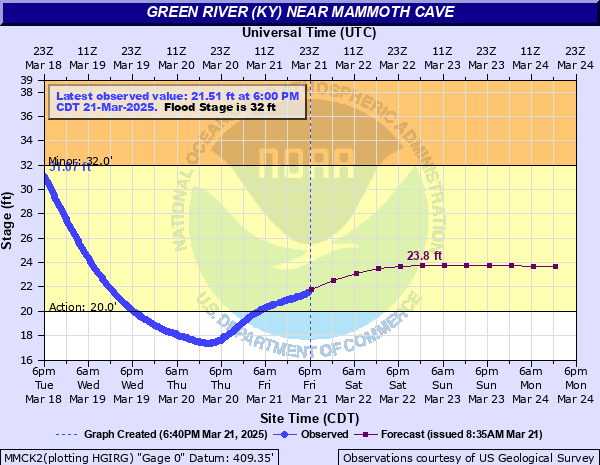
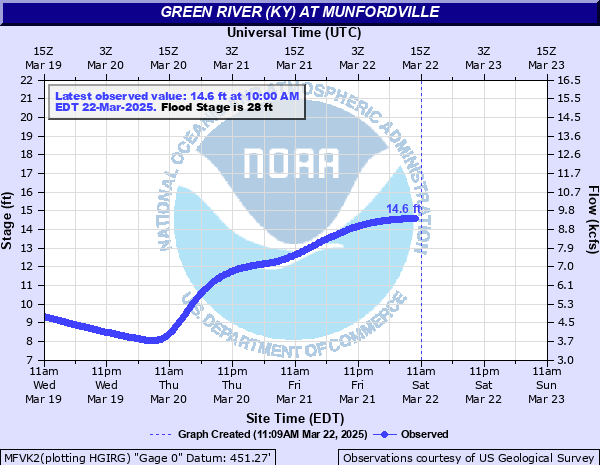
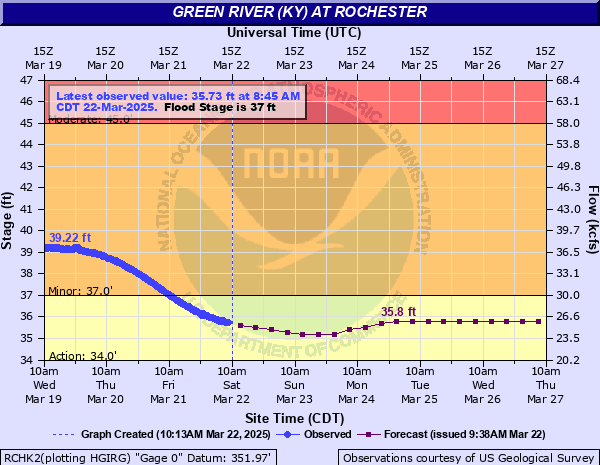
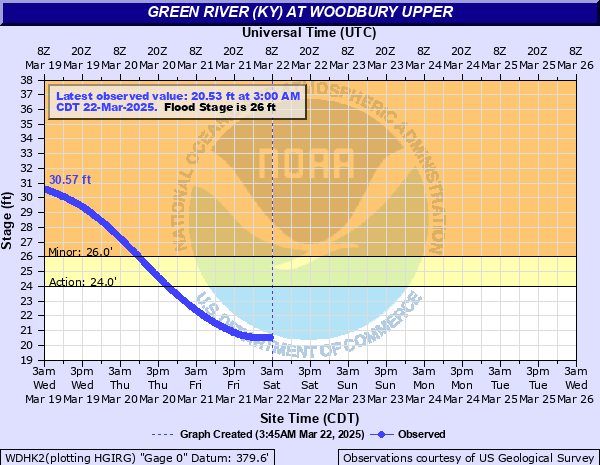
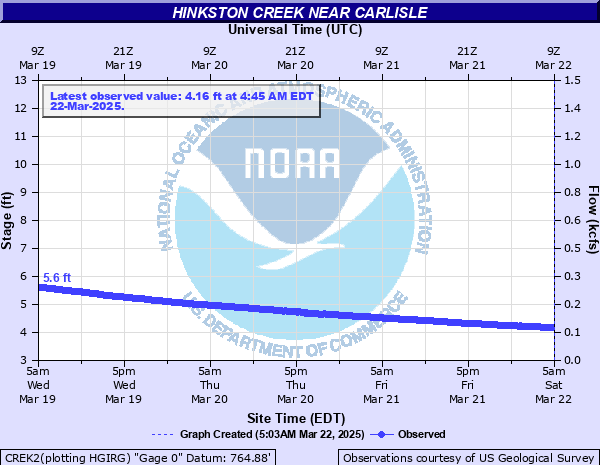
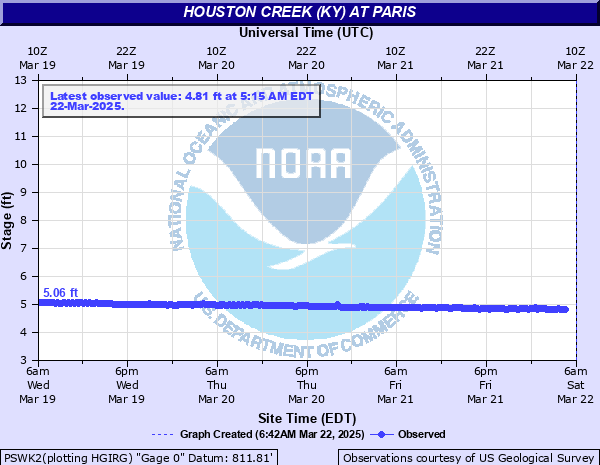
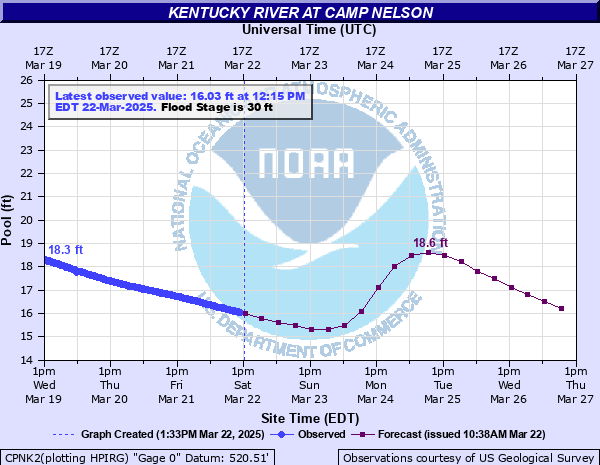
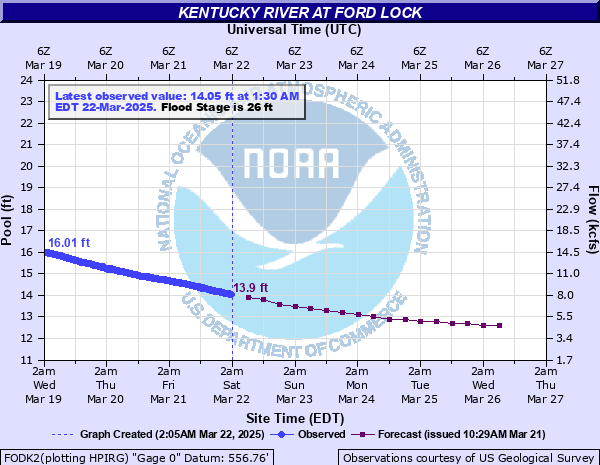
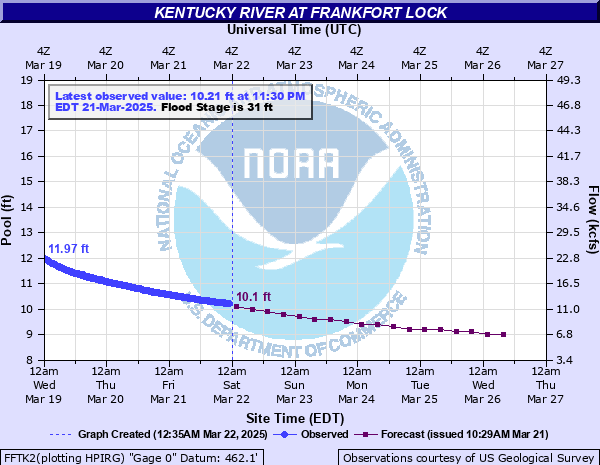
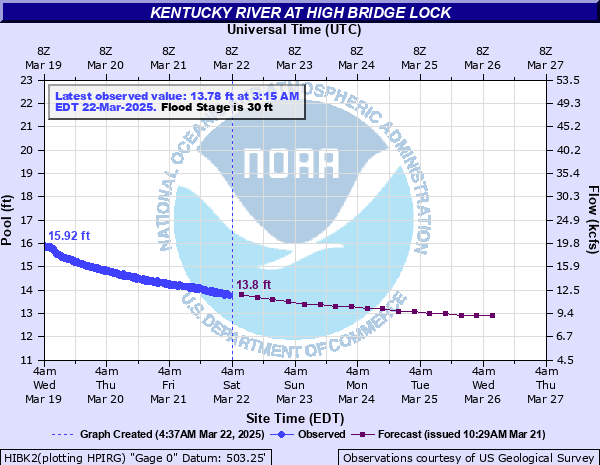
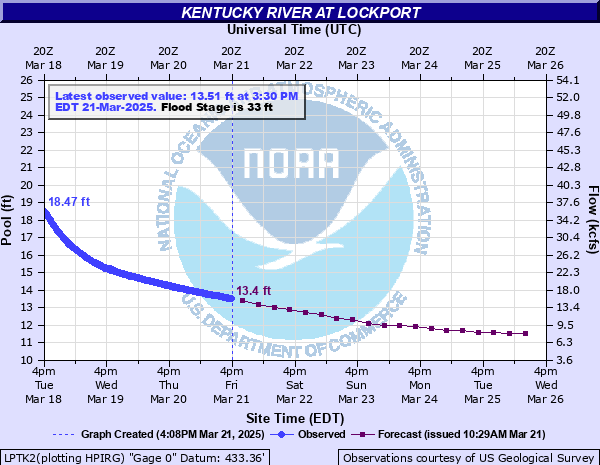
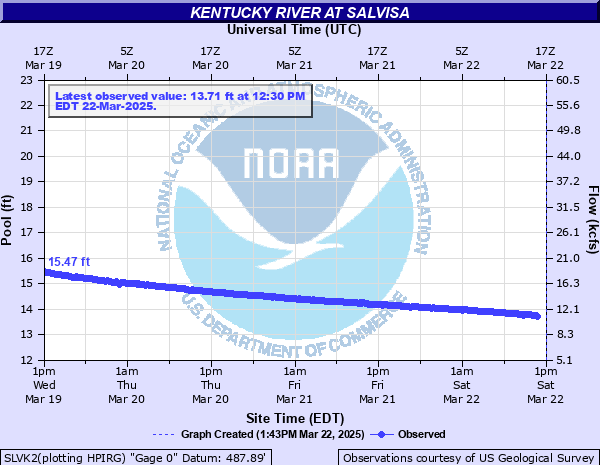
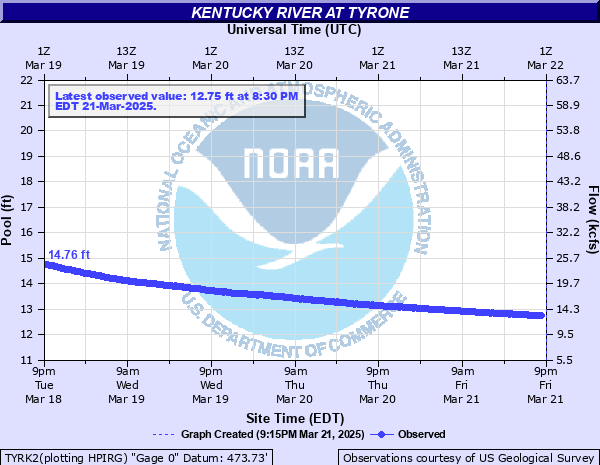
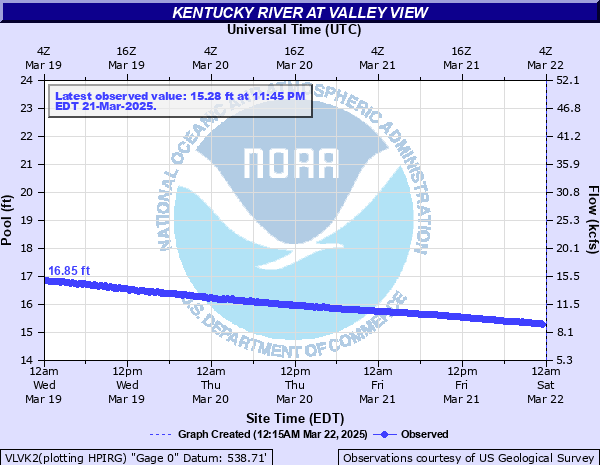
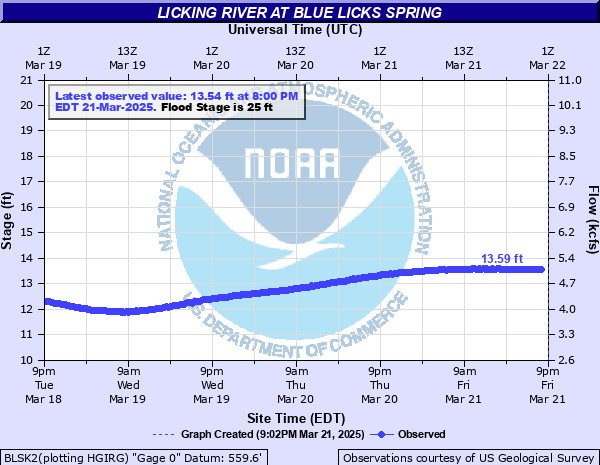
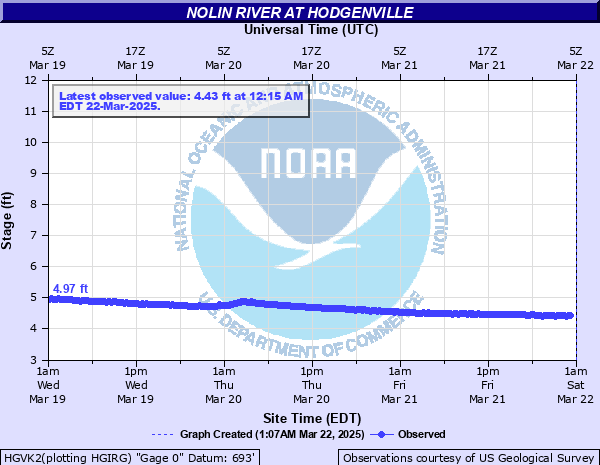
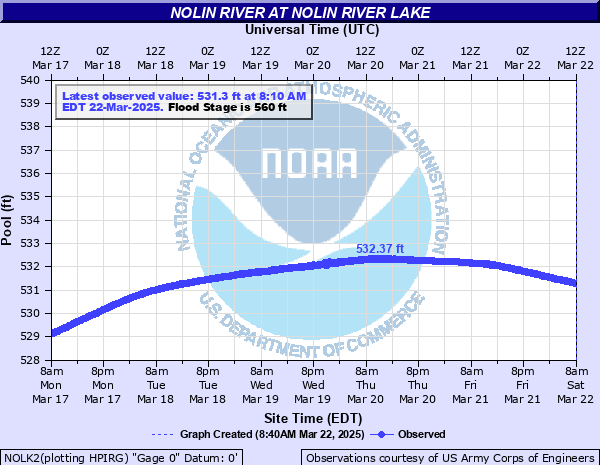
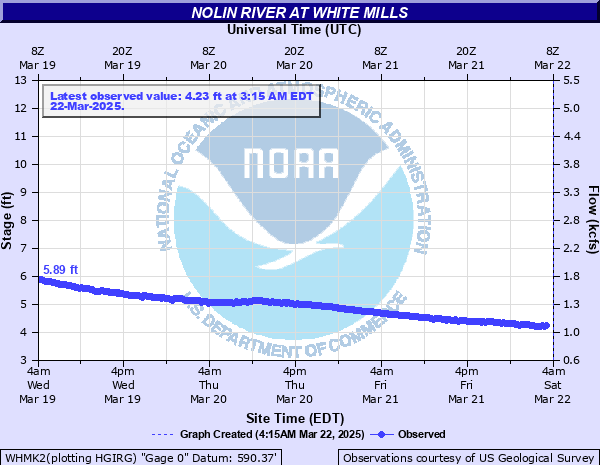
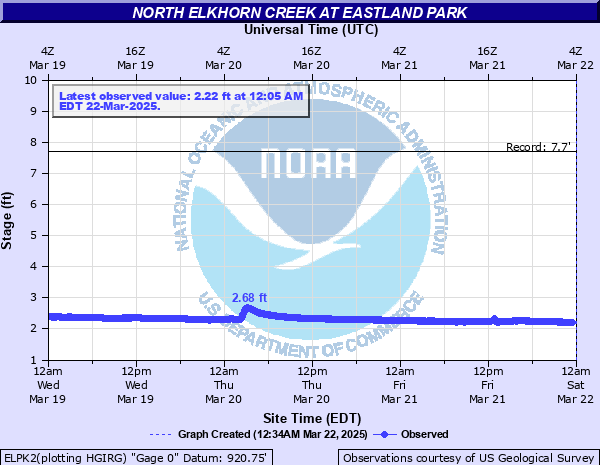
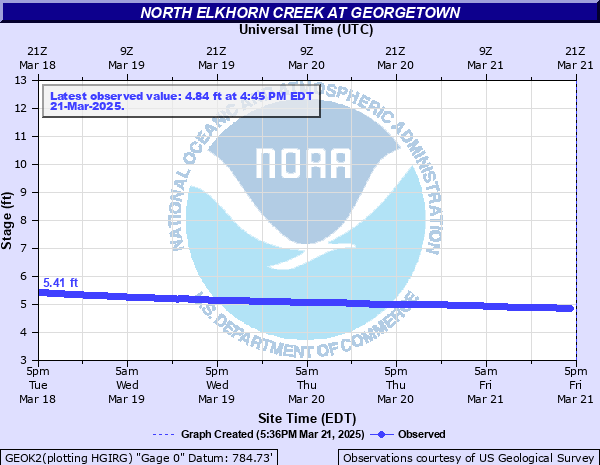
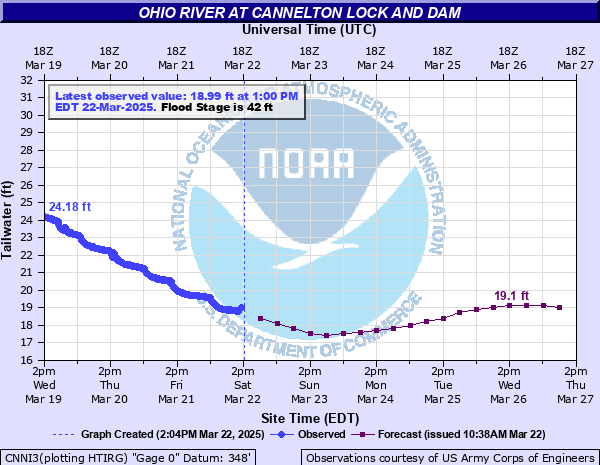
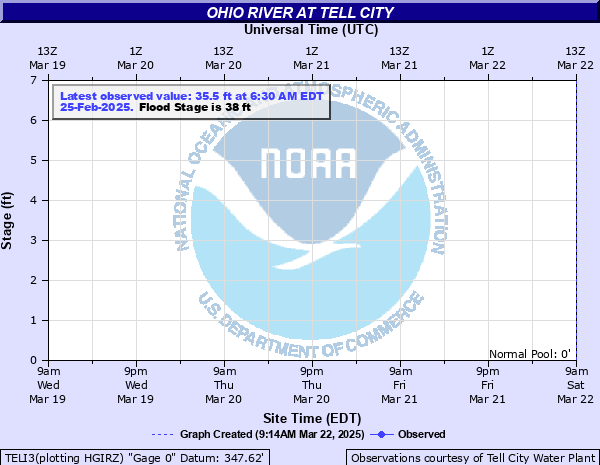
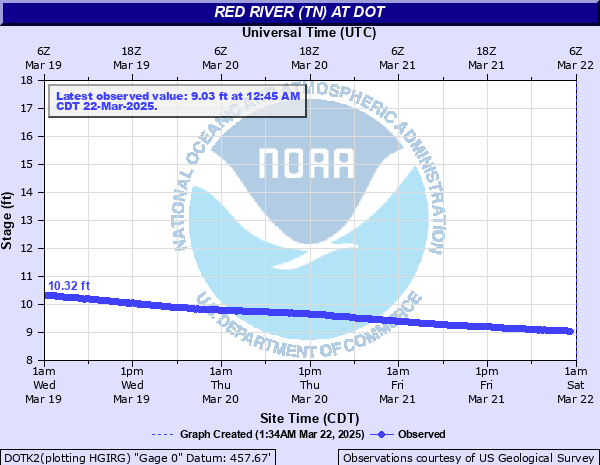
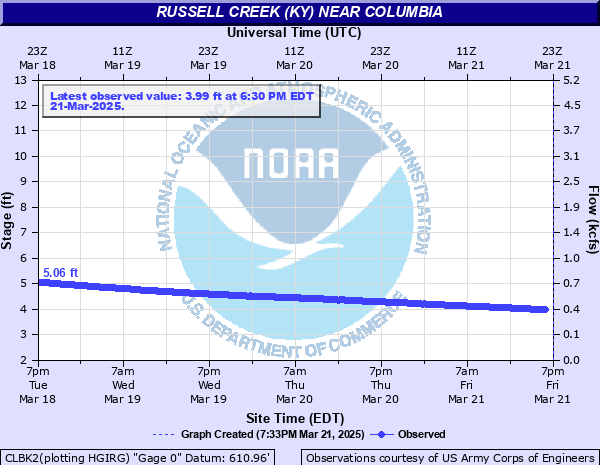
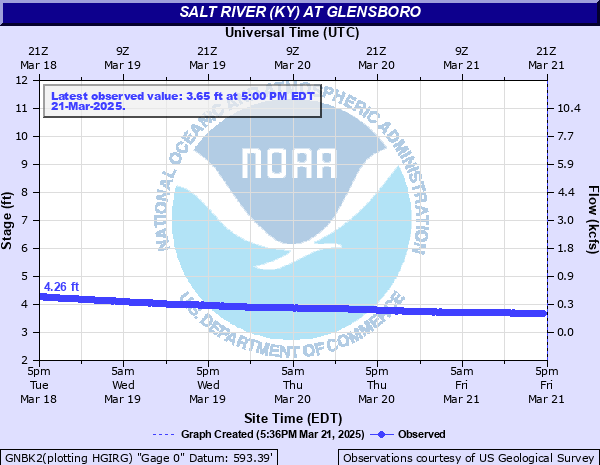
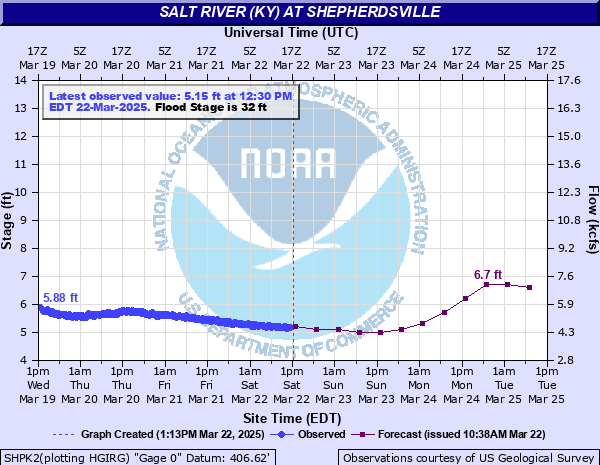
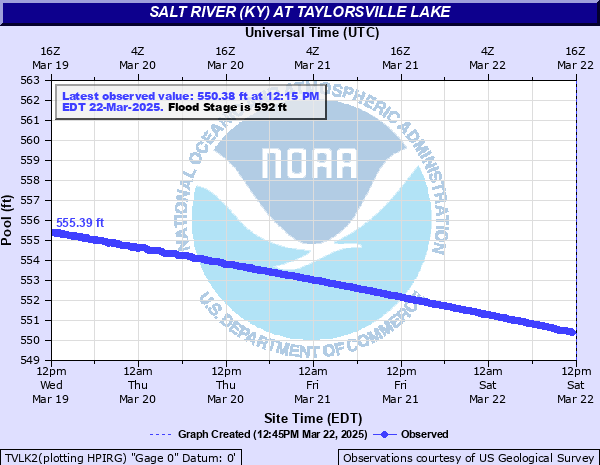
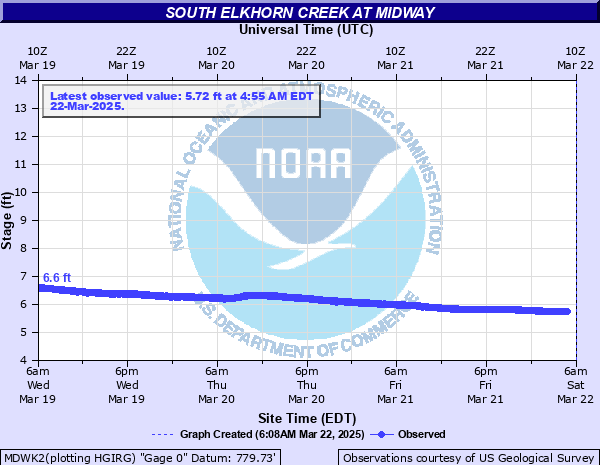
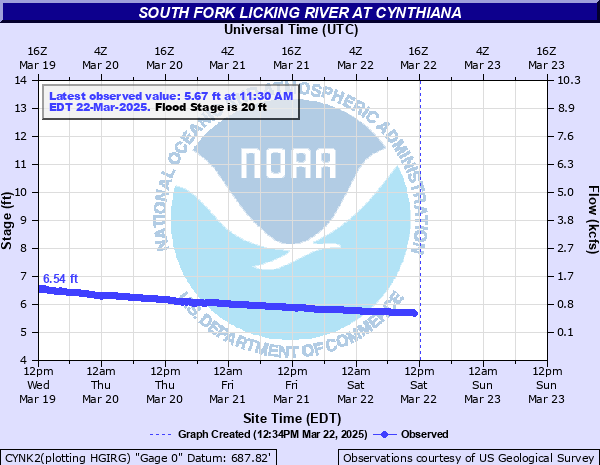
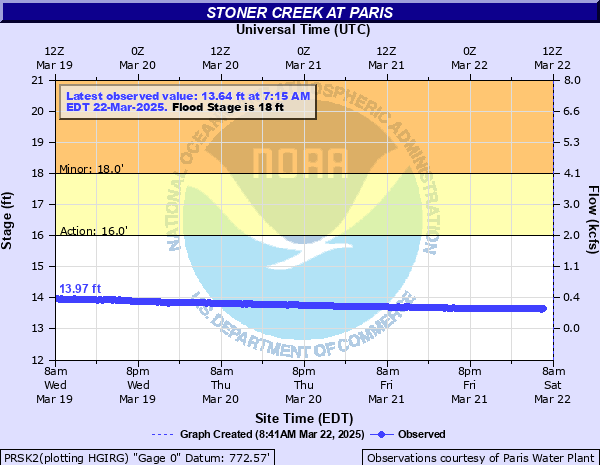
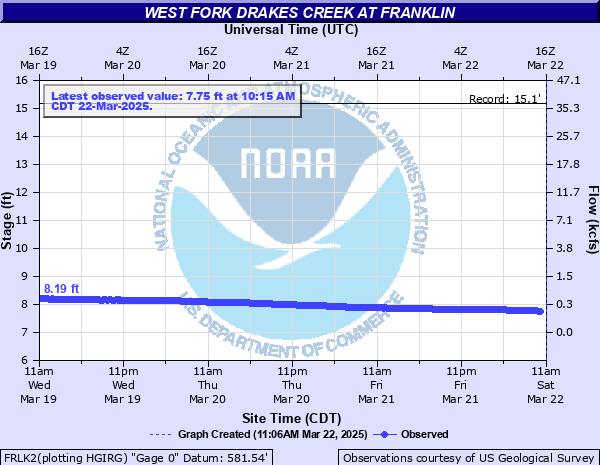
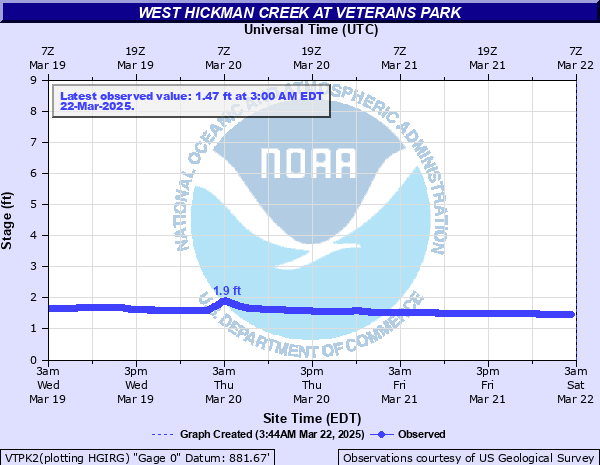
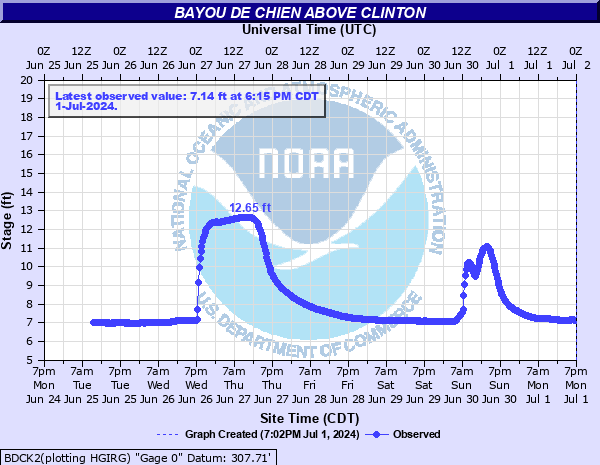
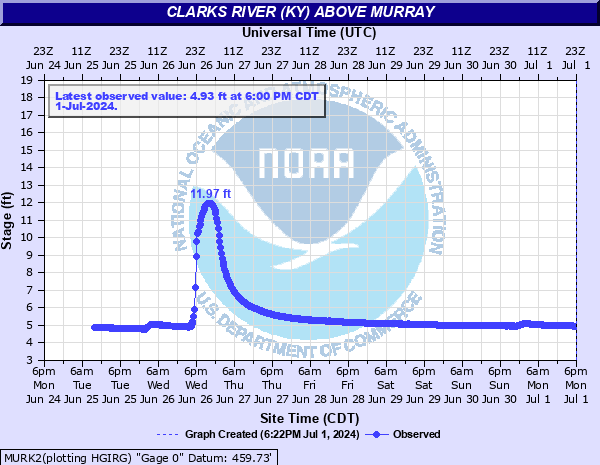
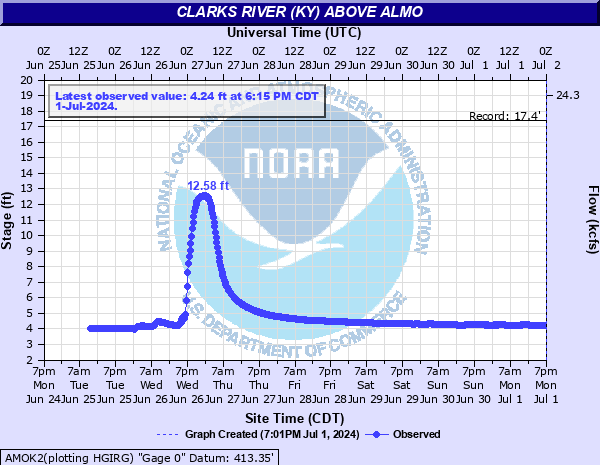
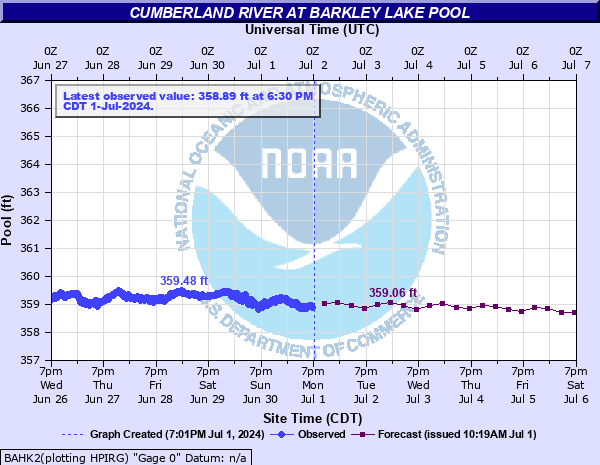
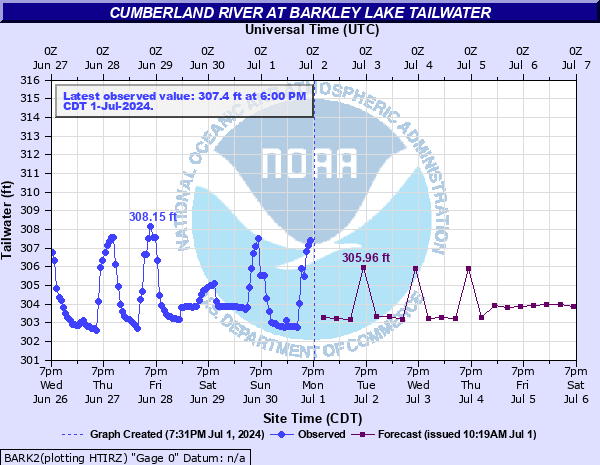
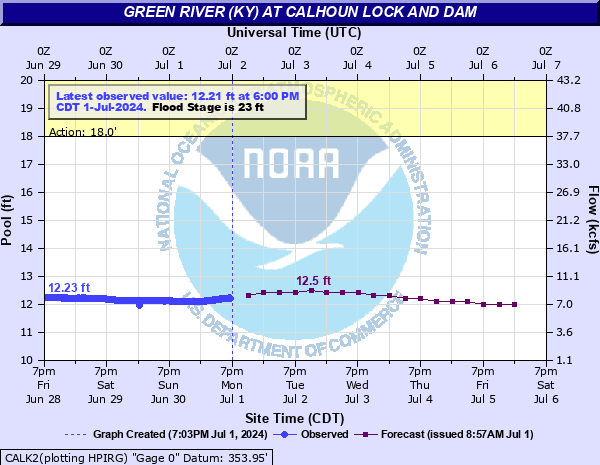
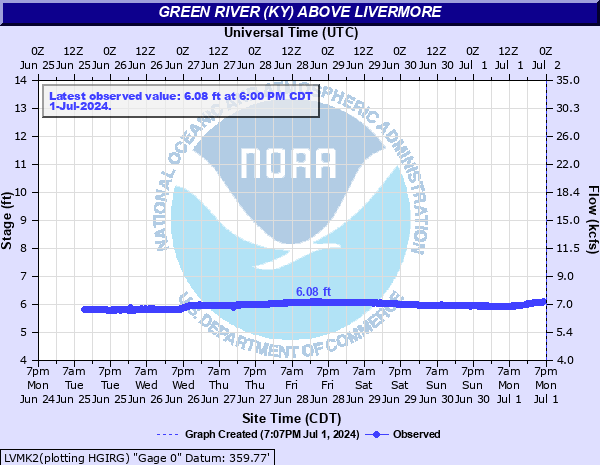
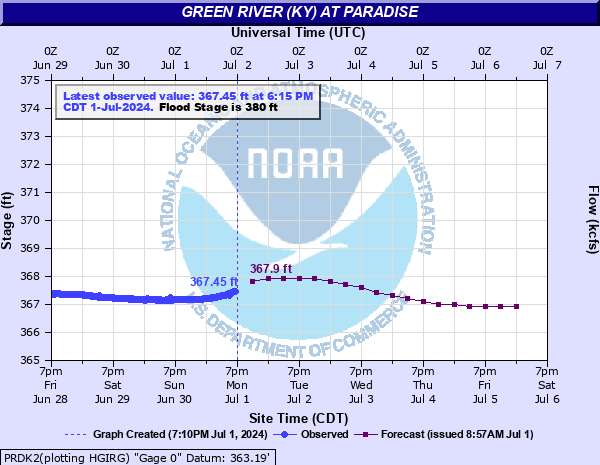
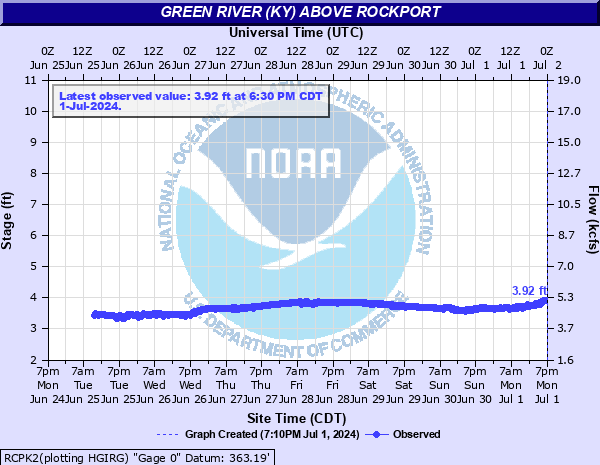
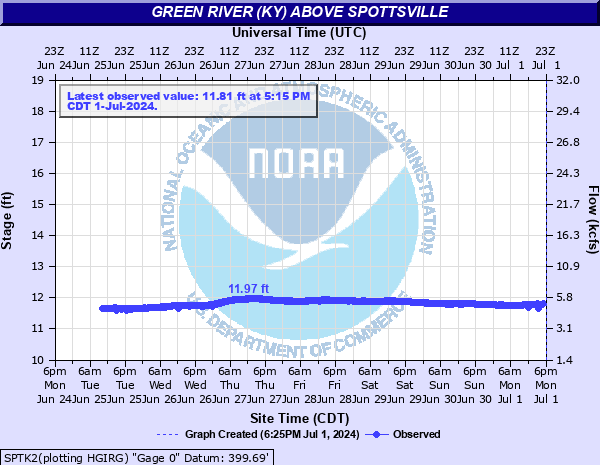
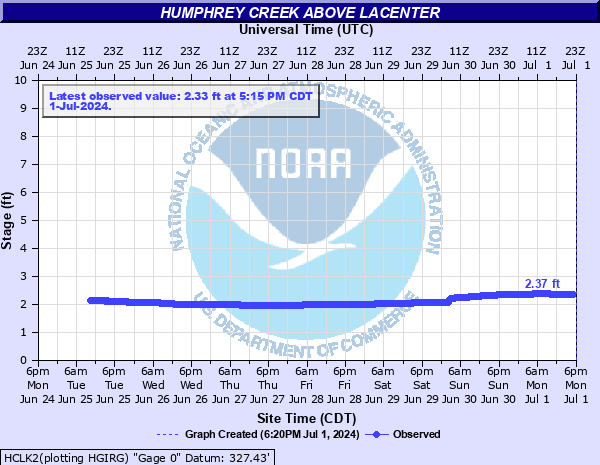
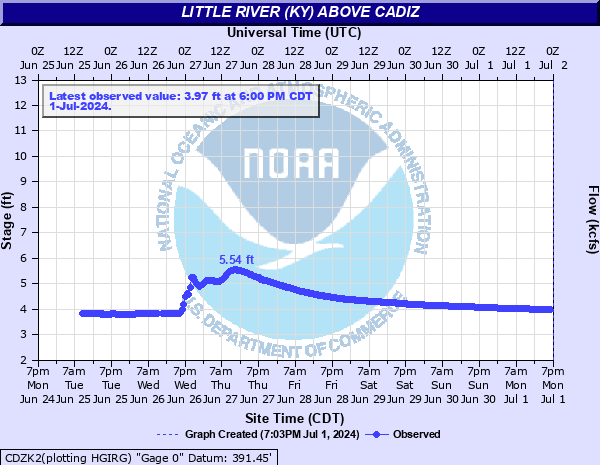
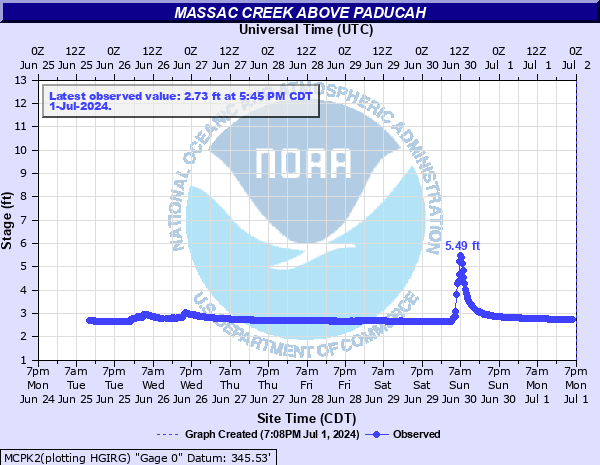
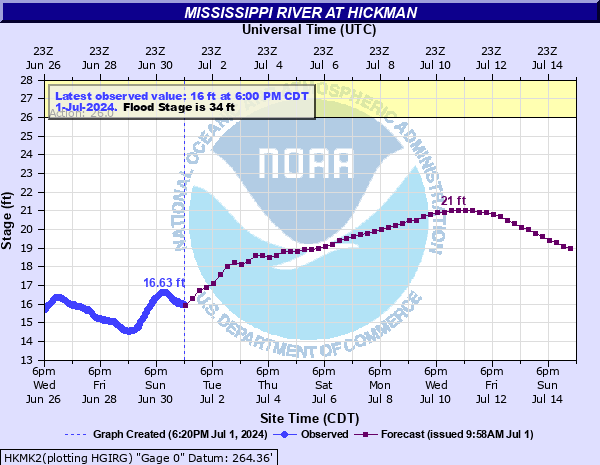
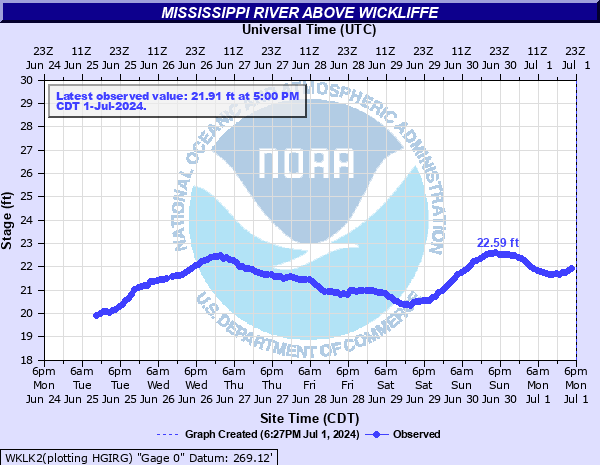
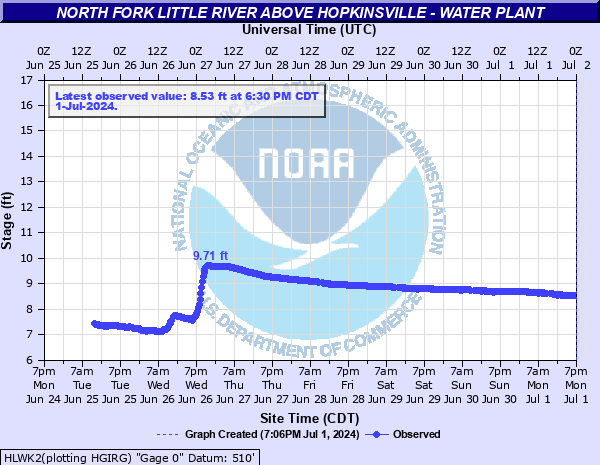
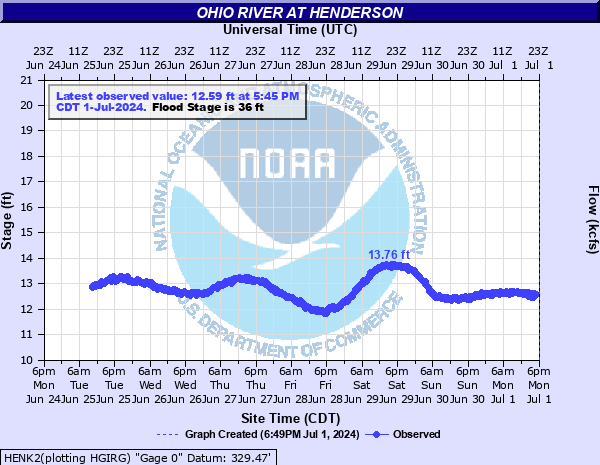
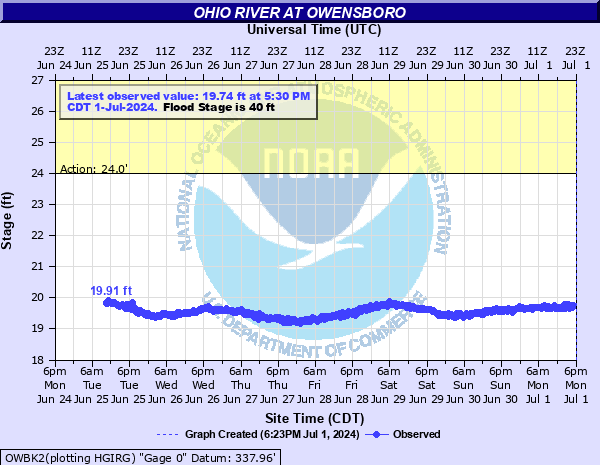
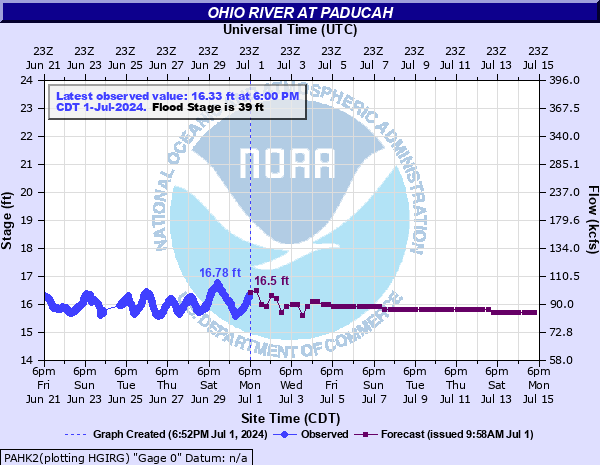
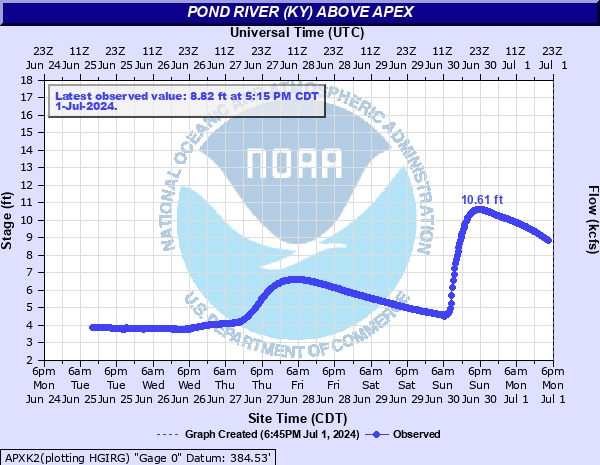
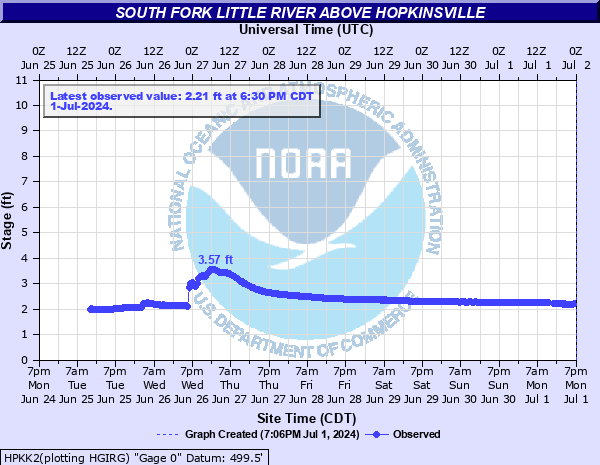
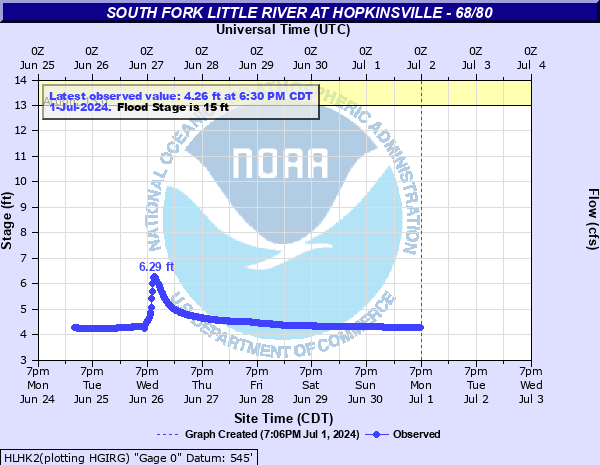
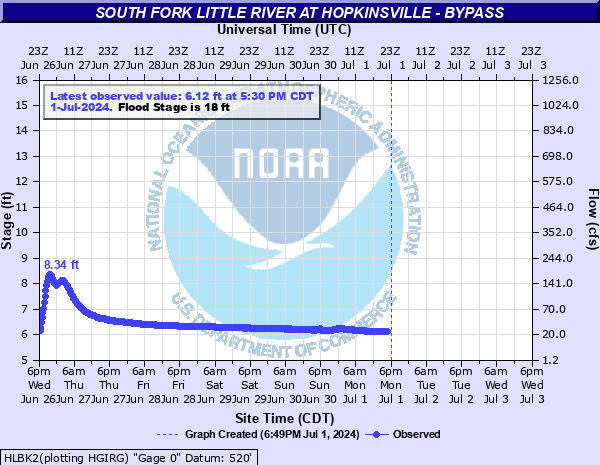
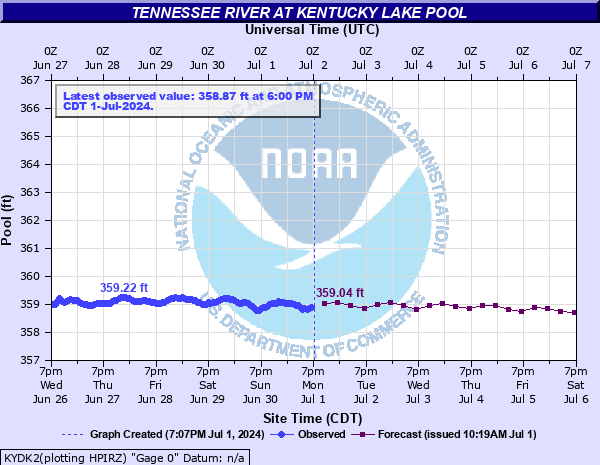
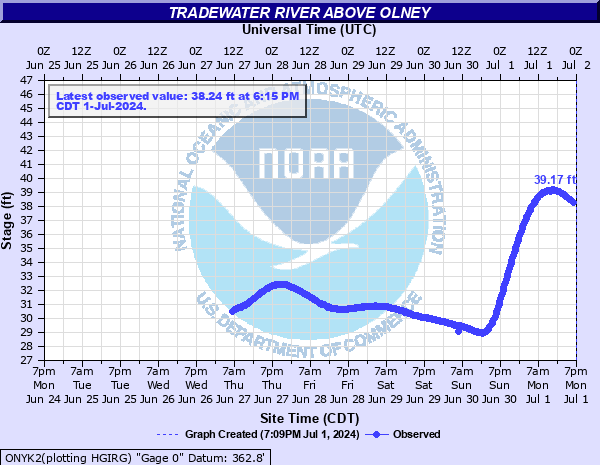
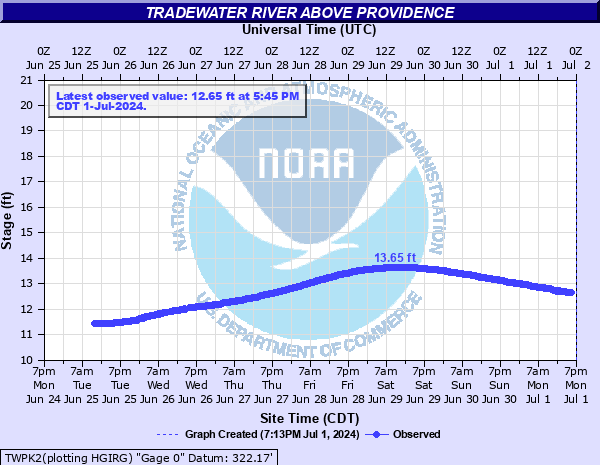
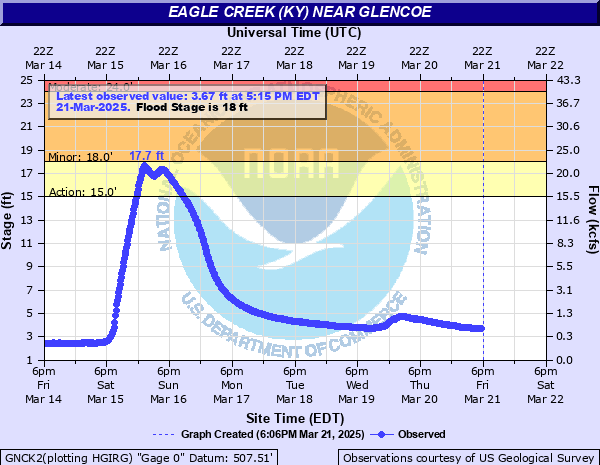
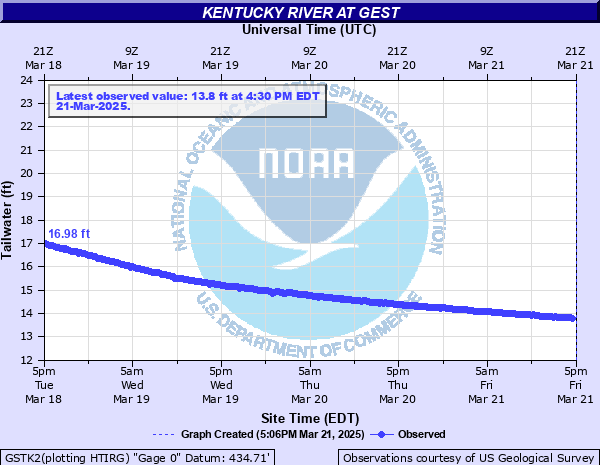
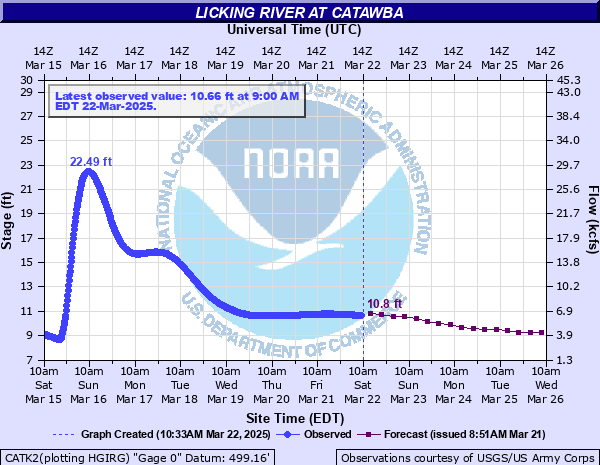
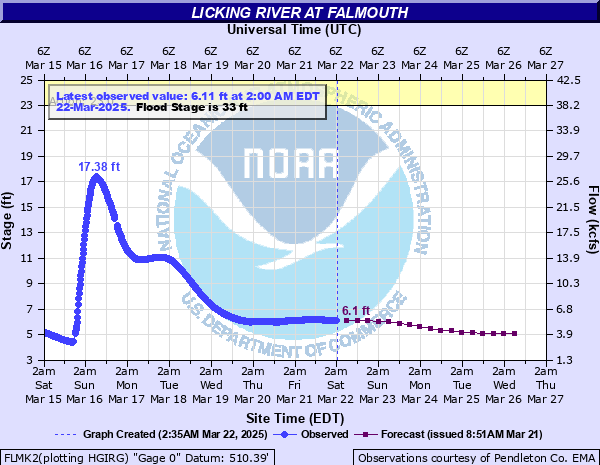
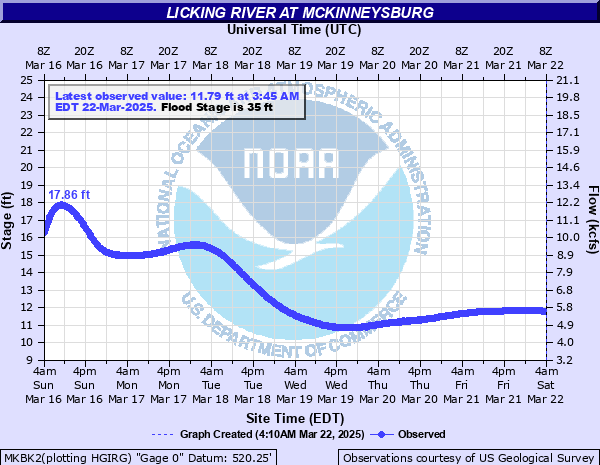
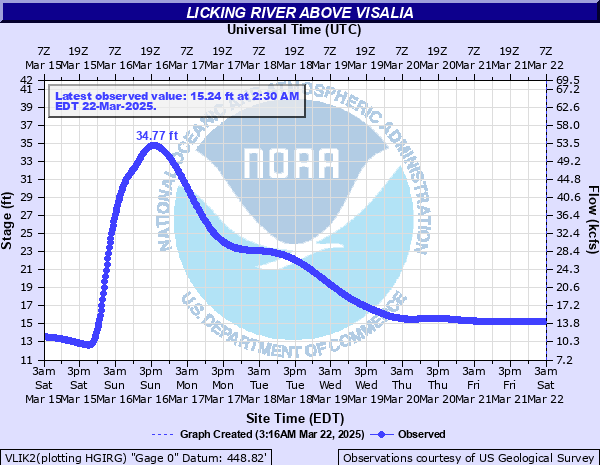
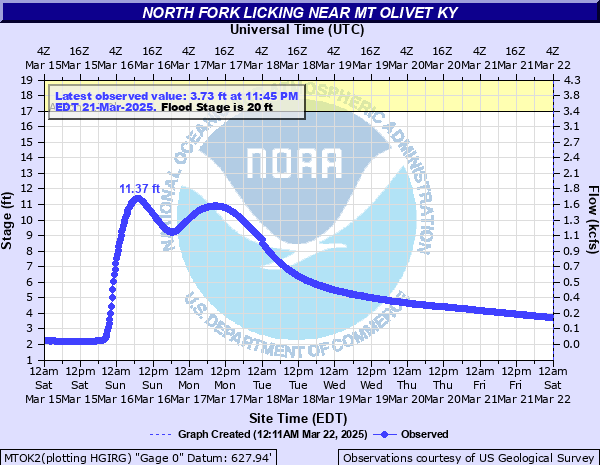
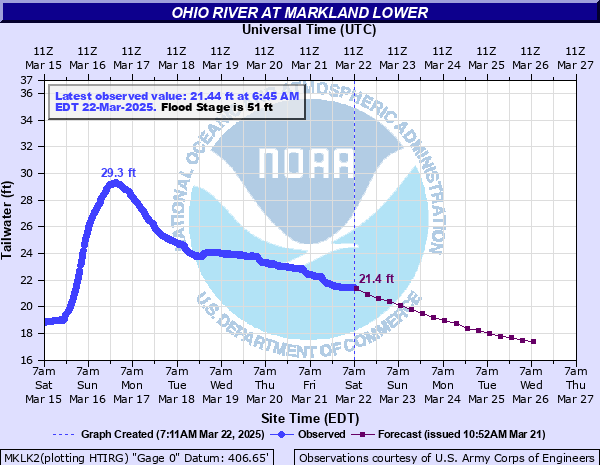
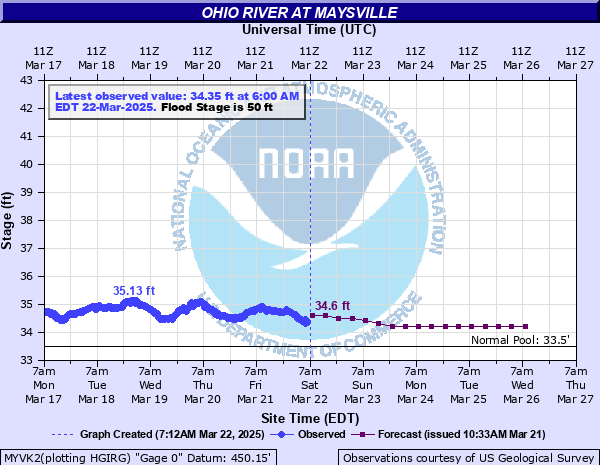
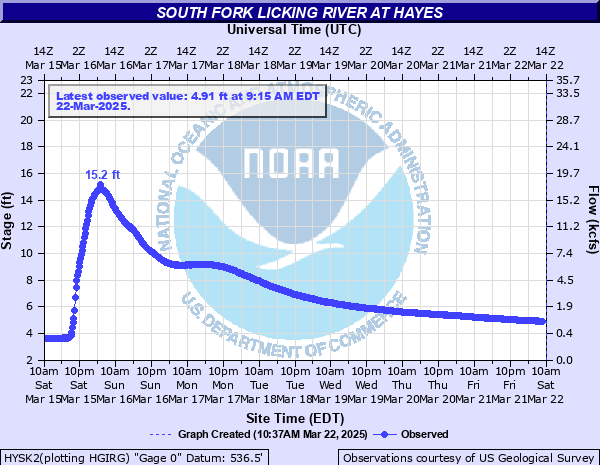
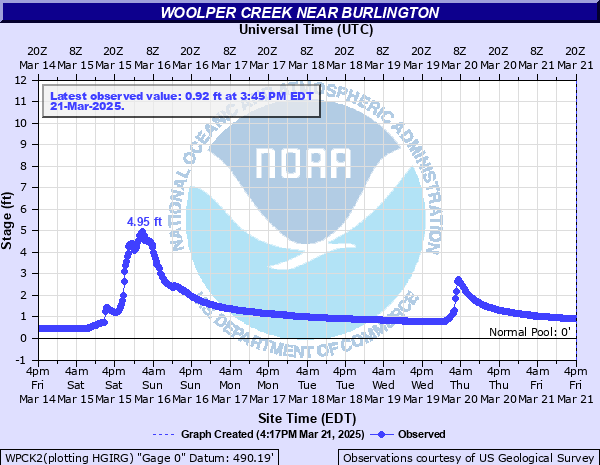
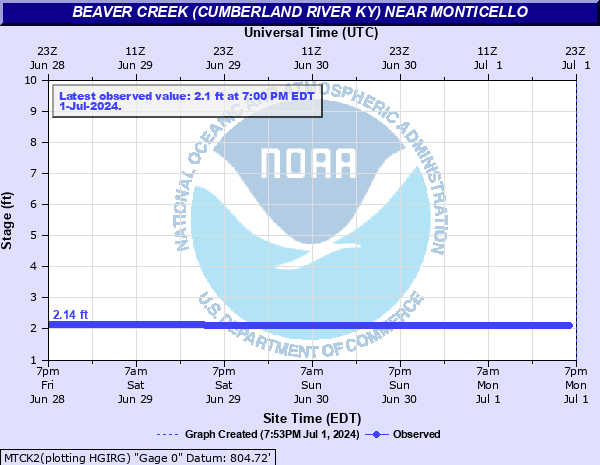
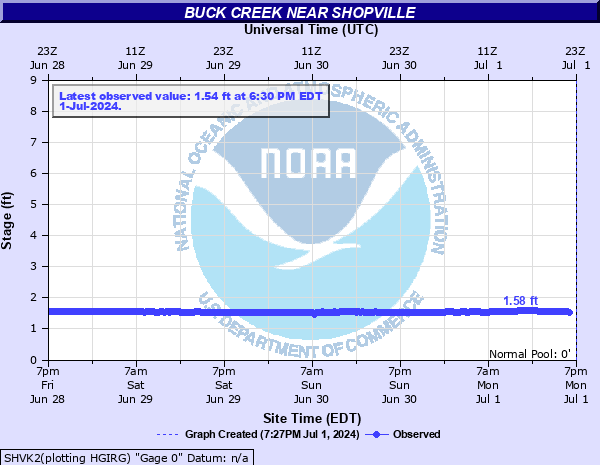
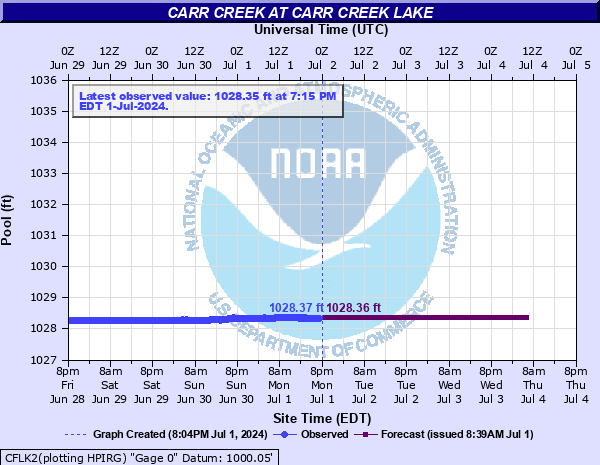
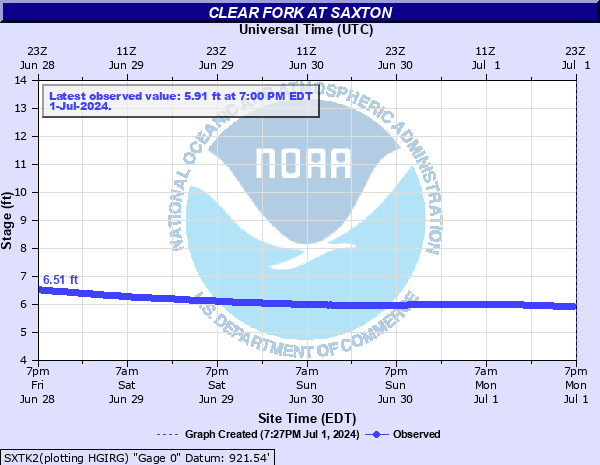
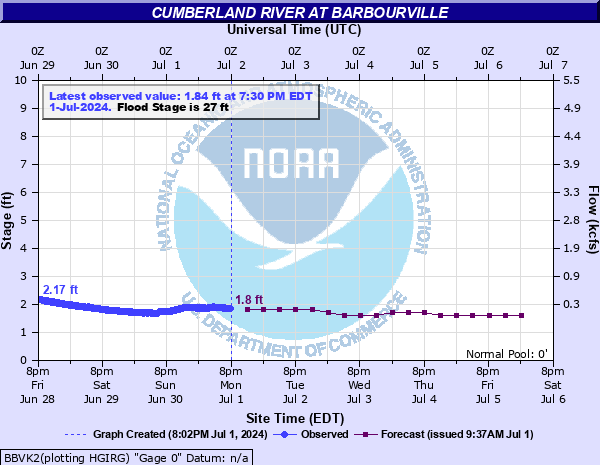
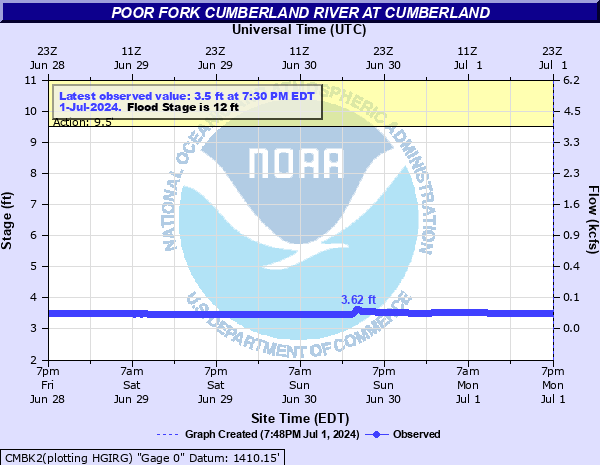
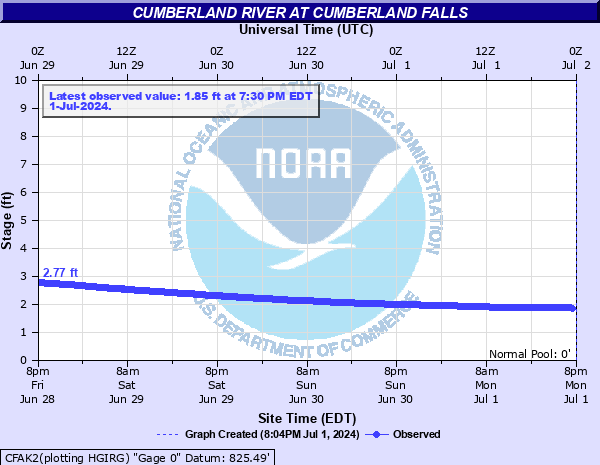
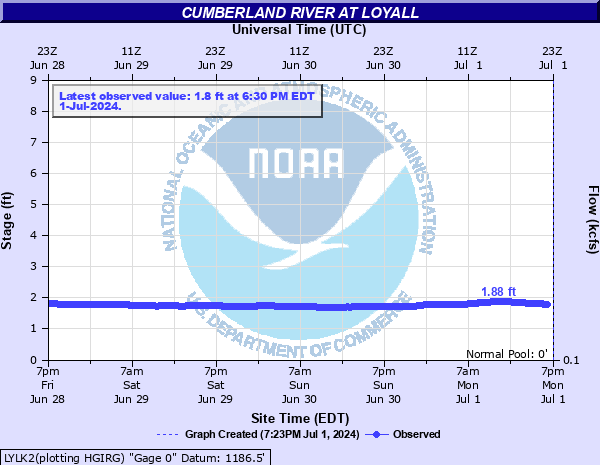
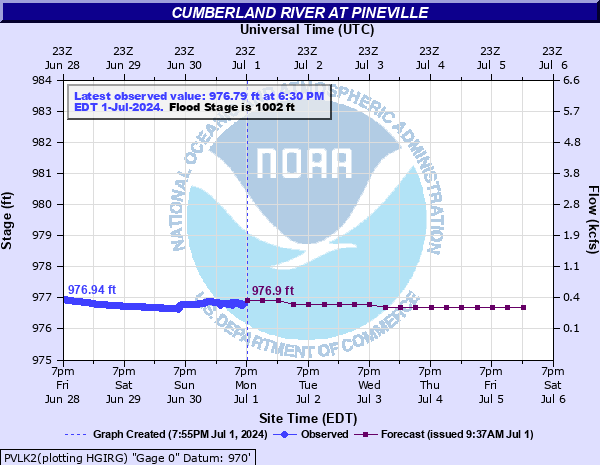
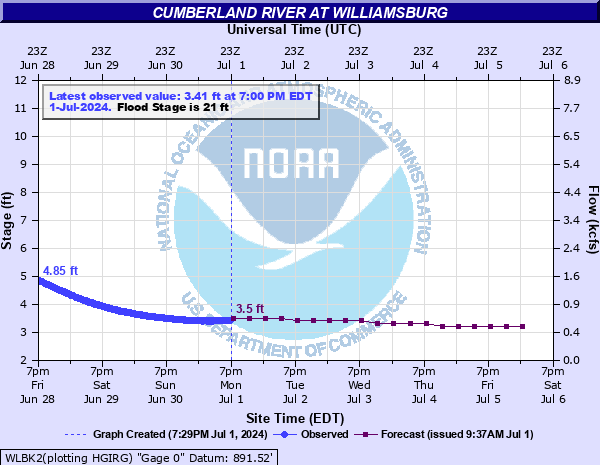
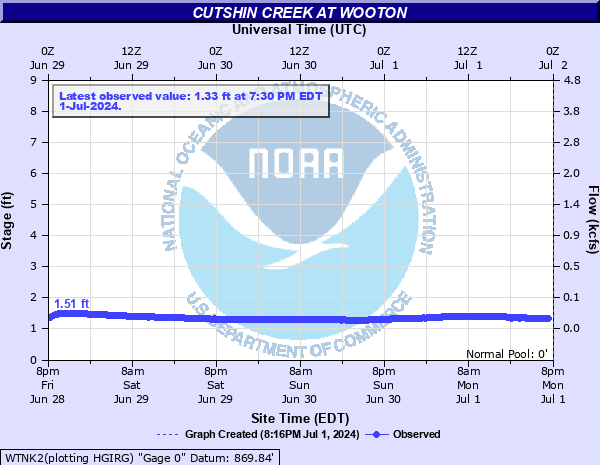
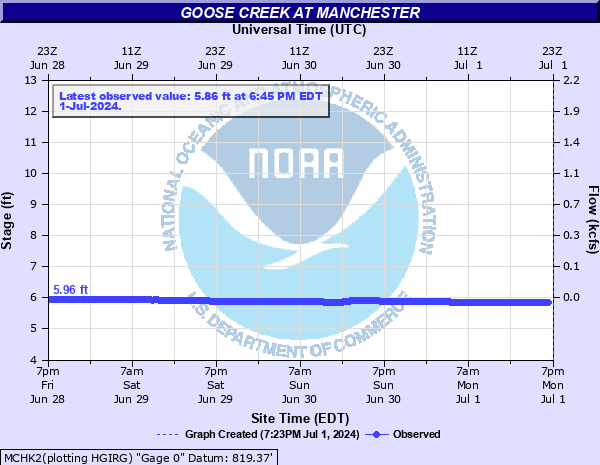
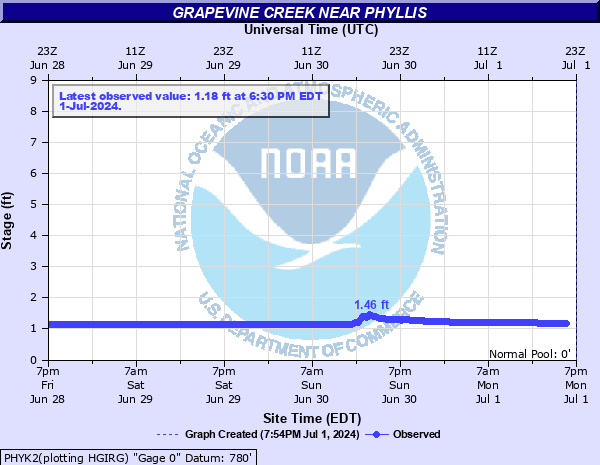
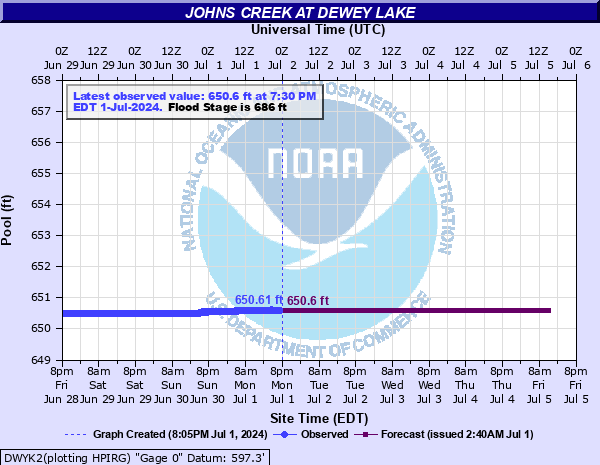
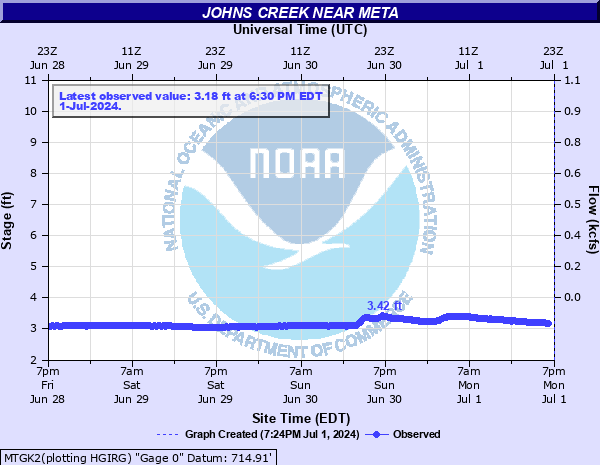
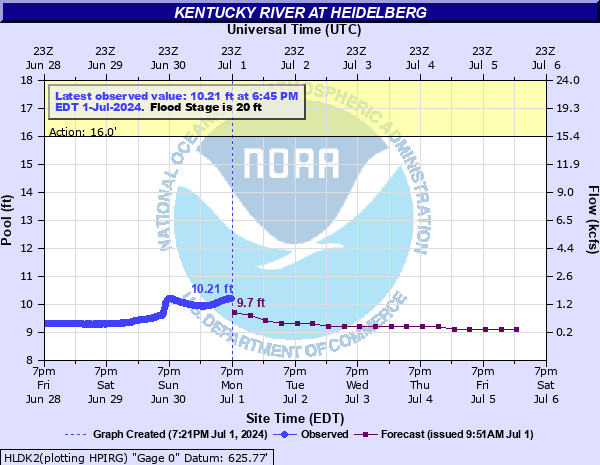
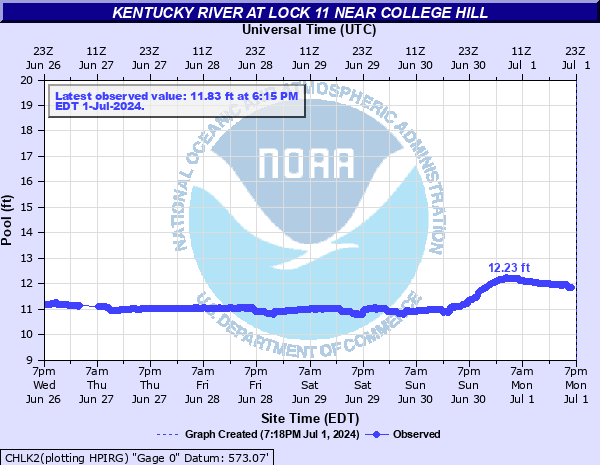
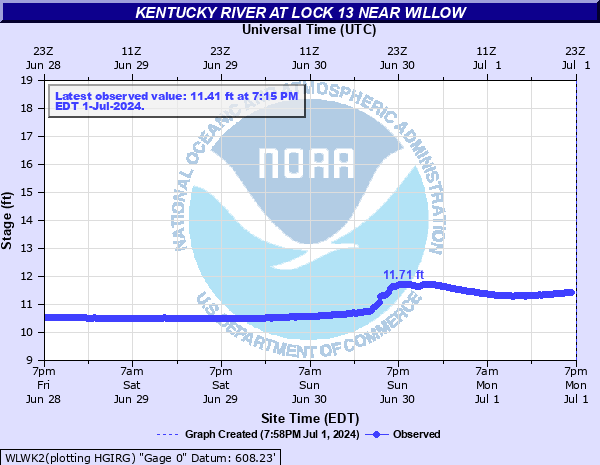
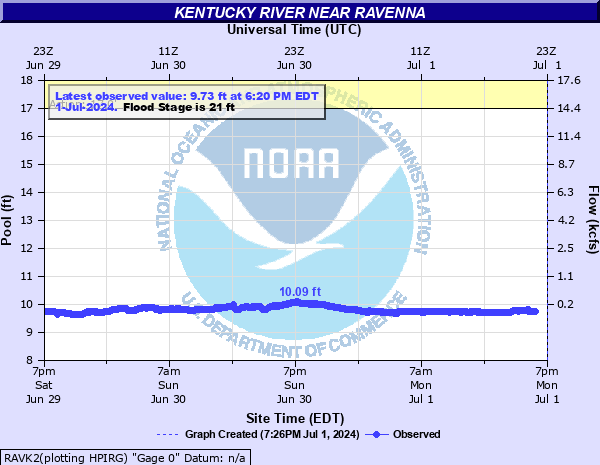
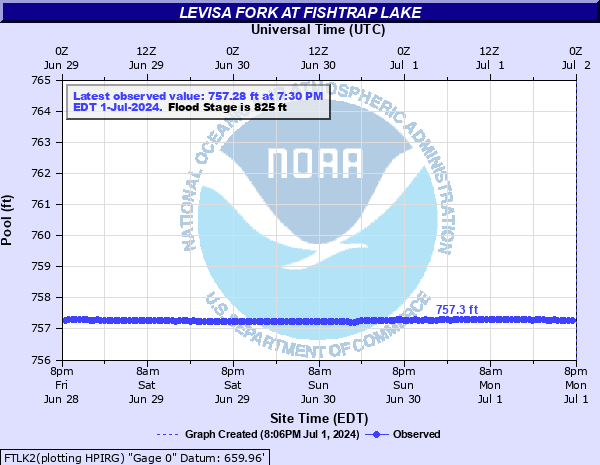
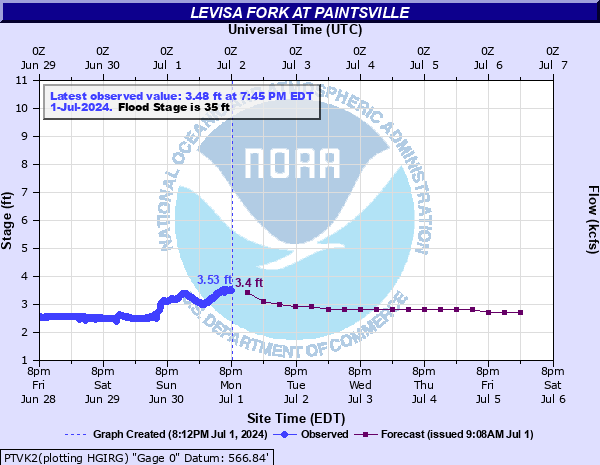
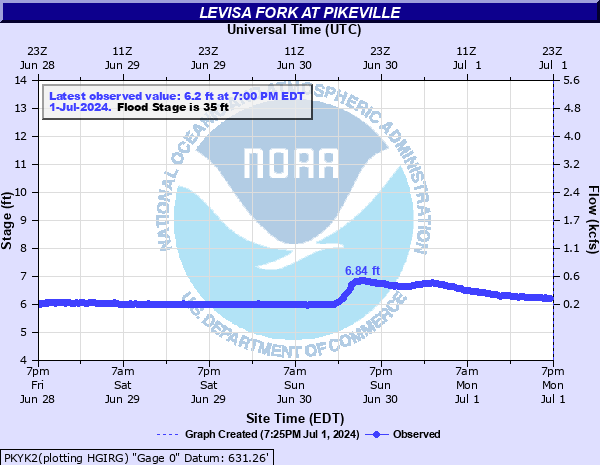
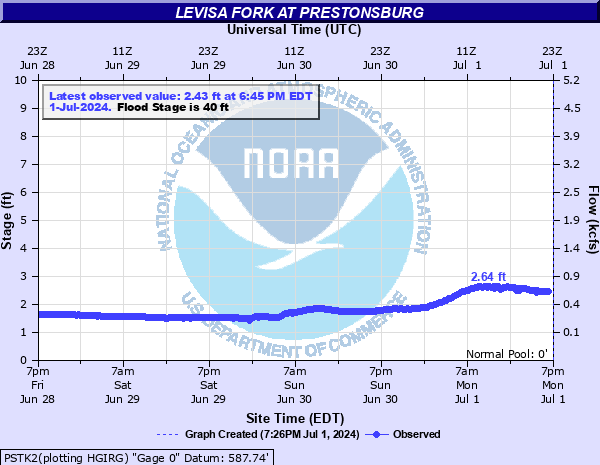
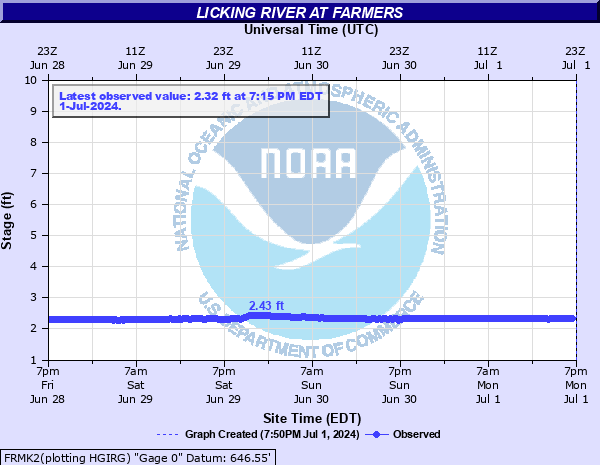
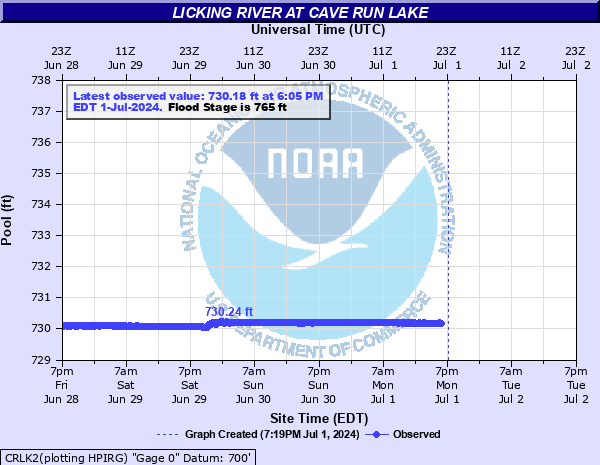
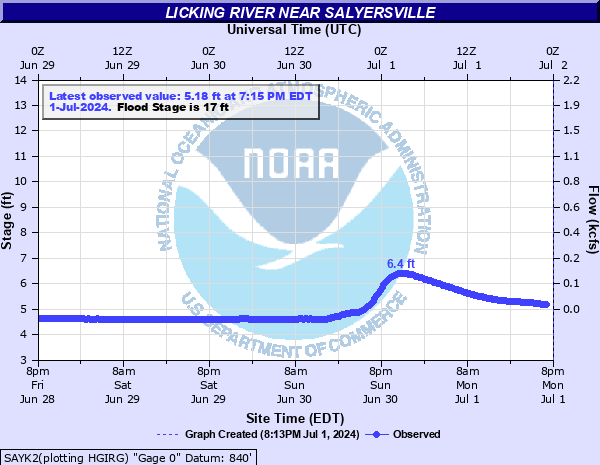
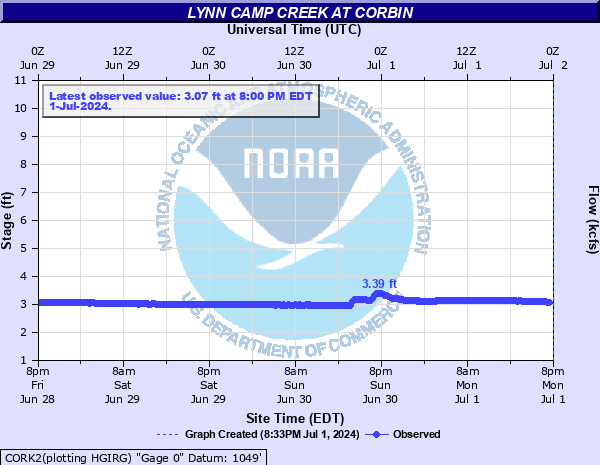
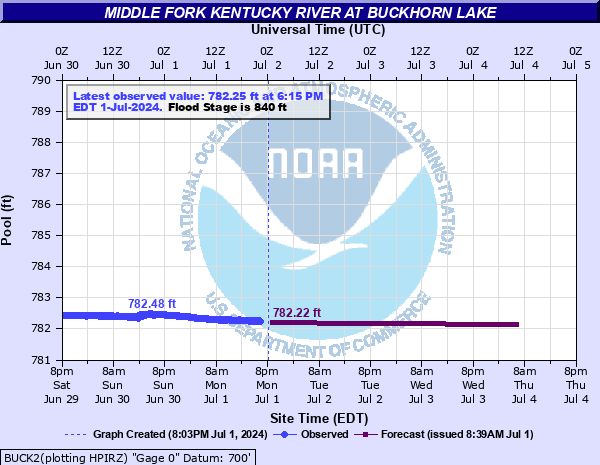
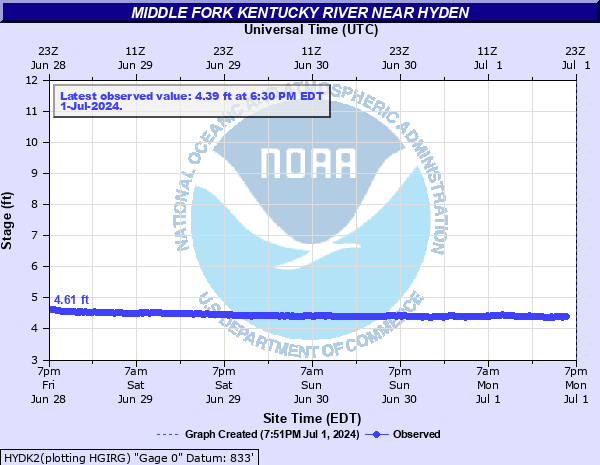
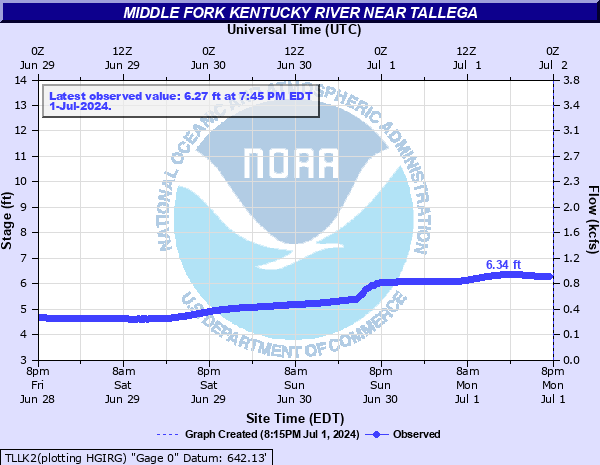
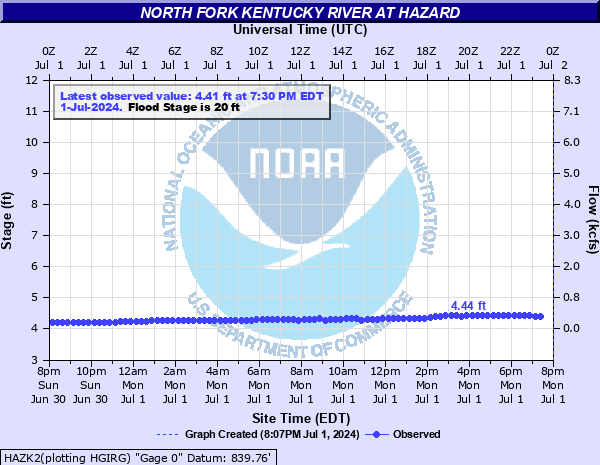
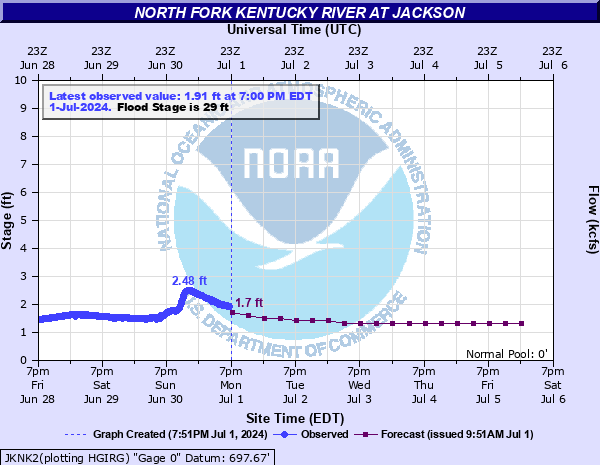
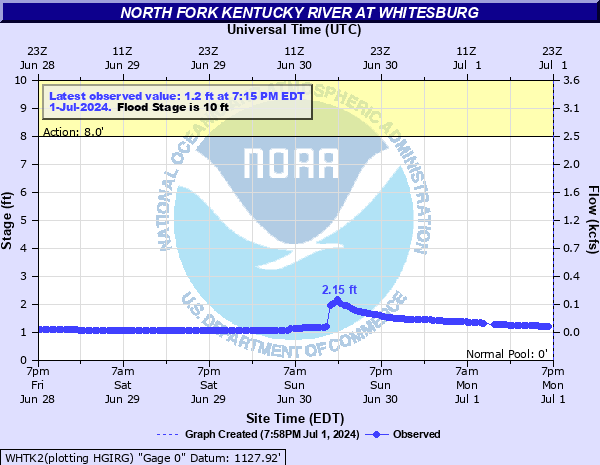
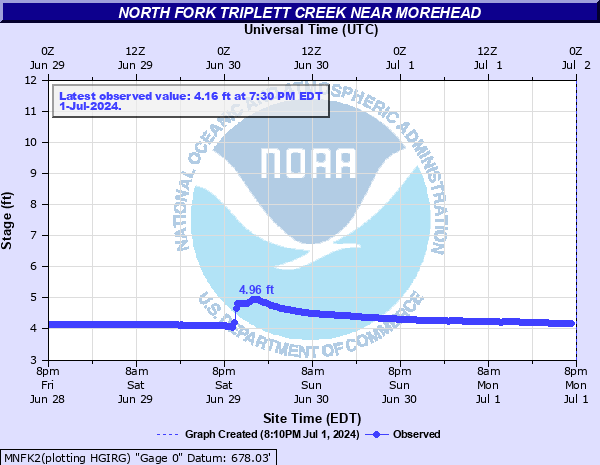
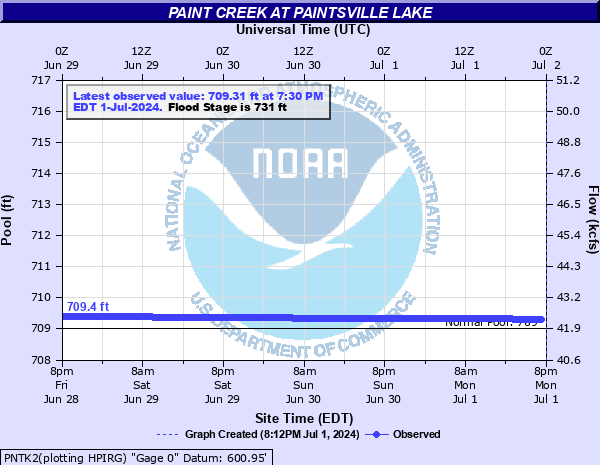
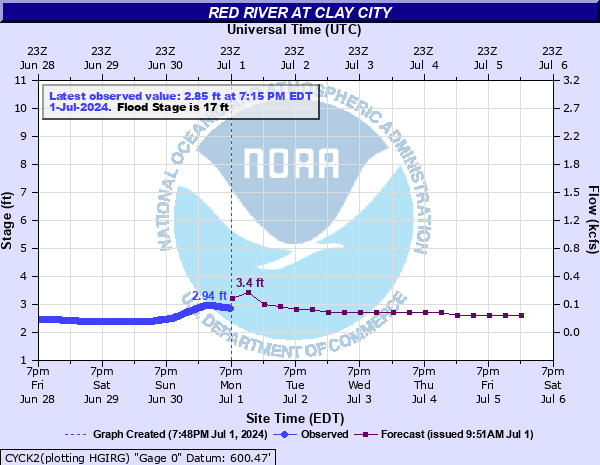
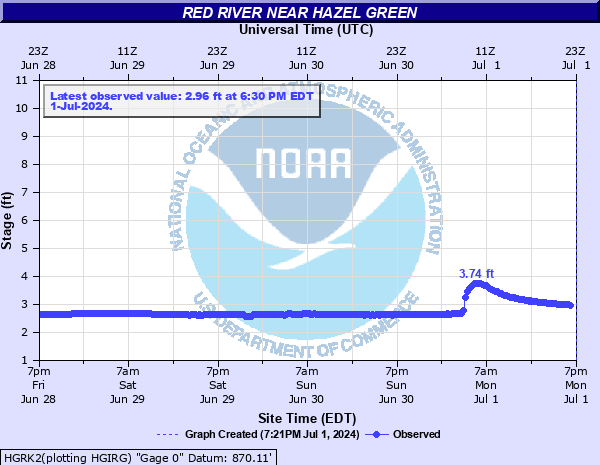
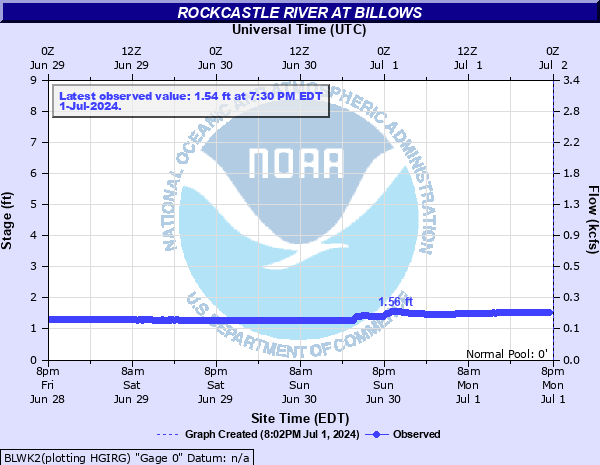
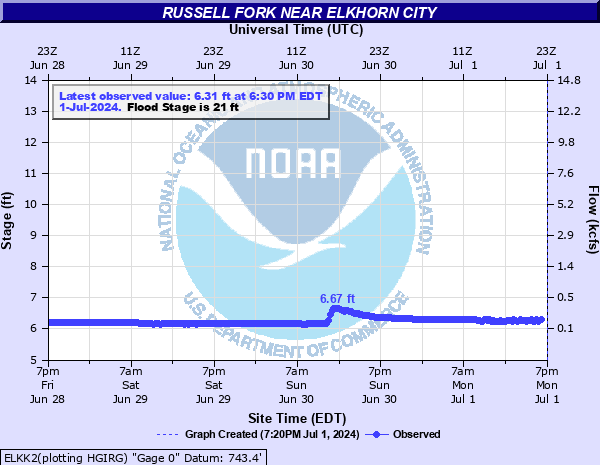
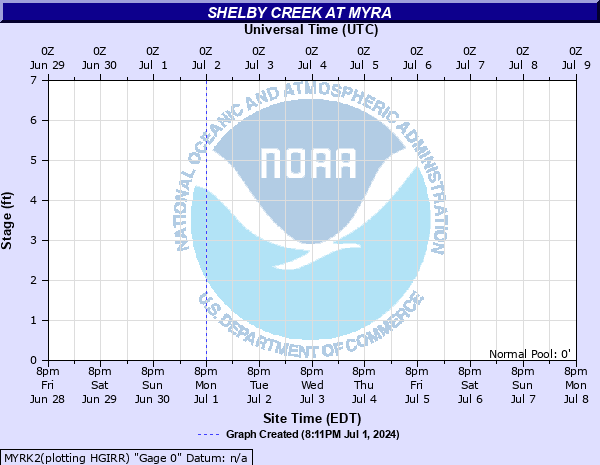
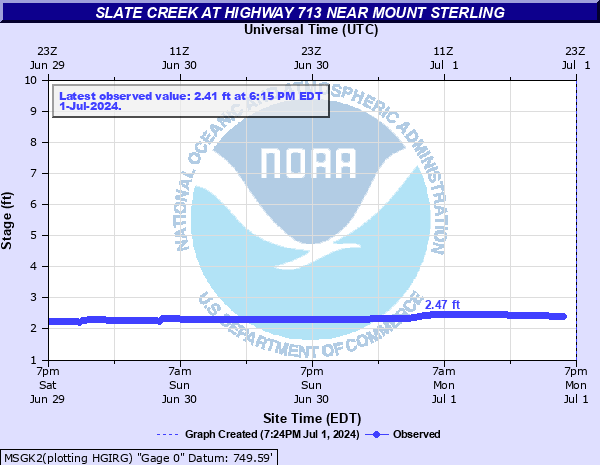
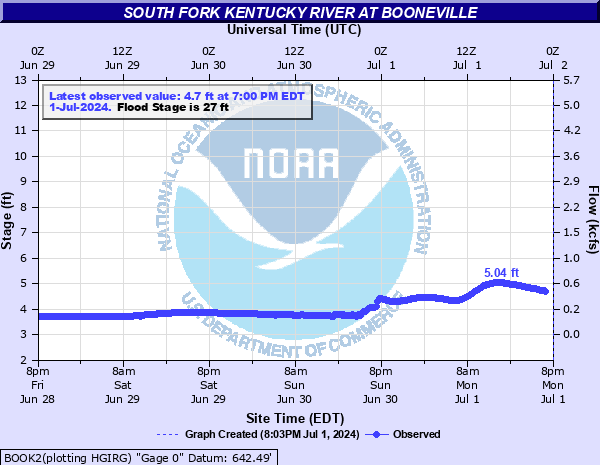
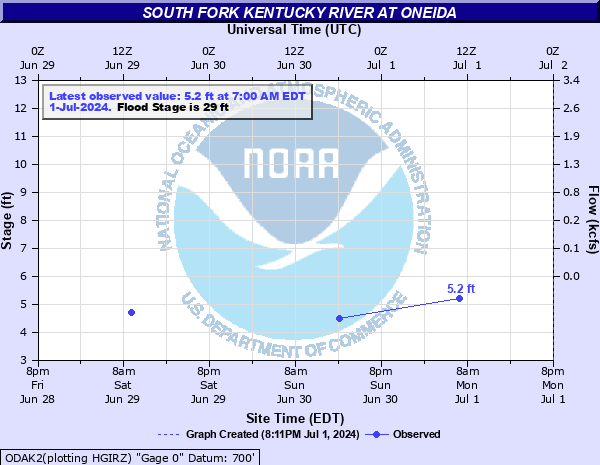
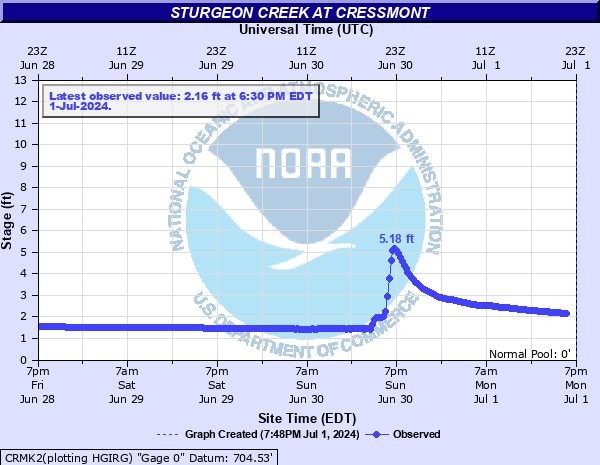
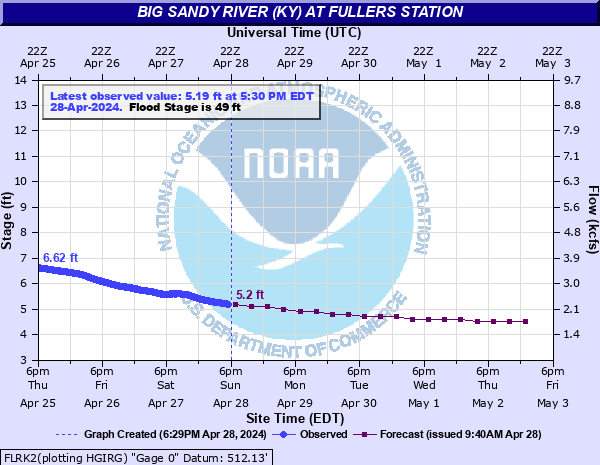
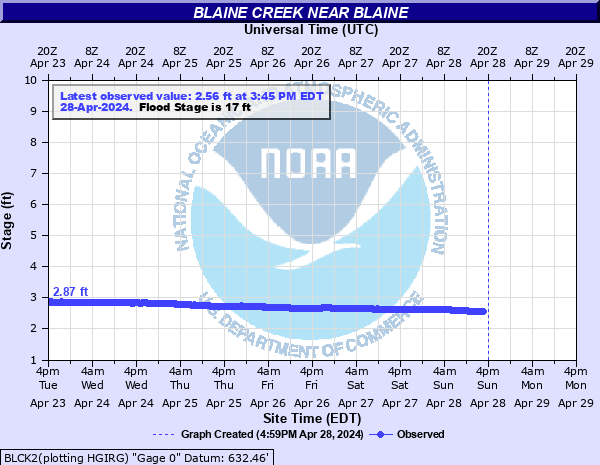
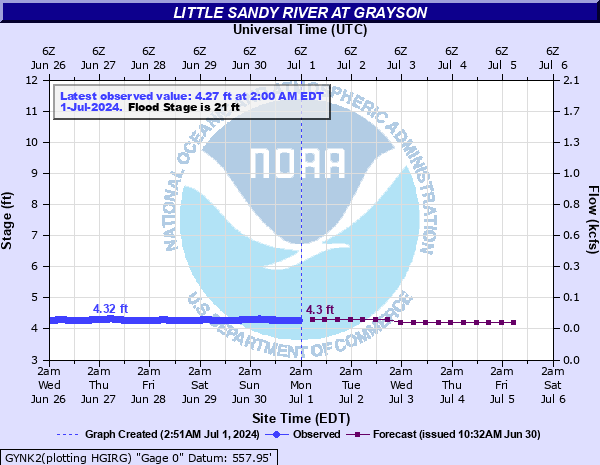
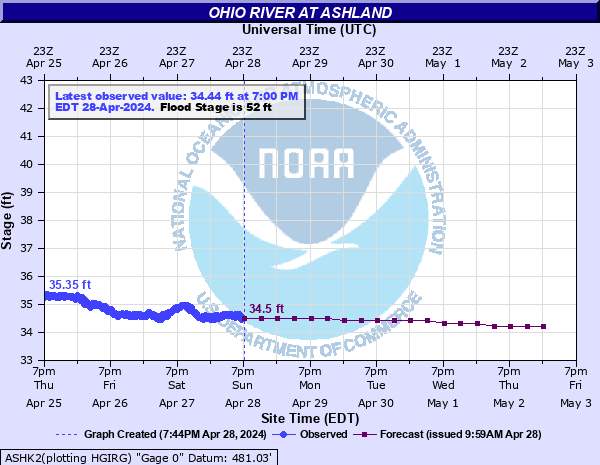
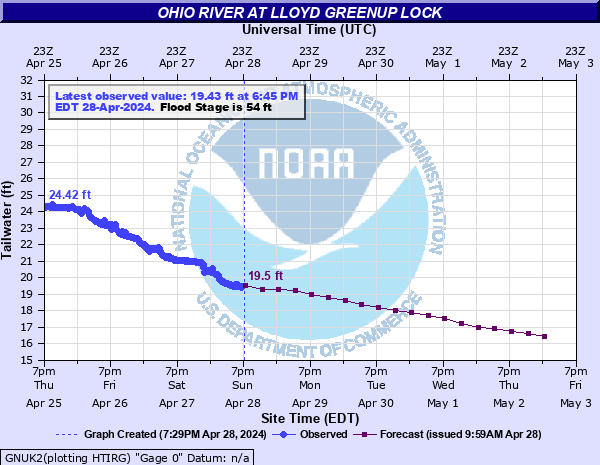
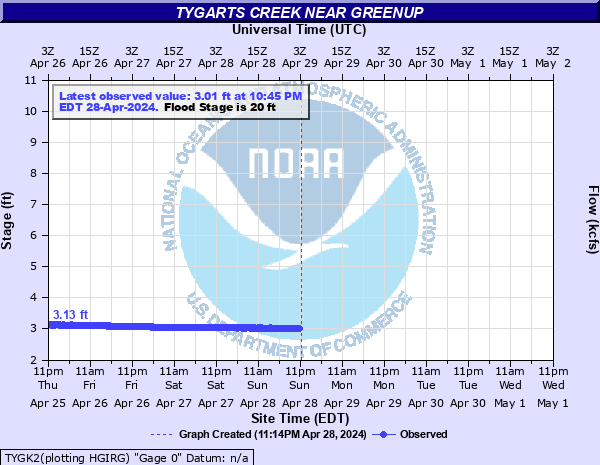
The river stage data come from USGS and USACE. Forecasts are from the National Weather Service.
|
|
Crop Progress and Condition Report: National Weekly Weather and Crop Bulletin
For additional information on agriculture impacts may be viewed from the:
|
|||||||||||||||||||||||||||||||||||||||||
|
National Significant Wildland Fire Potential Outlook
|
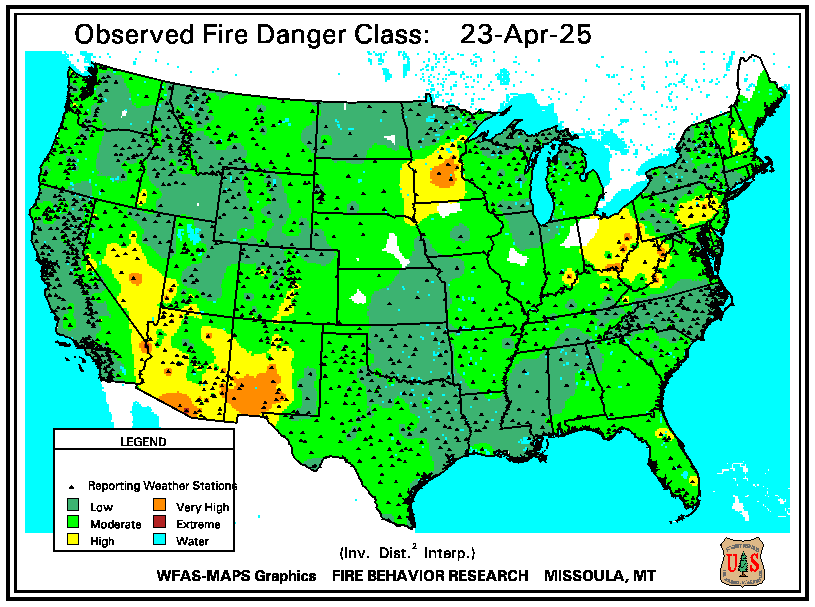
Description of Fire Danger Ratings
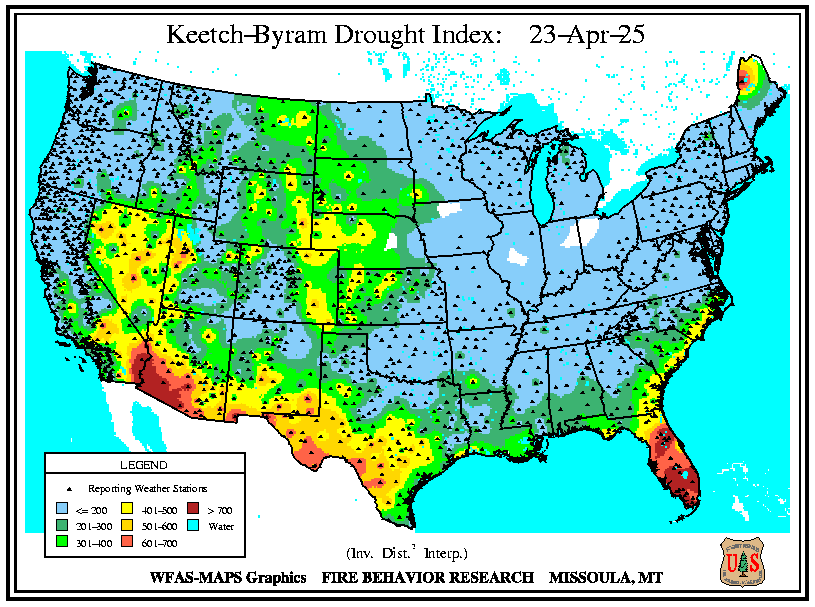
The Keetch-Byram Drought Index (KBDI) is a drought index that is specifically related to fire potential. The KDBI is broken into four categories which indicate the susceptibility of ground fuels to fire danger. Below are the four categories and a brief description of each.
Burn Bans: |
|||||||||||||
|
7-Day Total Precipitation Forecast from the Weather Prediction Center:
Days 1-7 Precipitation Forecasts from the Weather Prediction Center
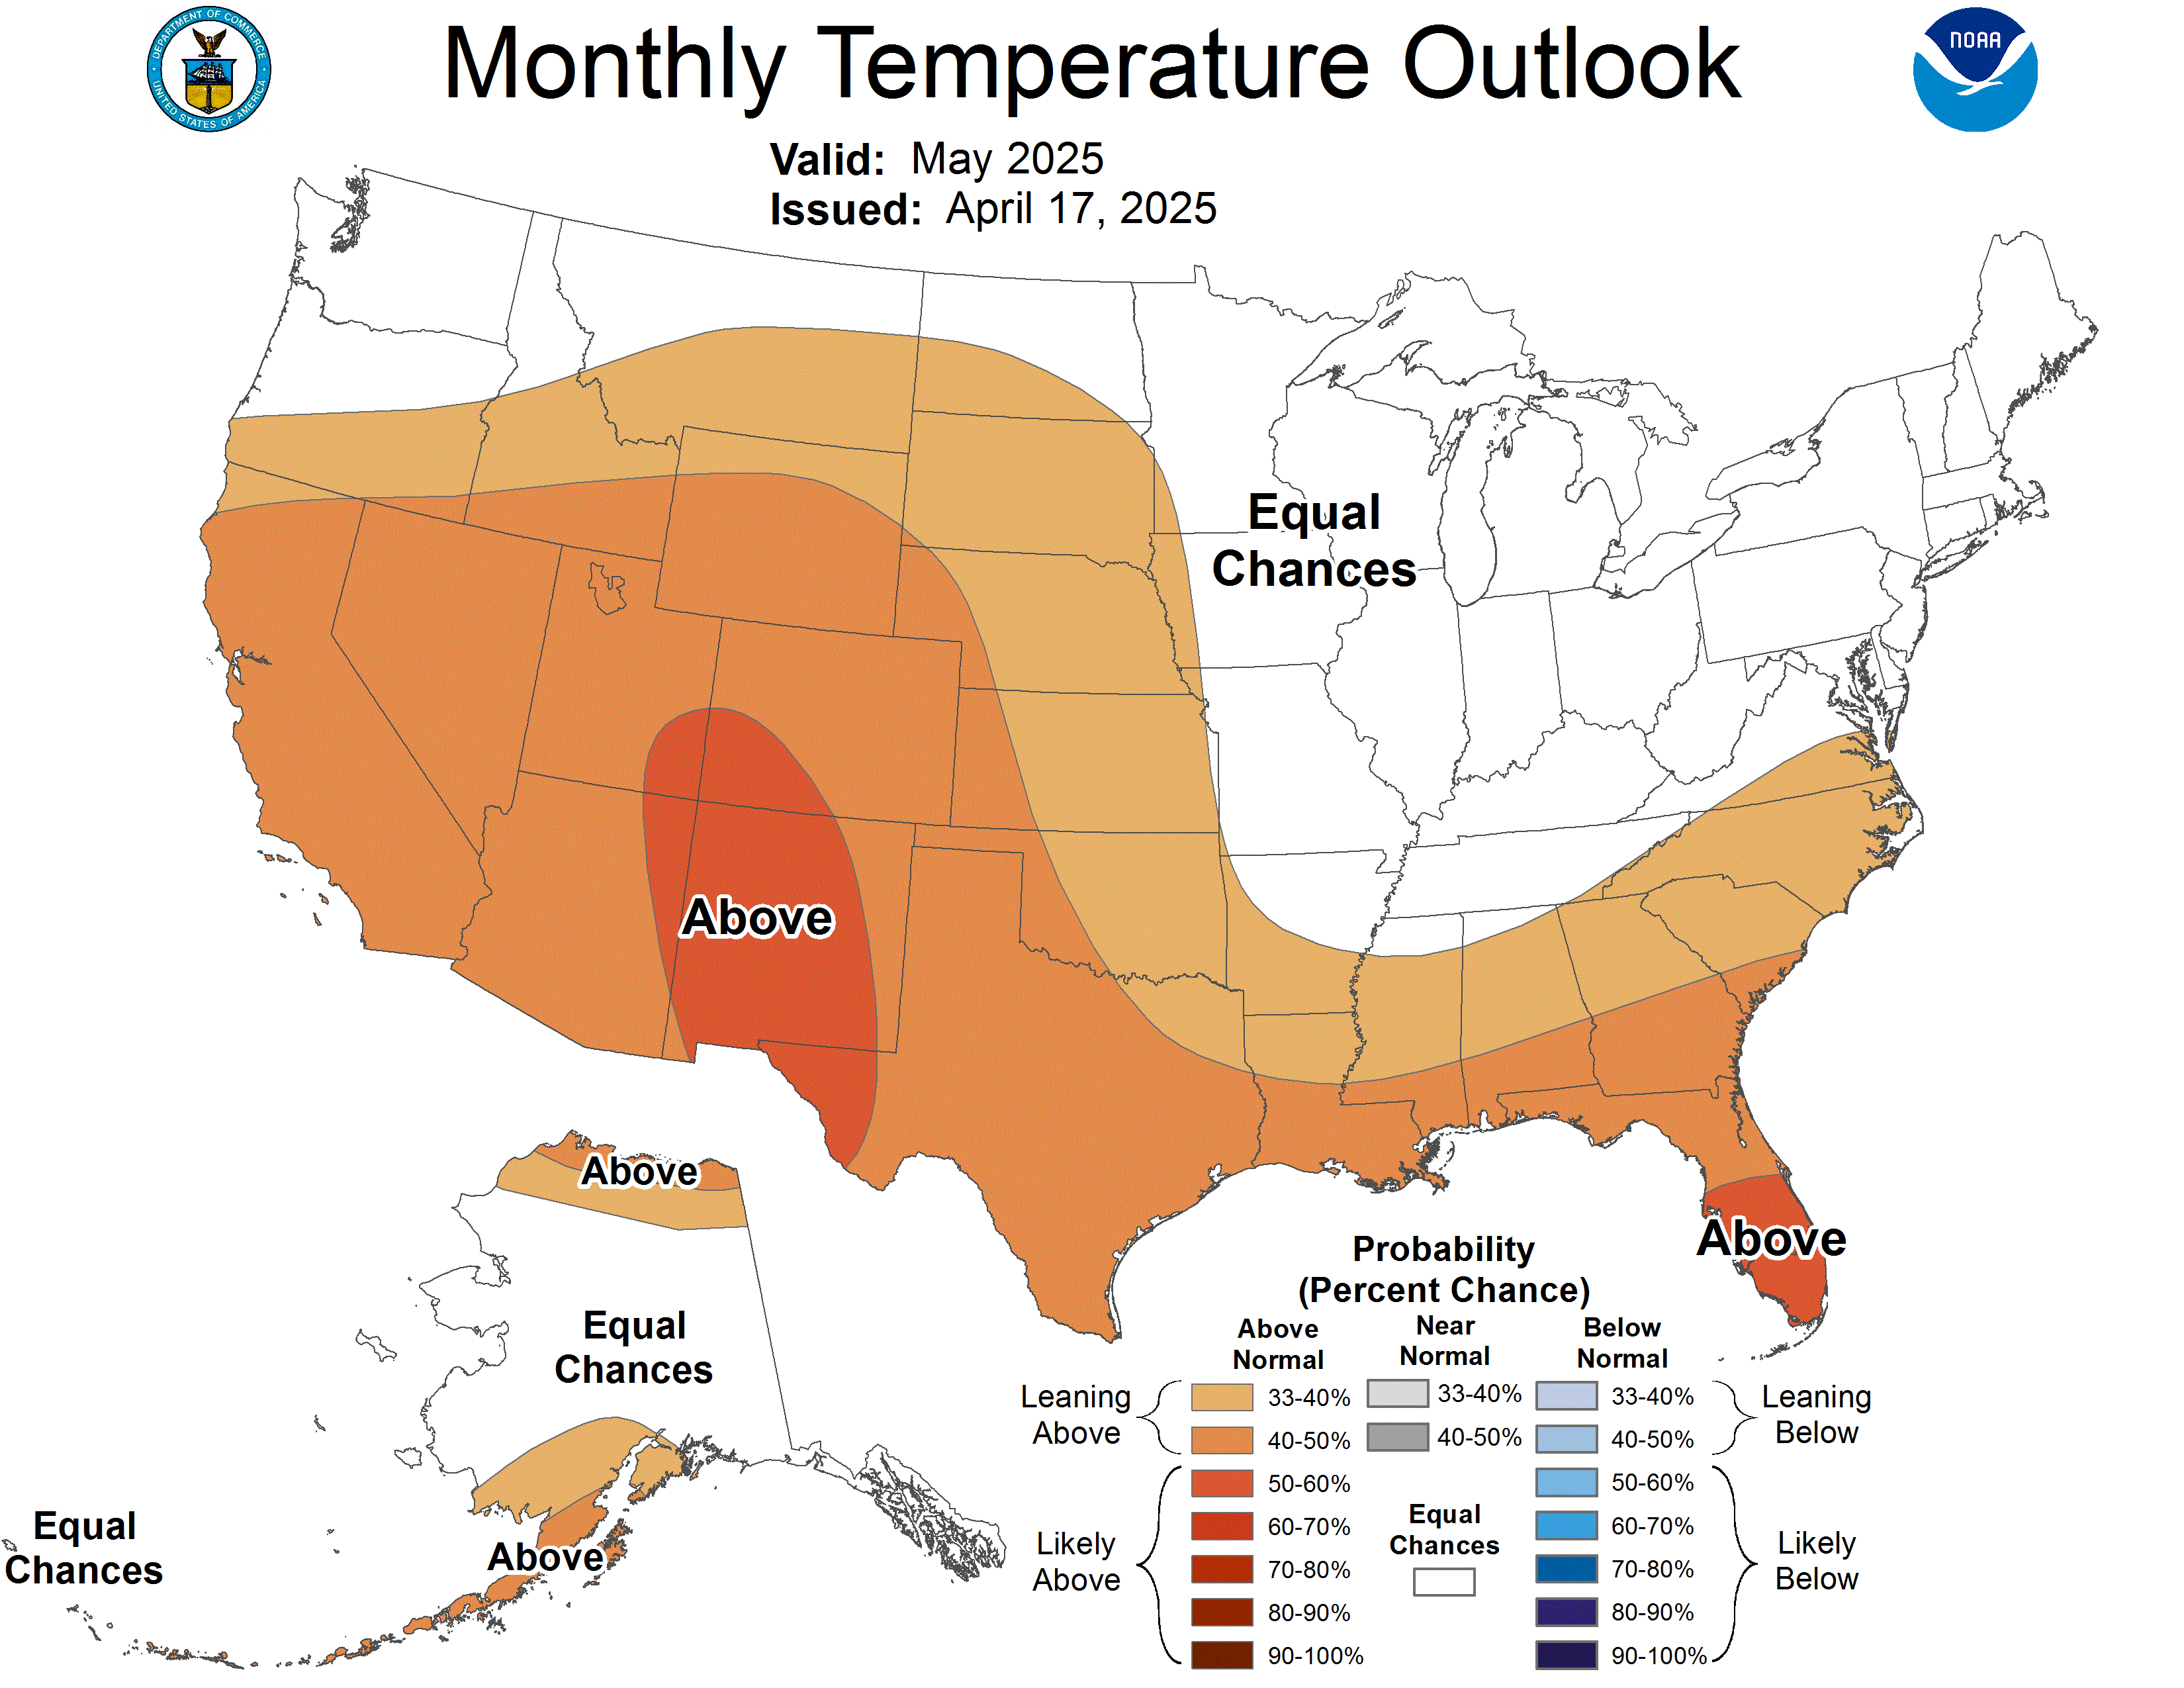
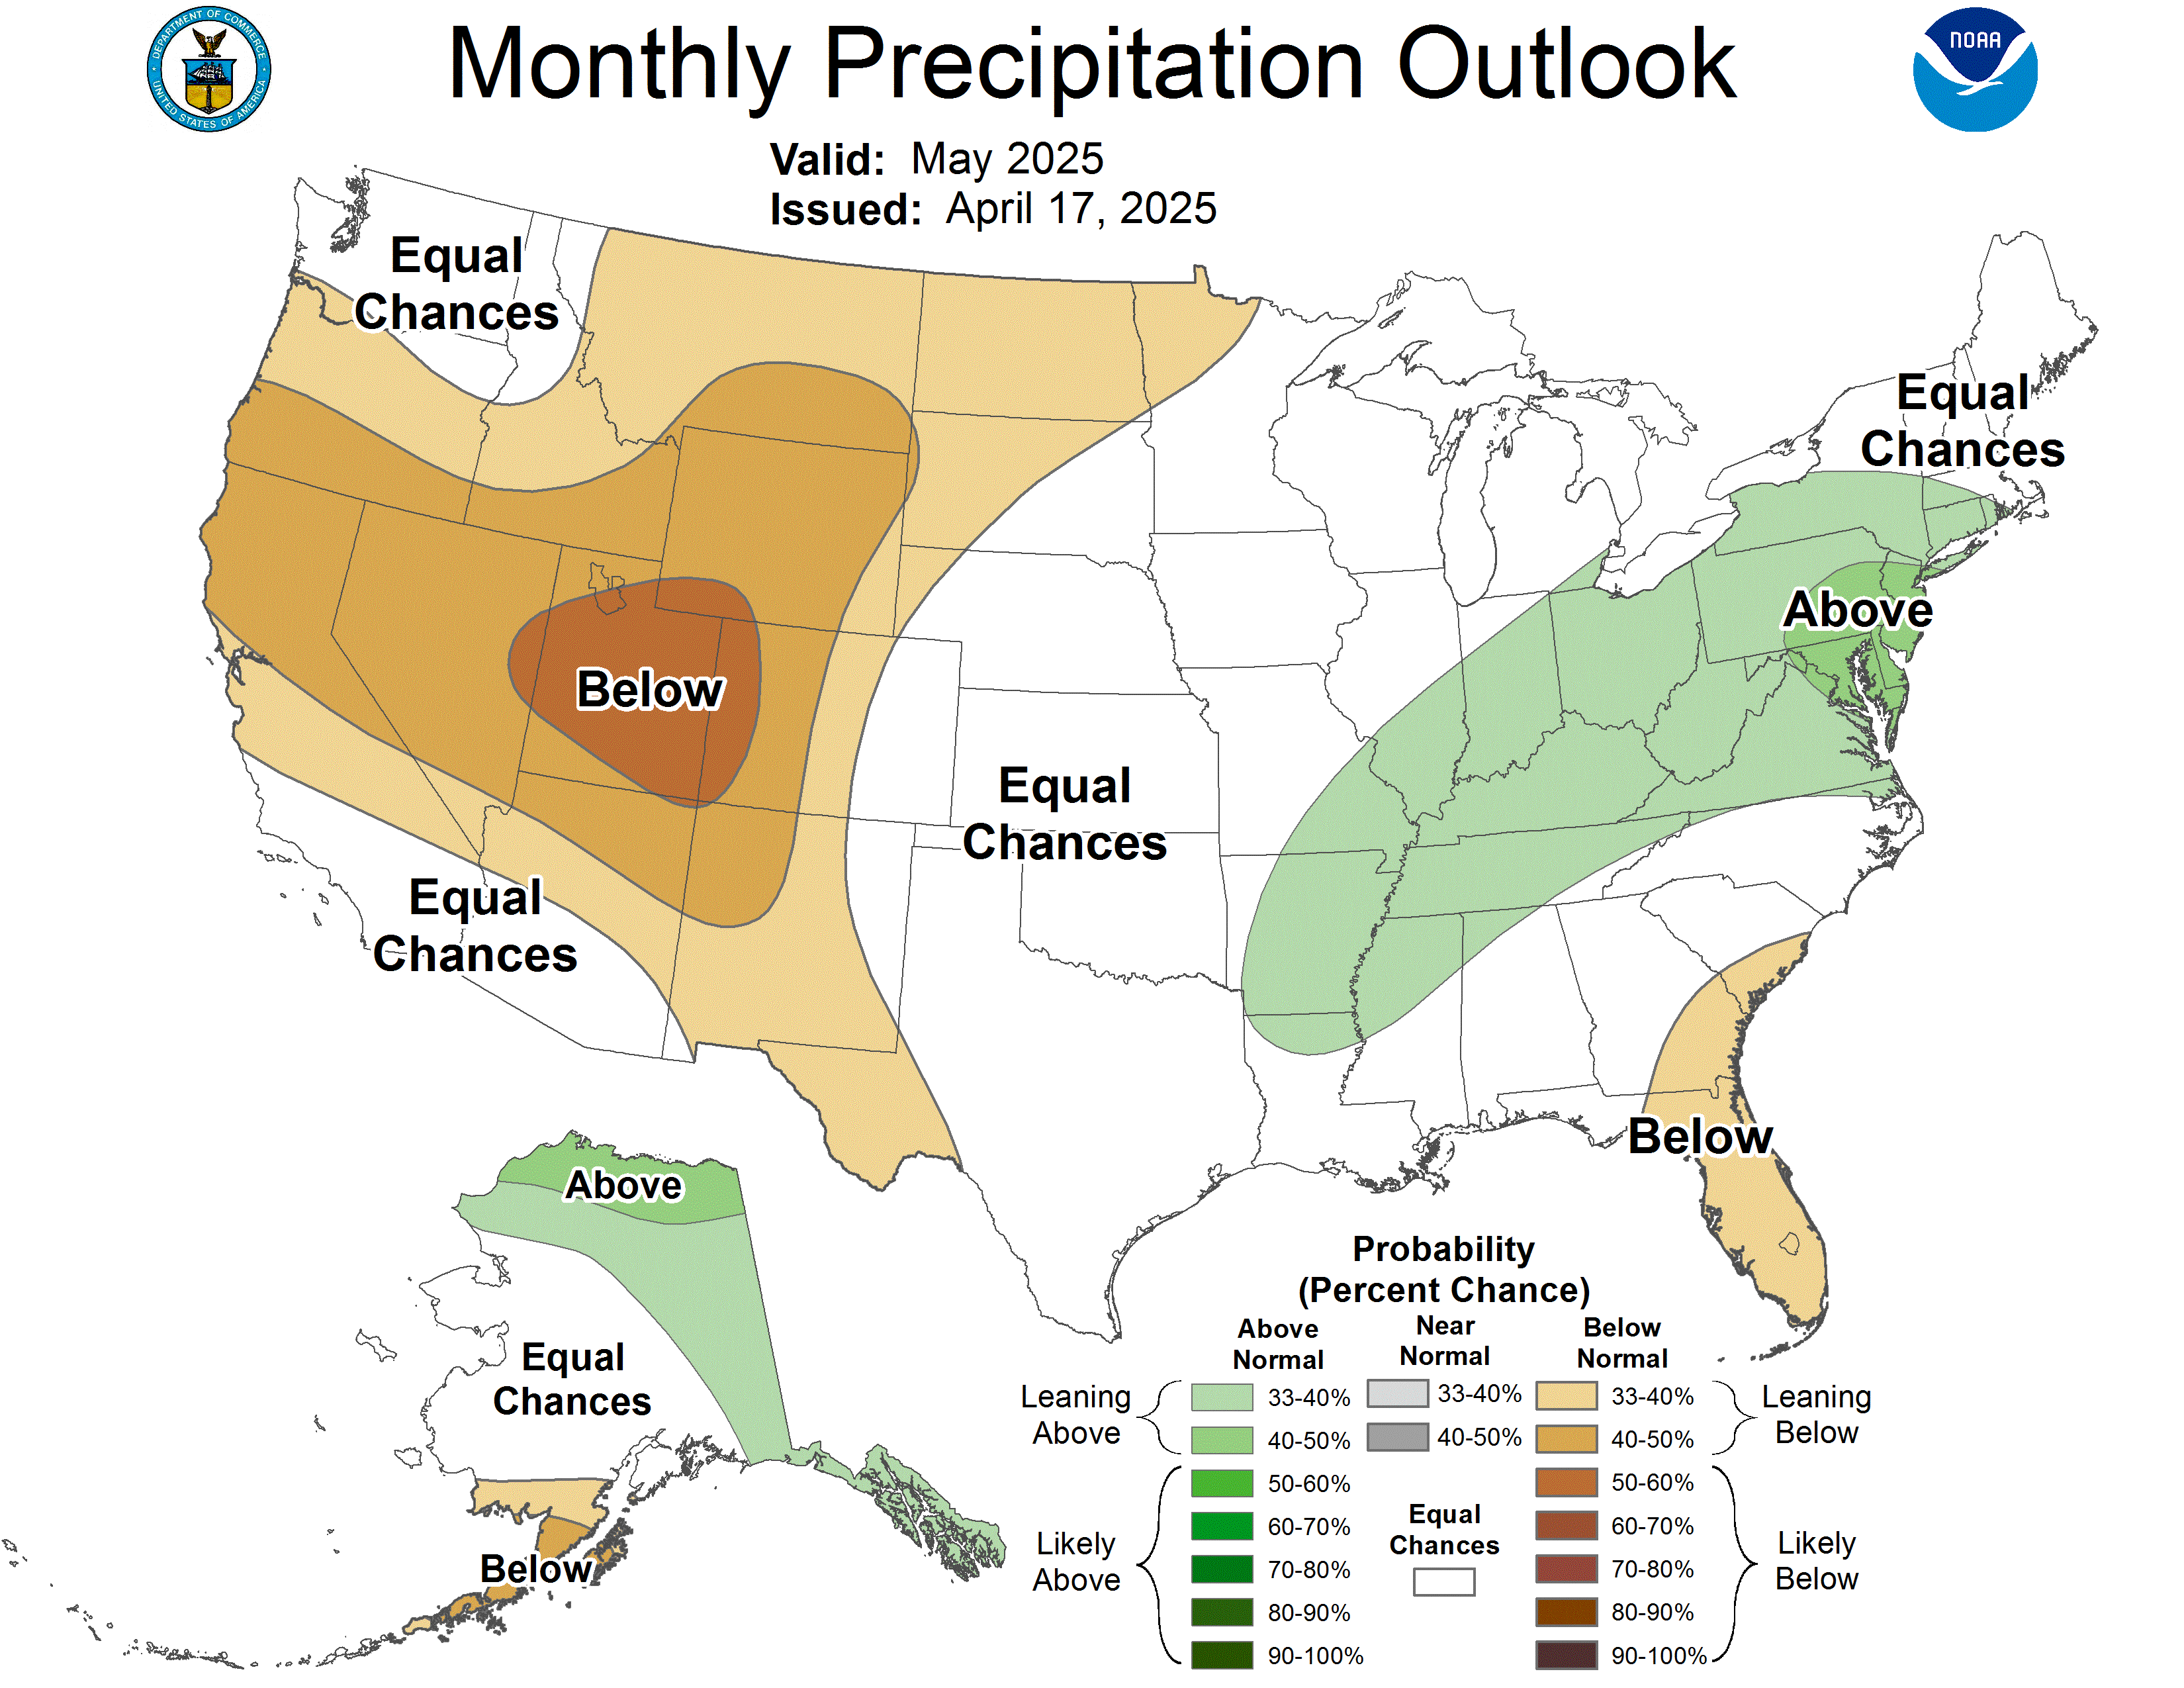
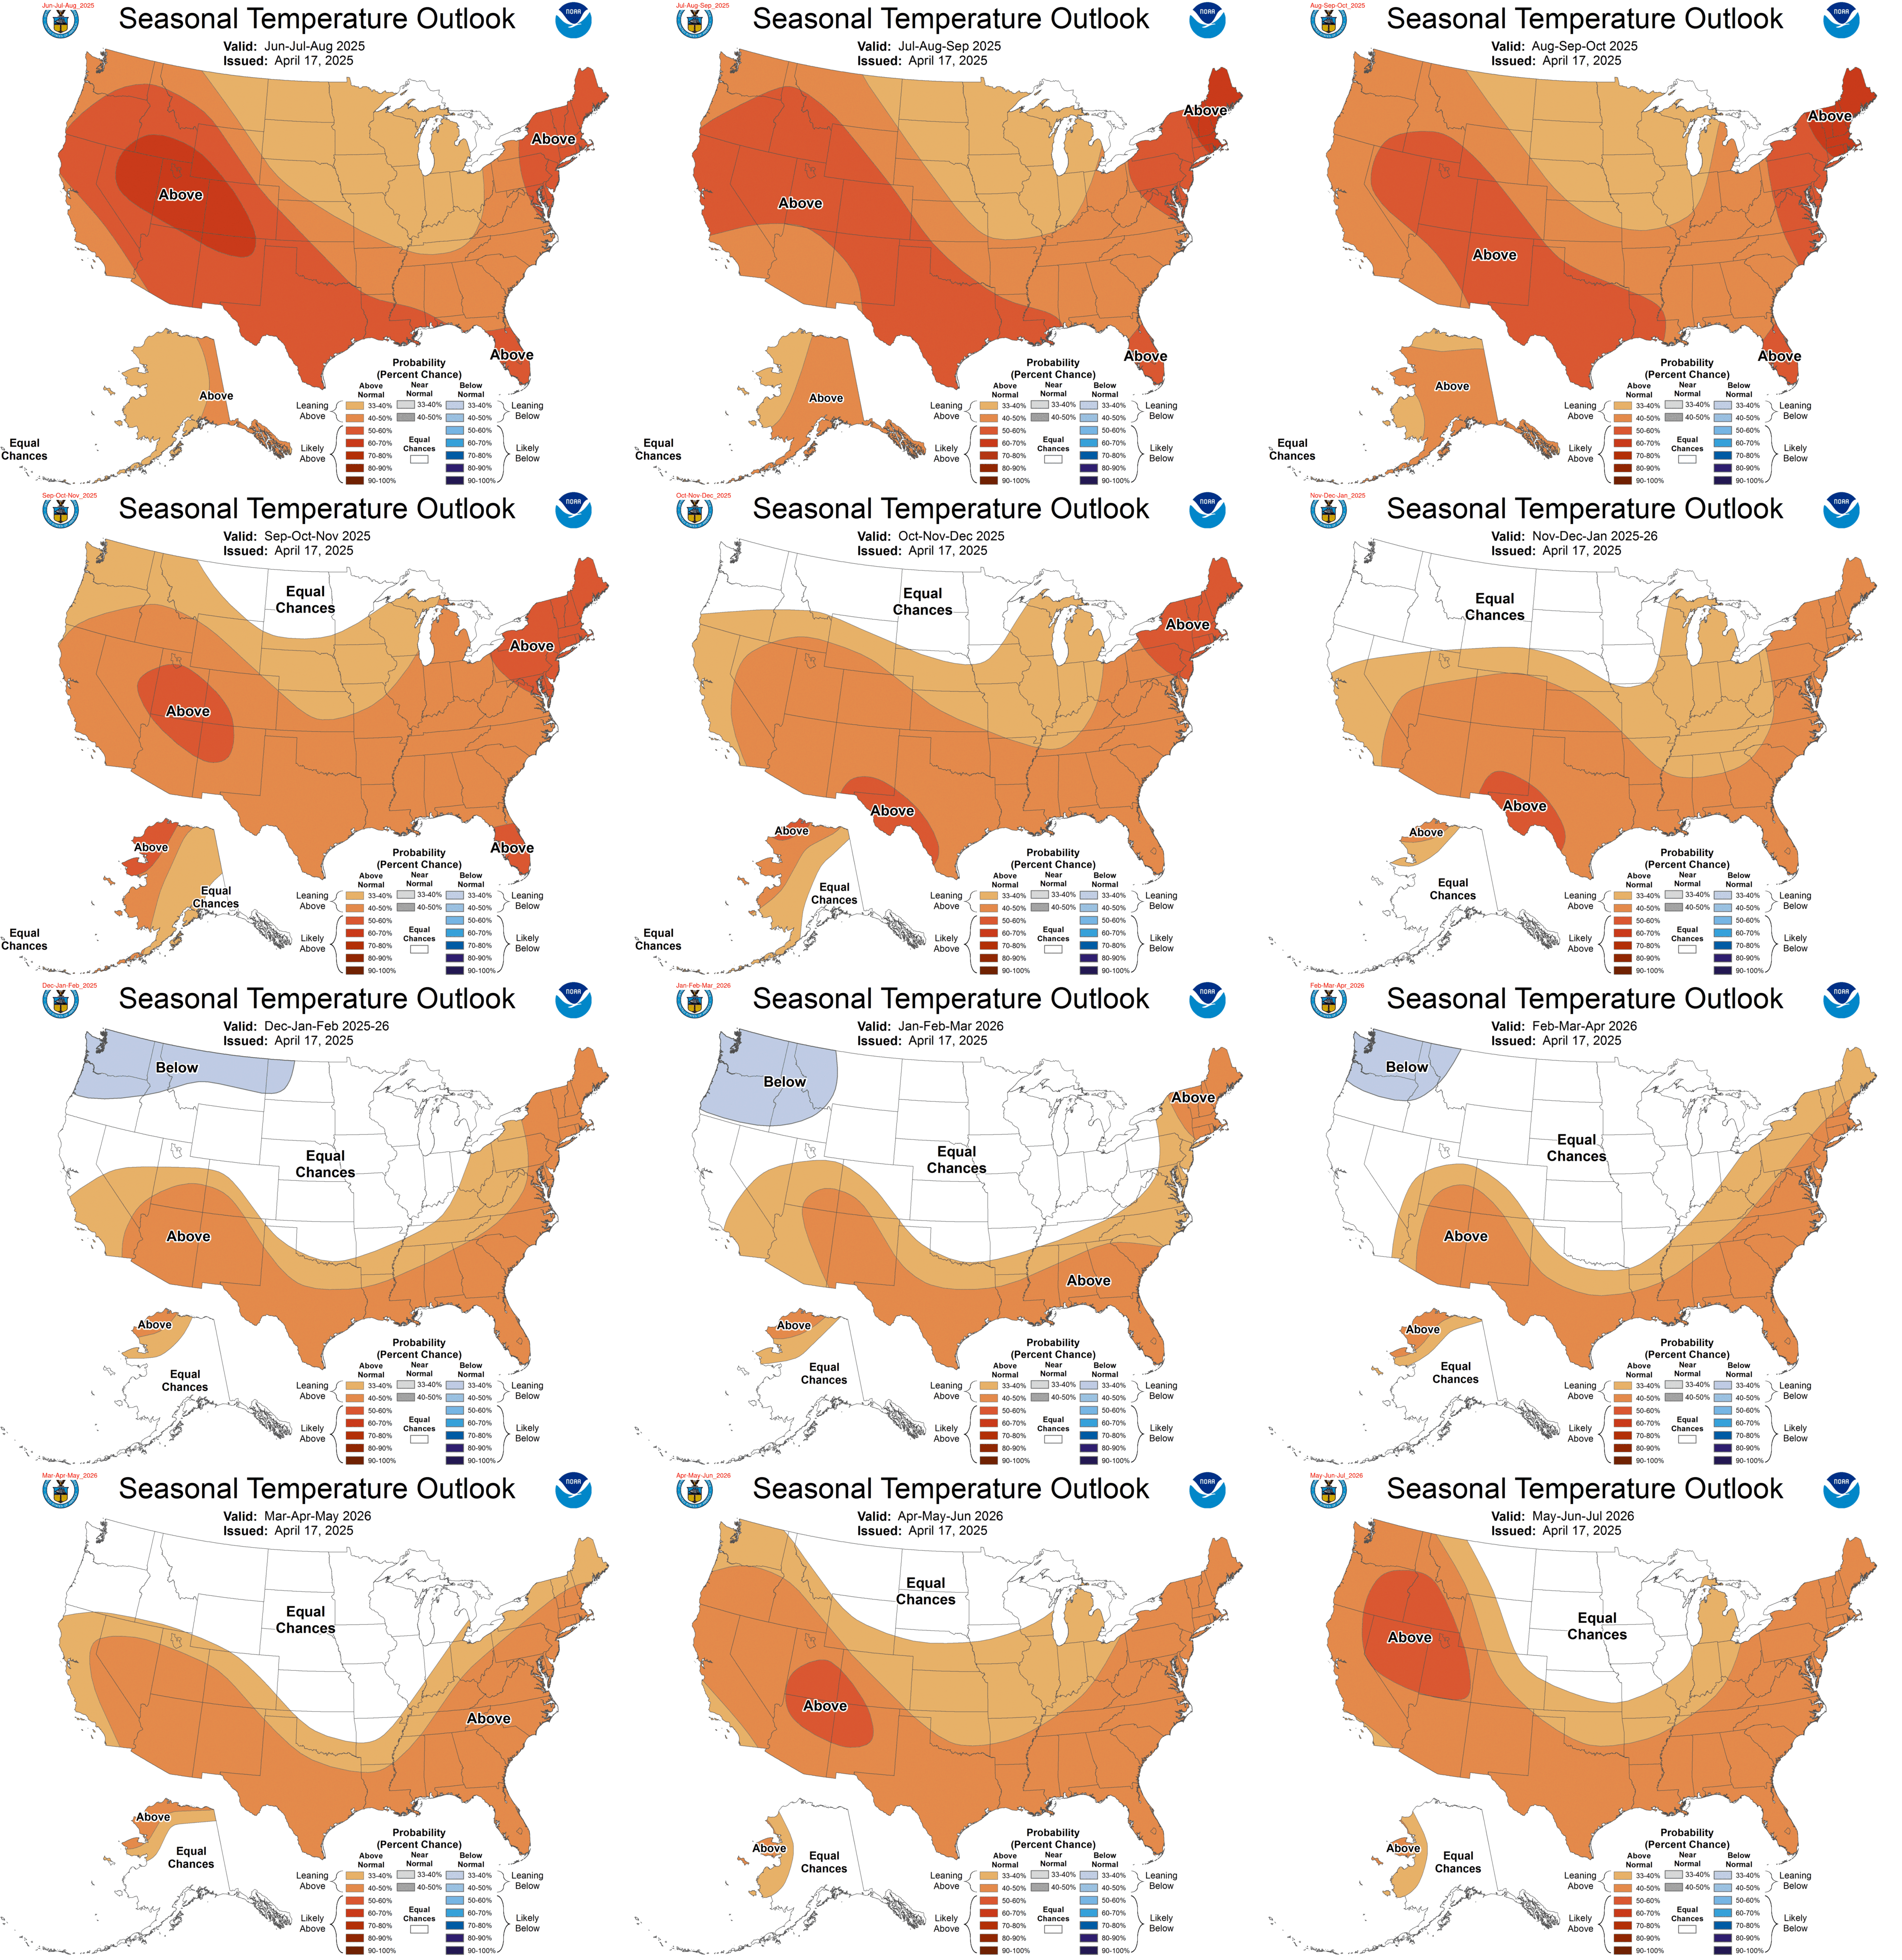
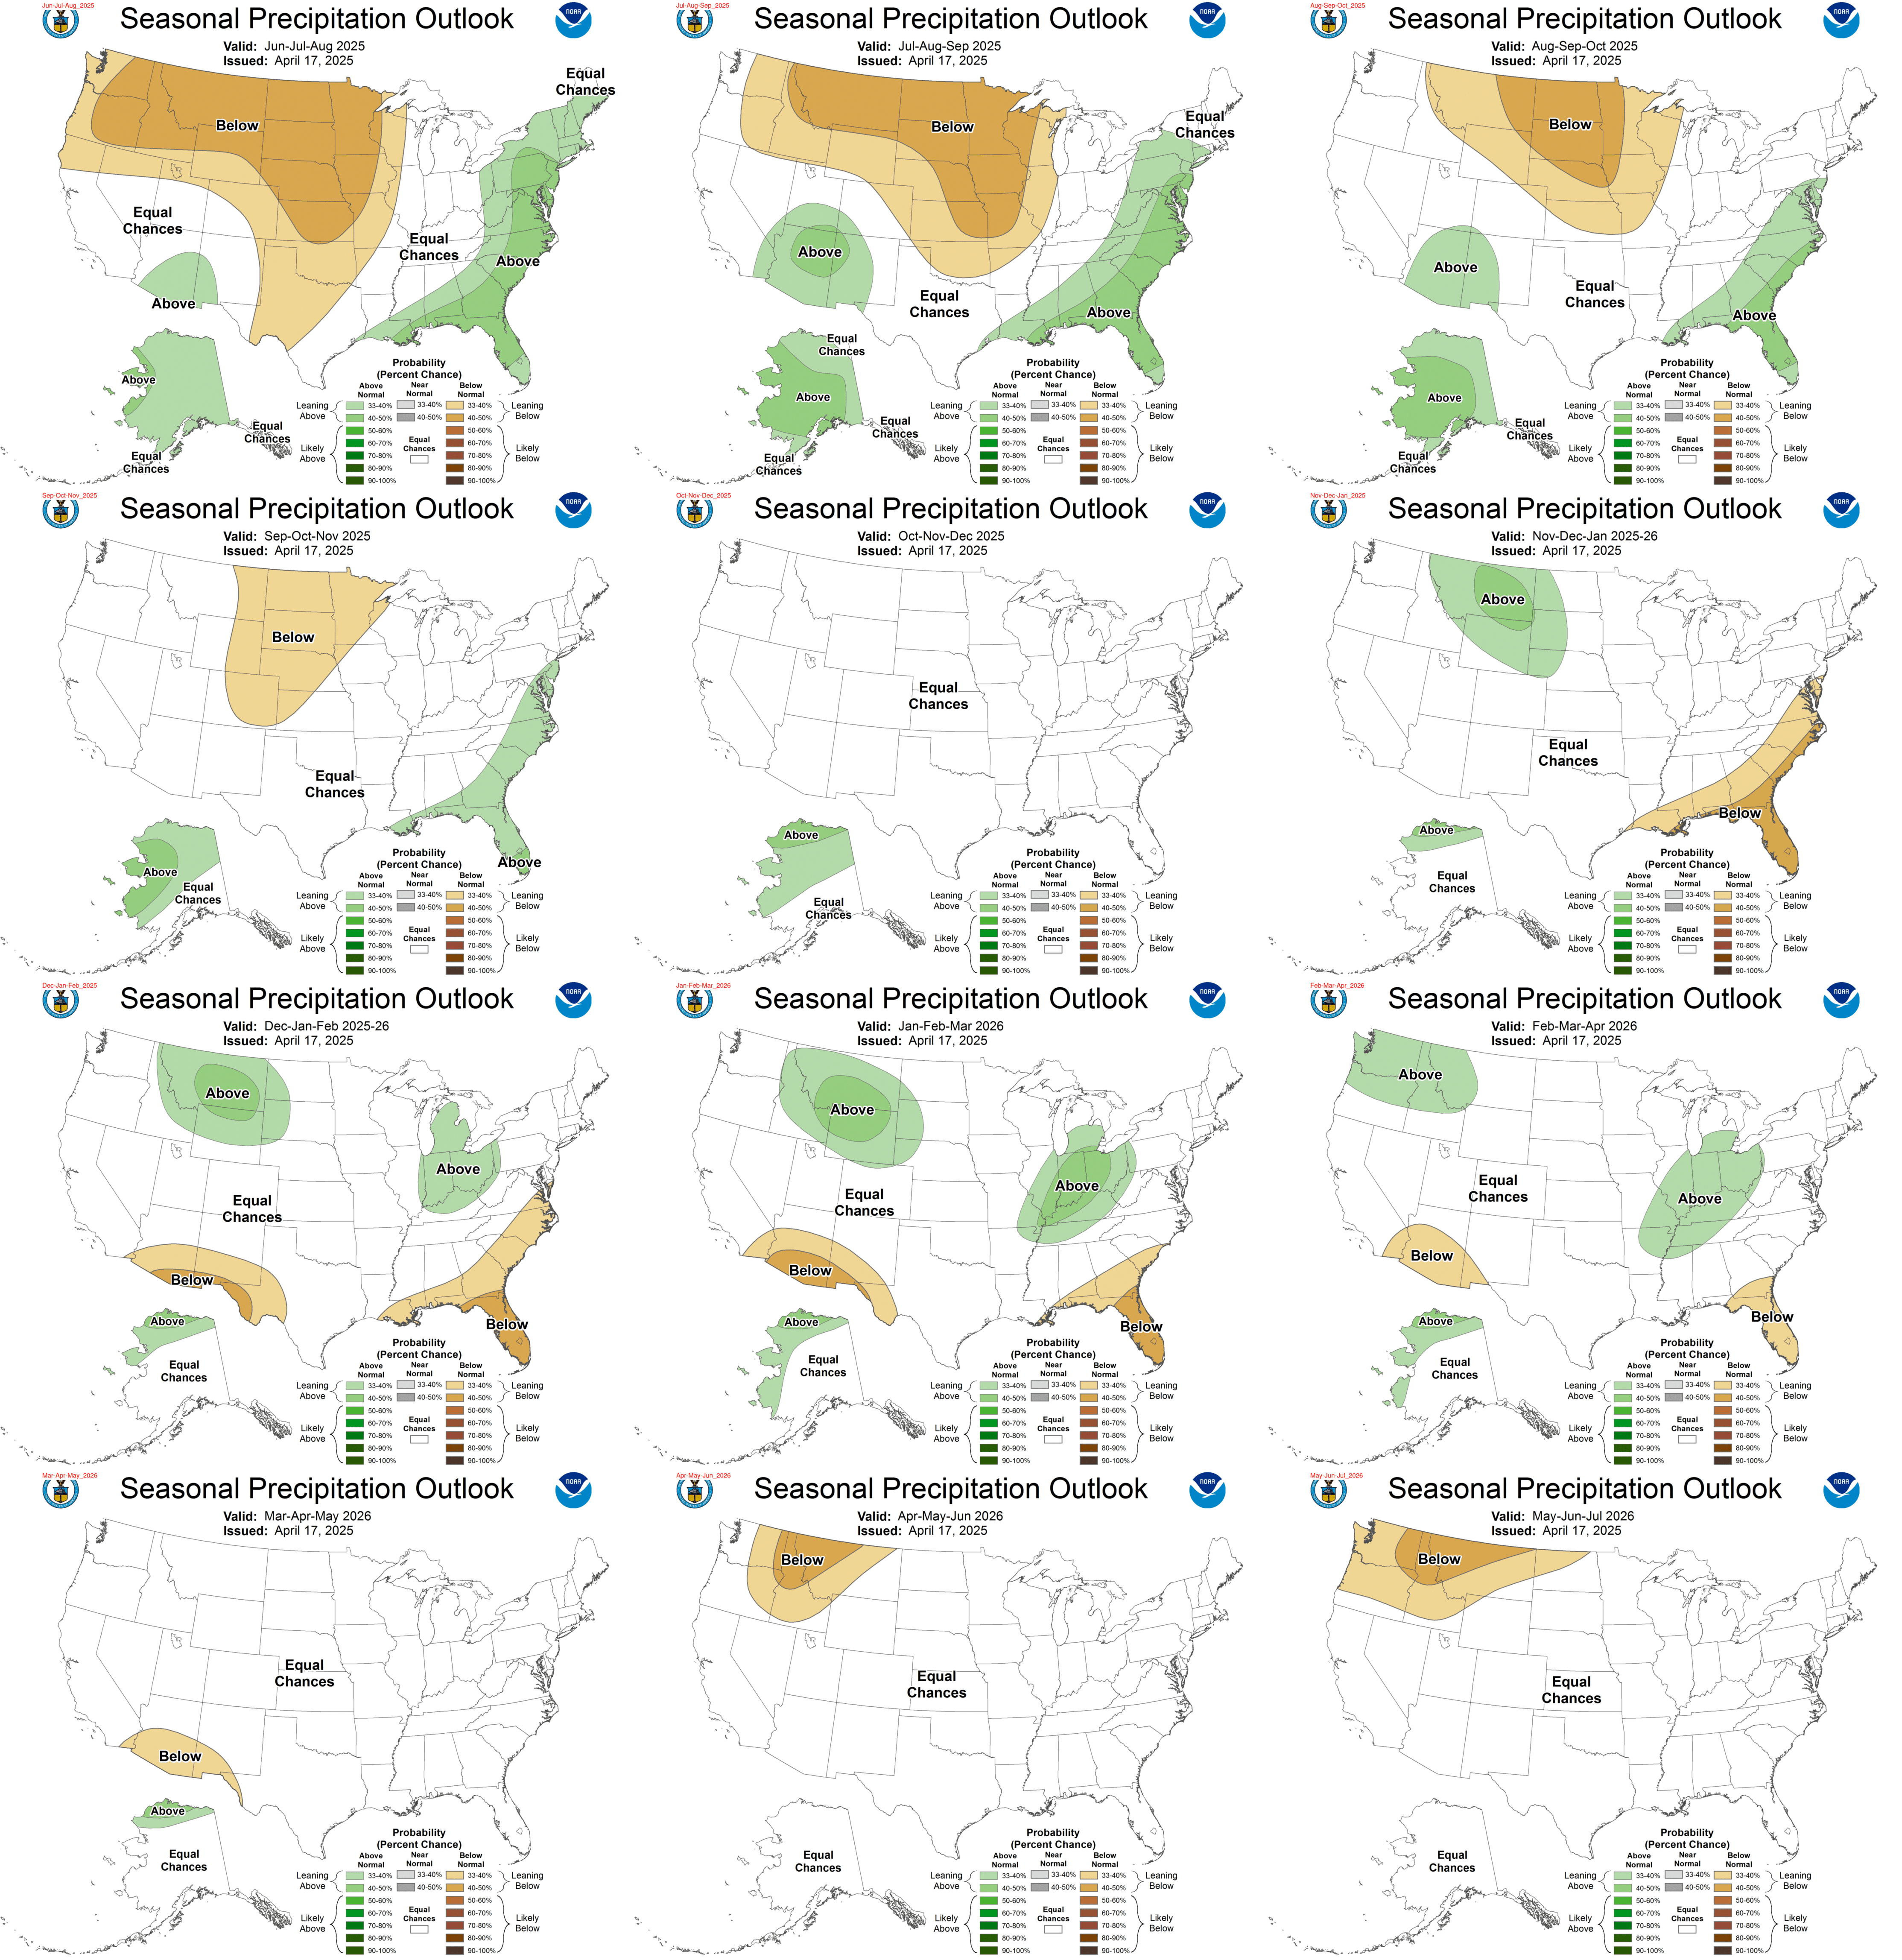
Long Term Outlooks
Below are the seasonal outlooks for the next year from the Climate Prediction Center:
|
For updated temperature and precipitation probabilities consult the following Climate Prediction Center (CPC) Web Sites:
Model Data:
|
|||||||||||||||||||||||||||||||||
|
If you have any questions or comments about this drought information E-mail: nws.louisville@noaa.gov |
Other Contacts: State climate impacts: |
|


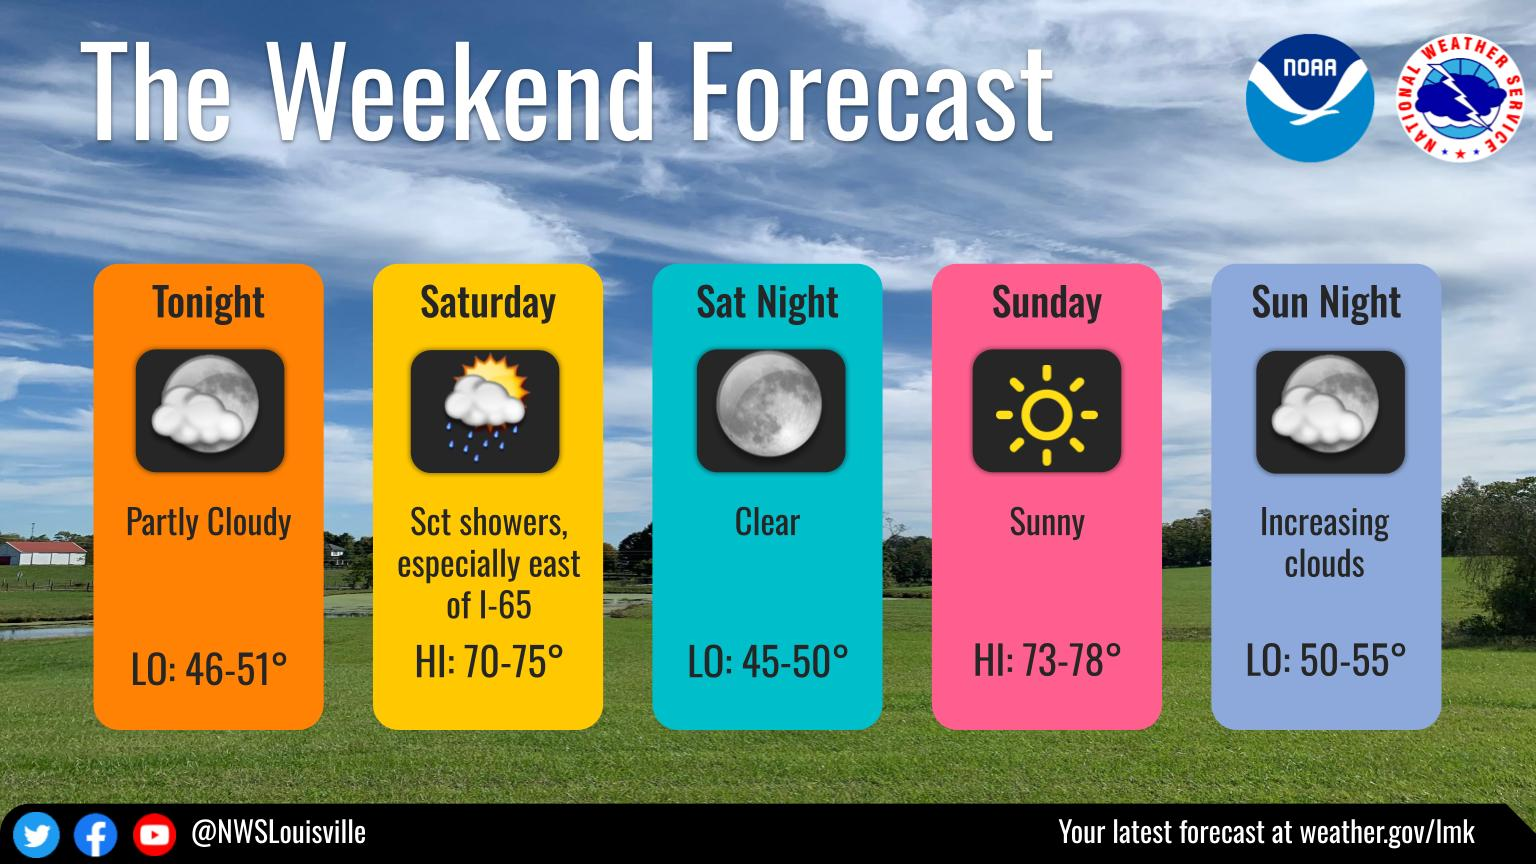 Weather Story
 Weather Map
 Local Radar
