Overview
|
On the night of March 30th, 2025 and the early morning of March 31st, 2025, a strong QLCS moved through the Ohio Valley bringing widespread wind damage, hail, and multiple tornadoes. |
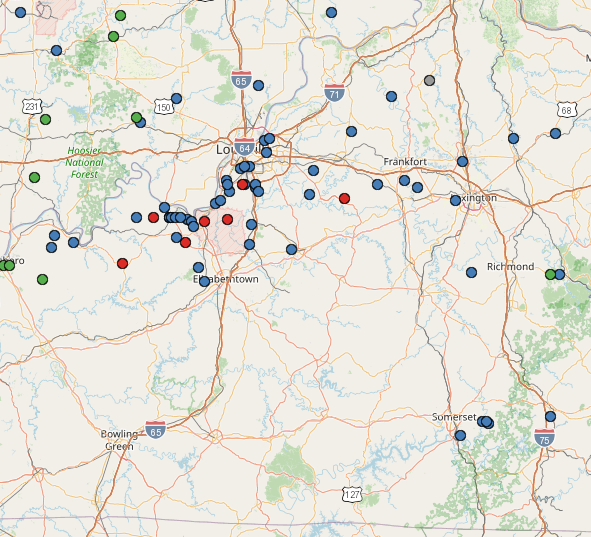
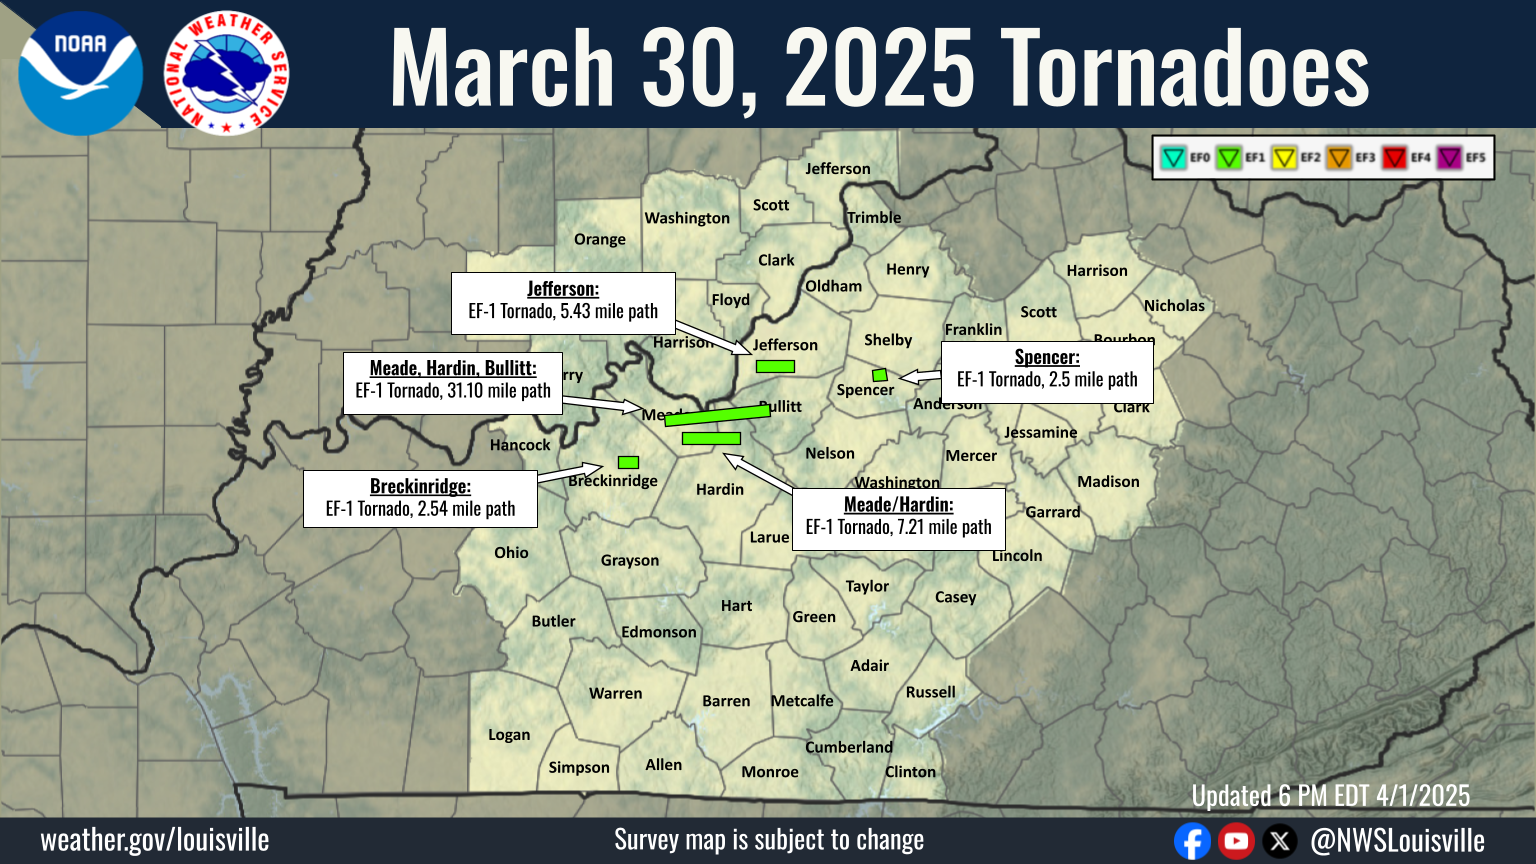 Map of all tornado paths from the March 30, 2025 event. |
Tornadoes:
|
Tornado - Harned, Kentucky
Track Map 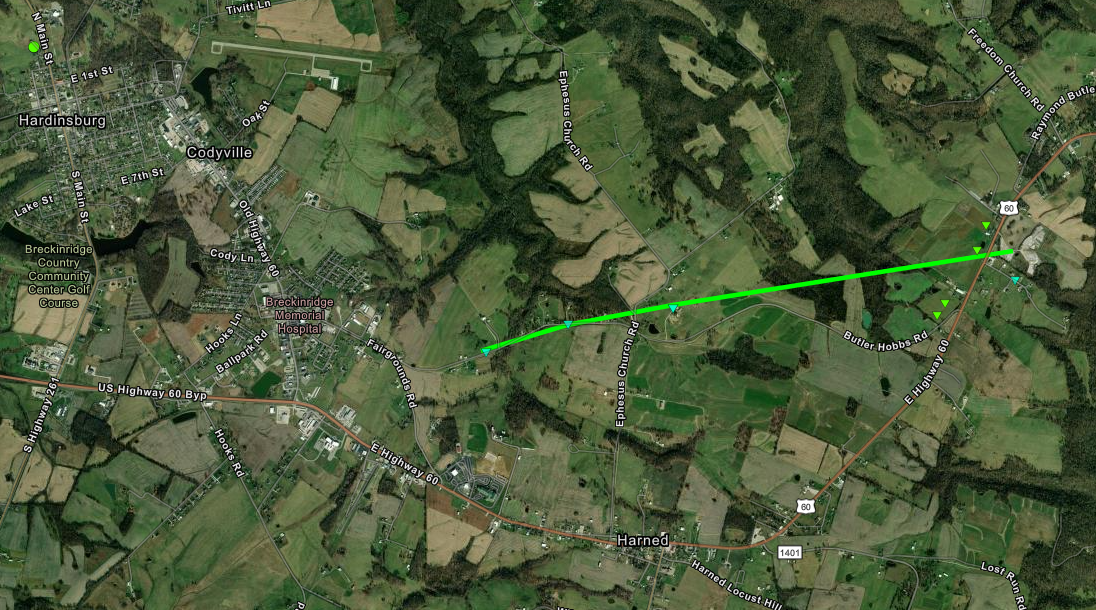 
Downloadable KMZ File |
||||||||||||||||
|
Tornado - Midway/Doe Valley, Kentucky
Track Map 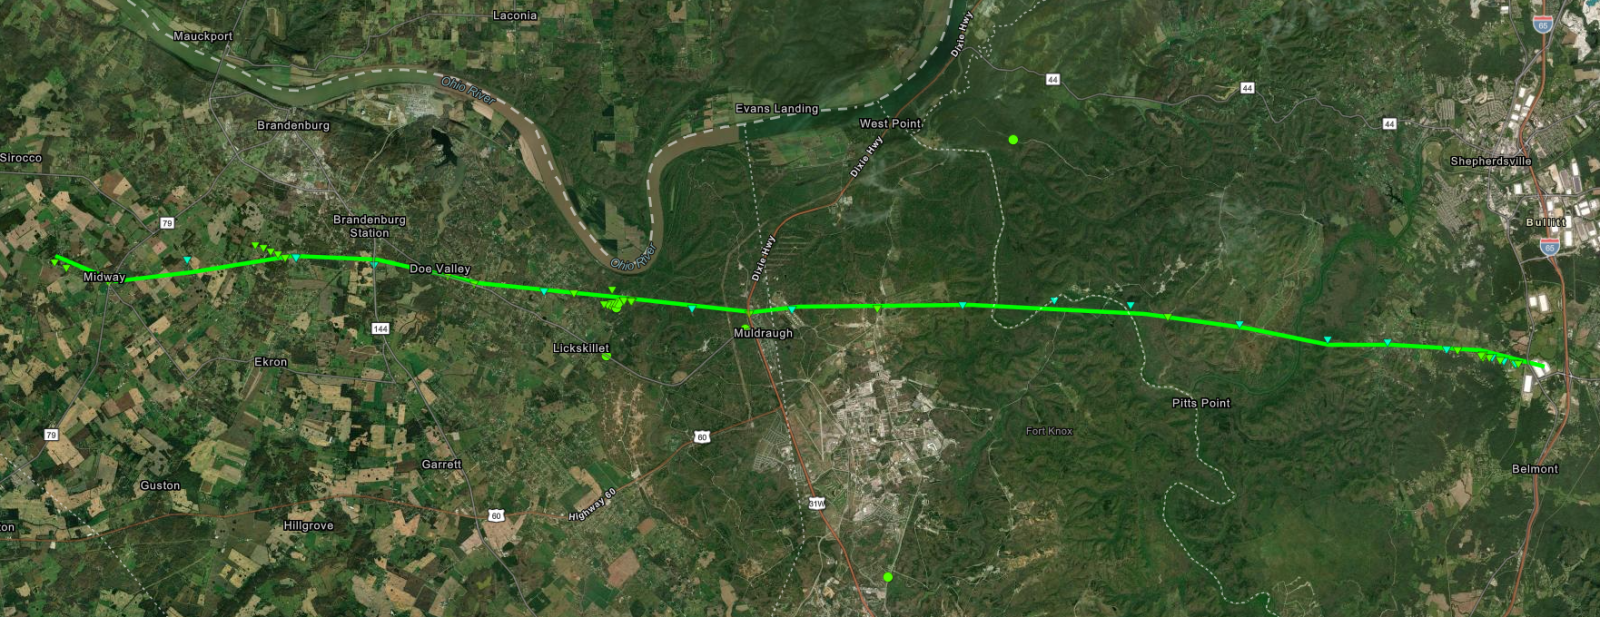
Downloadable KMZ File |
||||||||||||||||
|
Tornado - Radcliff, Kentucky
Track Map 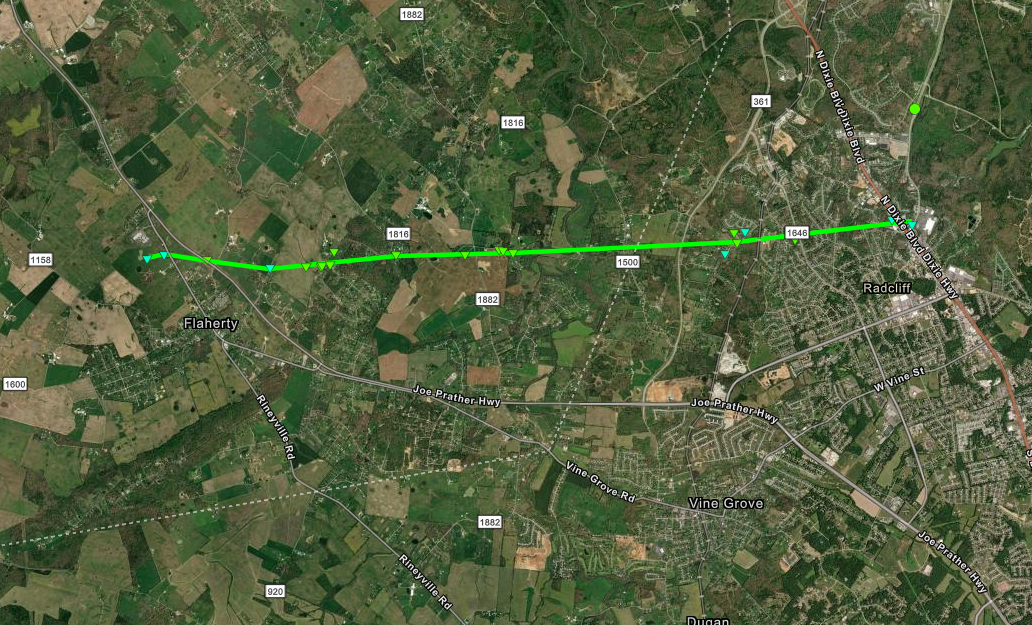
Downloadable KMZ File |
||||||||||||||||
|
Tornado - Fairdale, Kentucky
Track Map 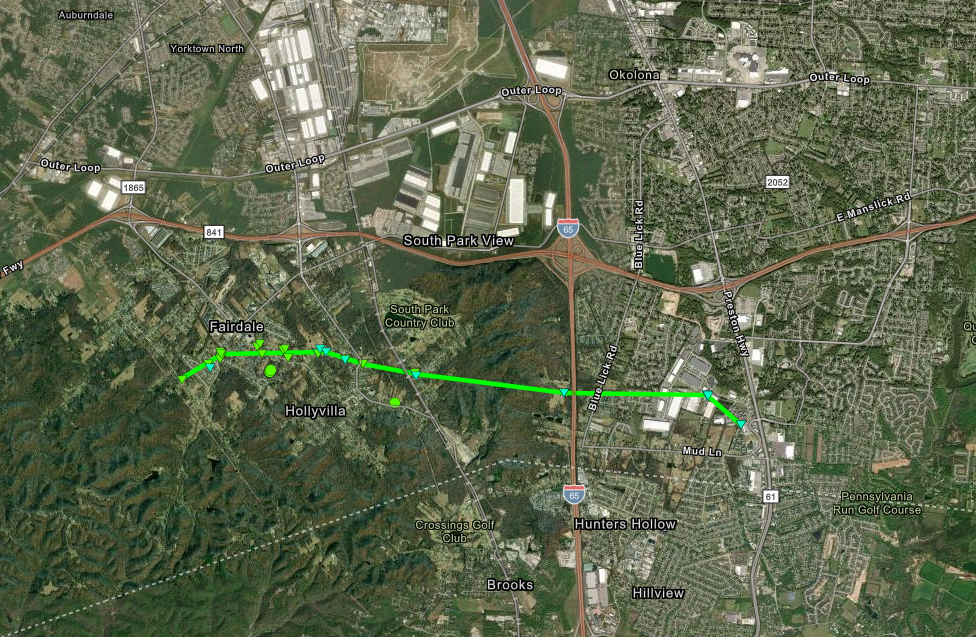
Downloadable KMZ File |
||||||||||||||||
|
Tornado - Mt. Eden, Kentucky
Track Map 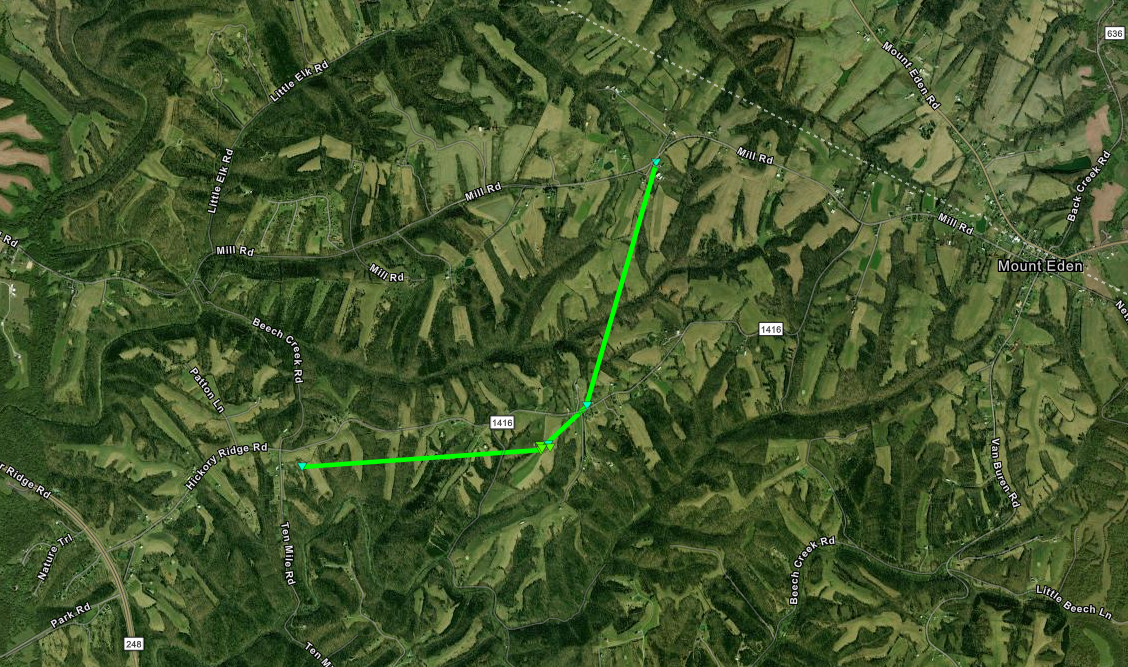
Downloadable KMZ File |
||||||||||||||||
The Enhanced Fujita (EF) Scale classifies tornadoes into the following categories:
| EF0 Weak 65-85 mph |
EF1 Moderate 86-110 mph |
EF2 Significant 111-135 mph |
EF3 Severe 136-165 mph |
EF4 Extreme 166-200 mph |
EF5 Catastrophic 200+ mph |
 |
|||||
Photos & Video
 |
 |
 |
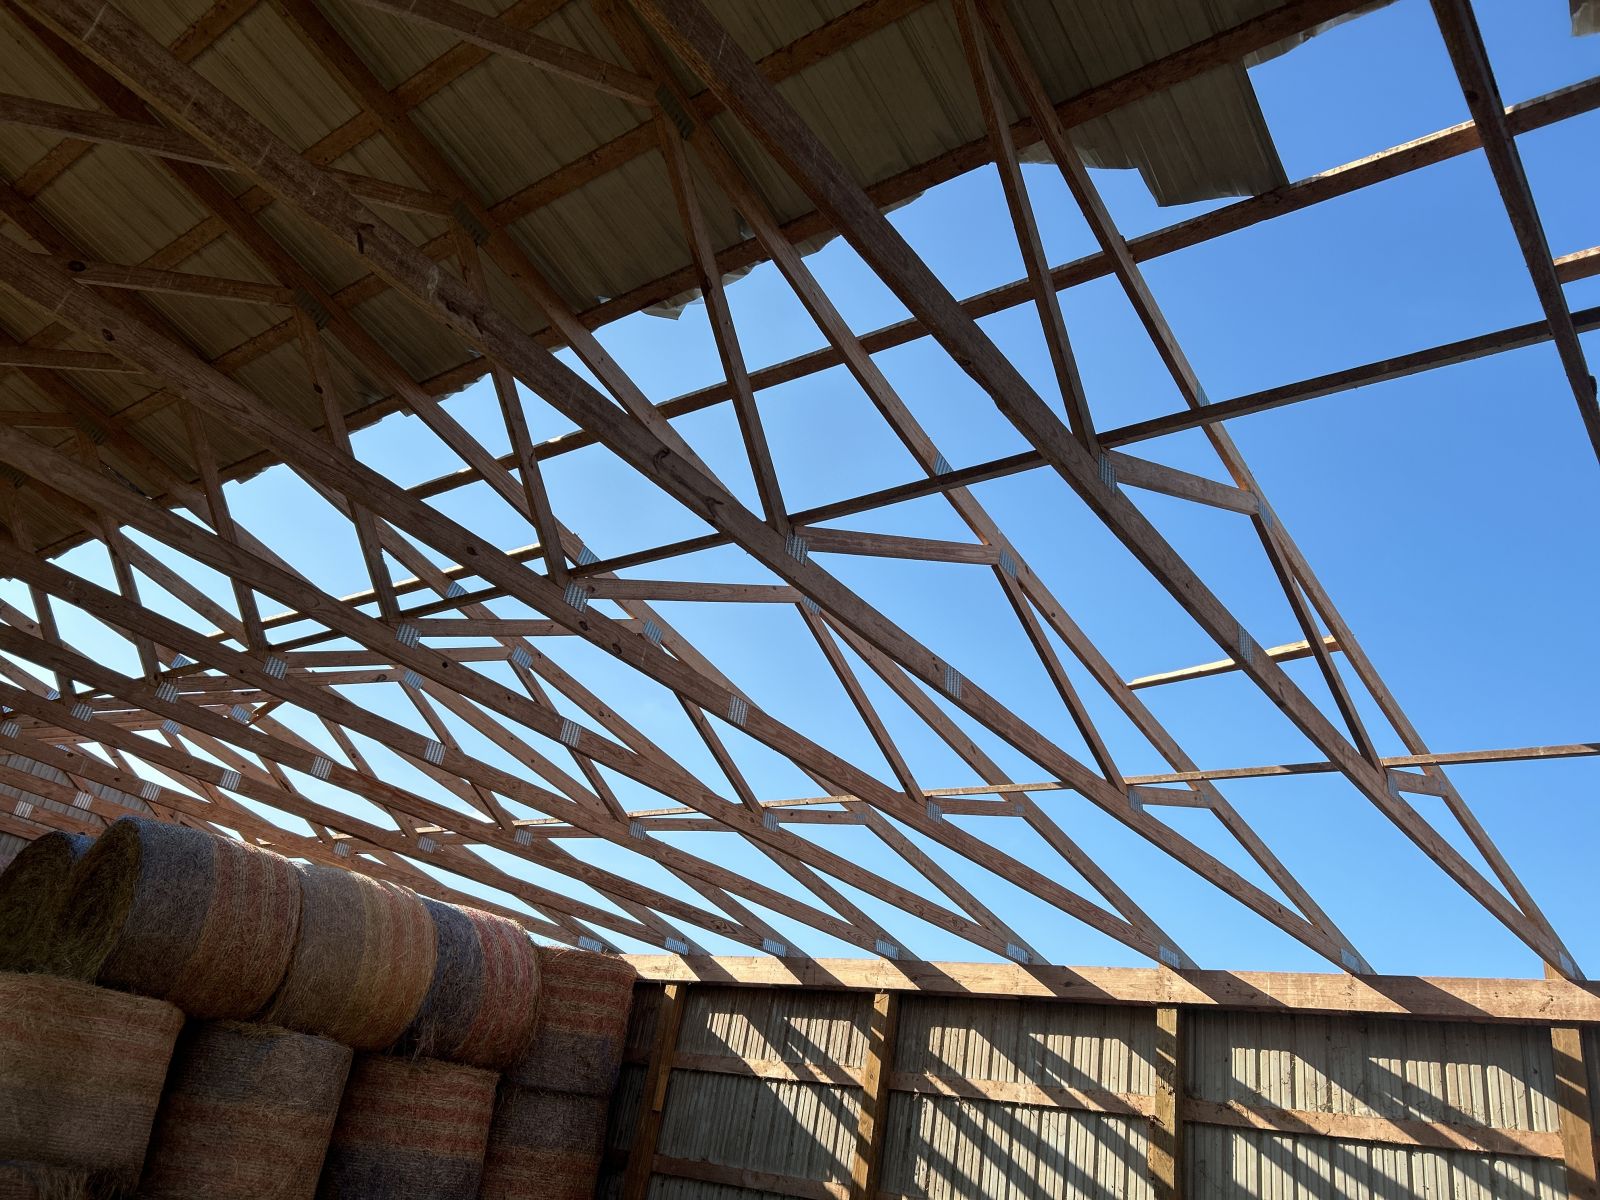 |
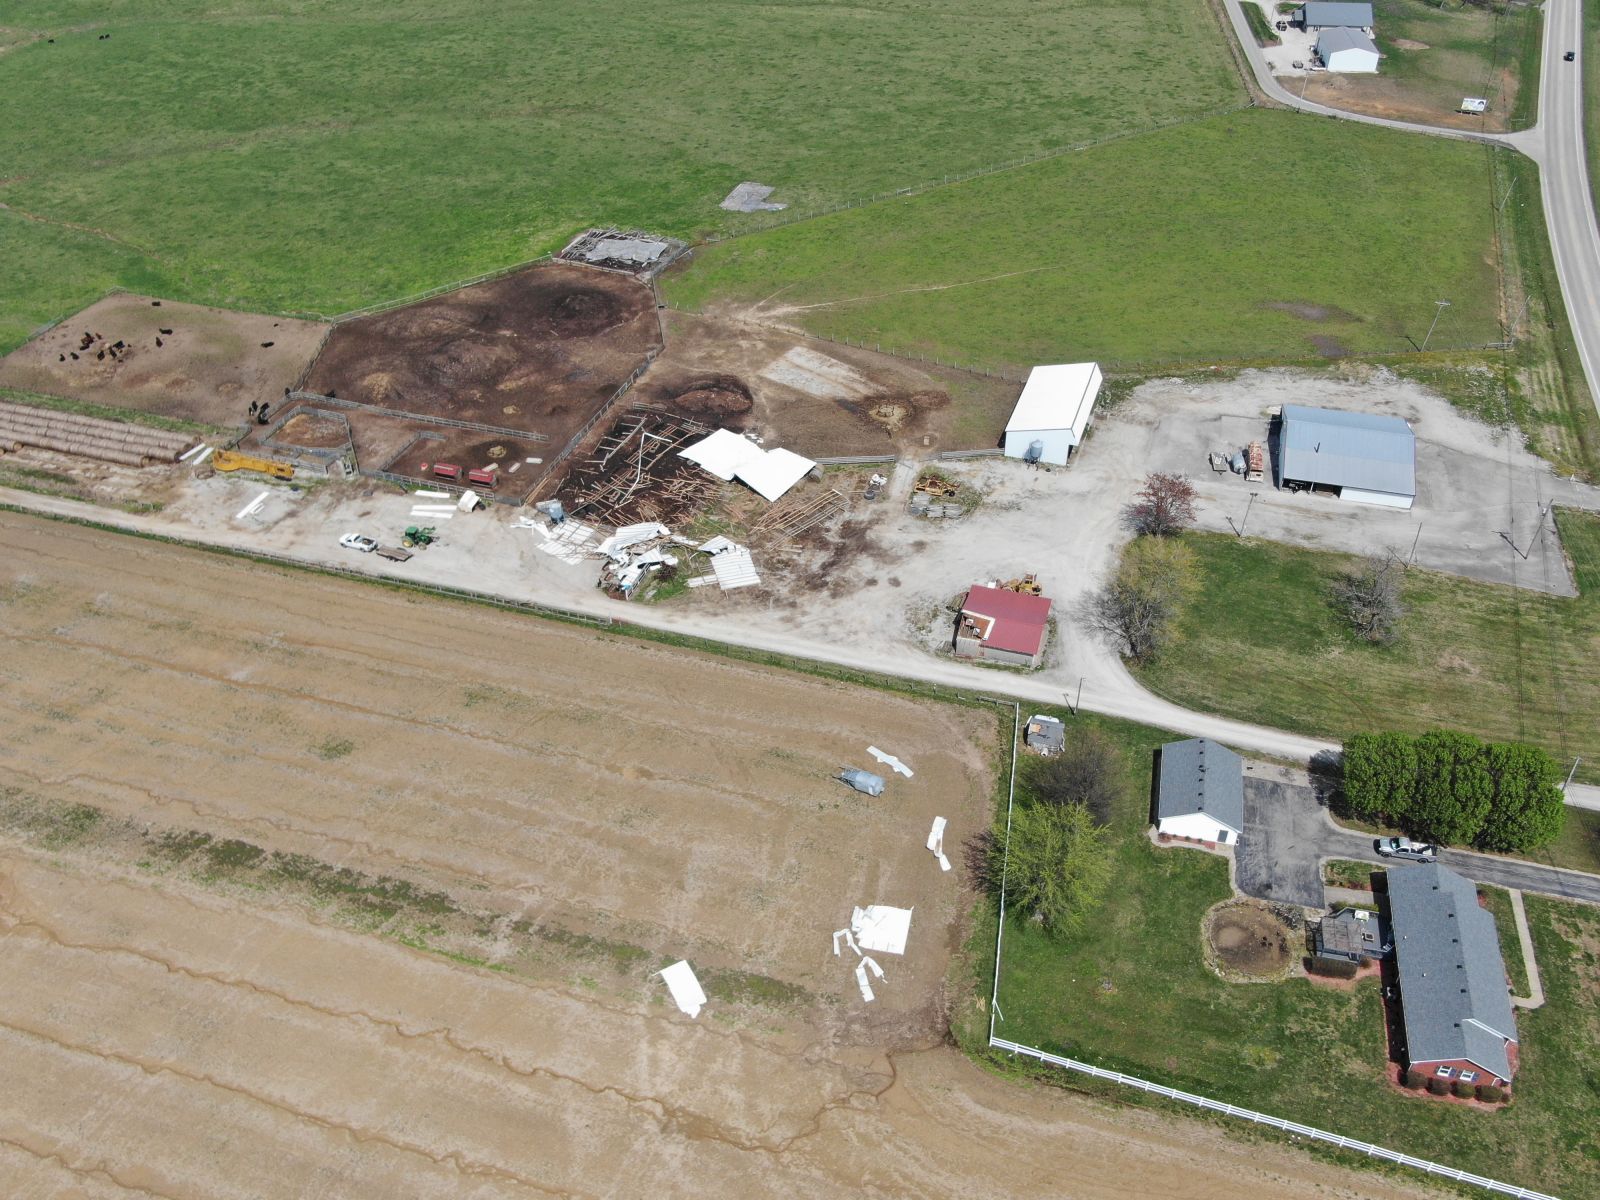
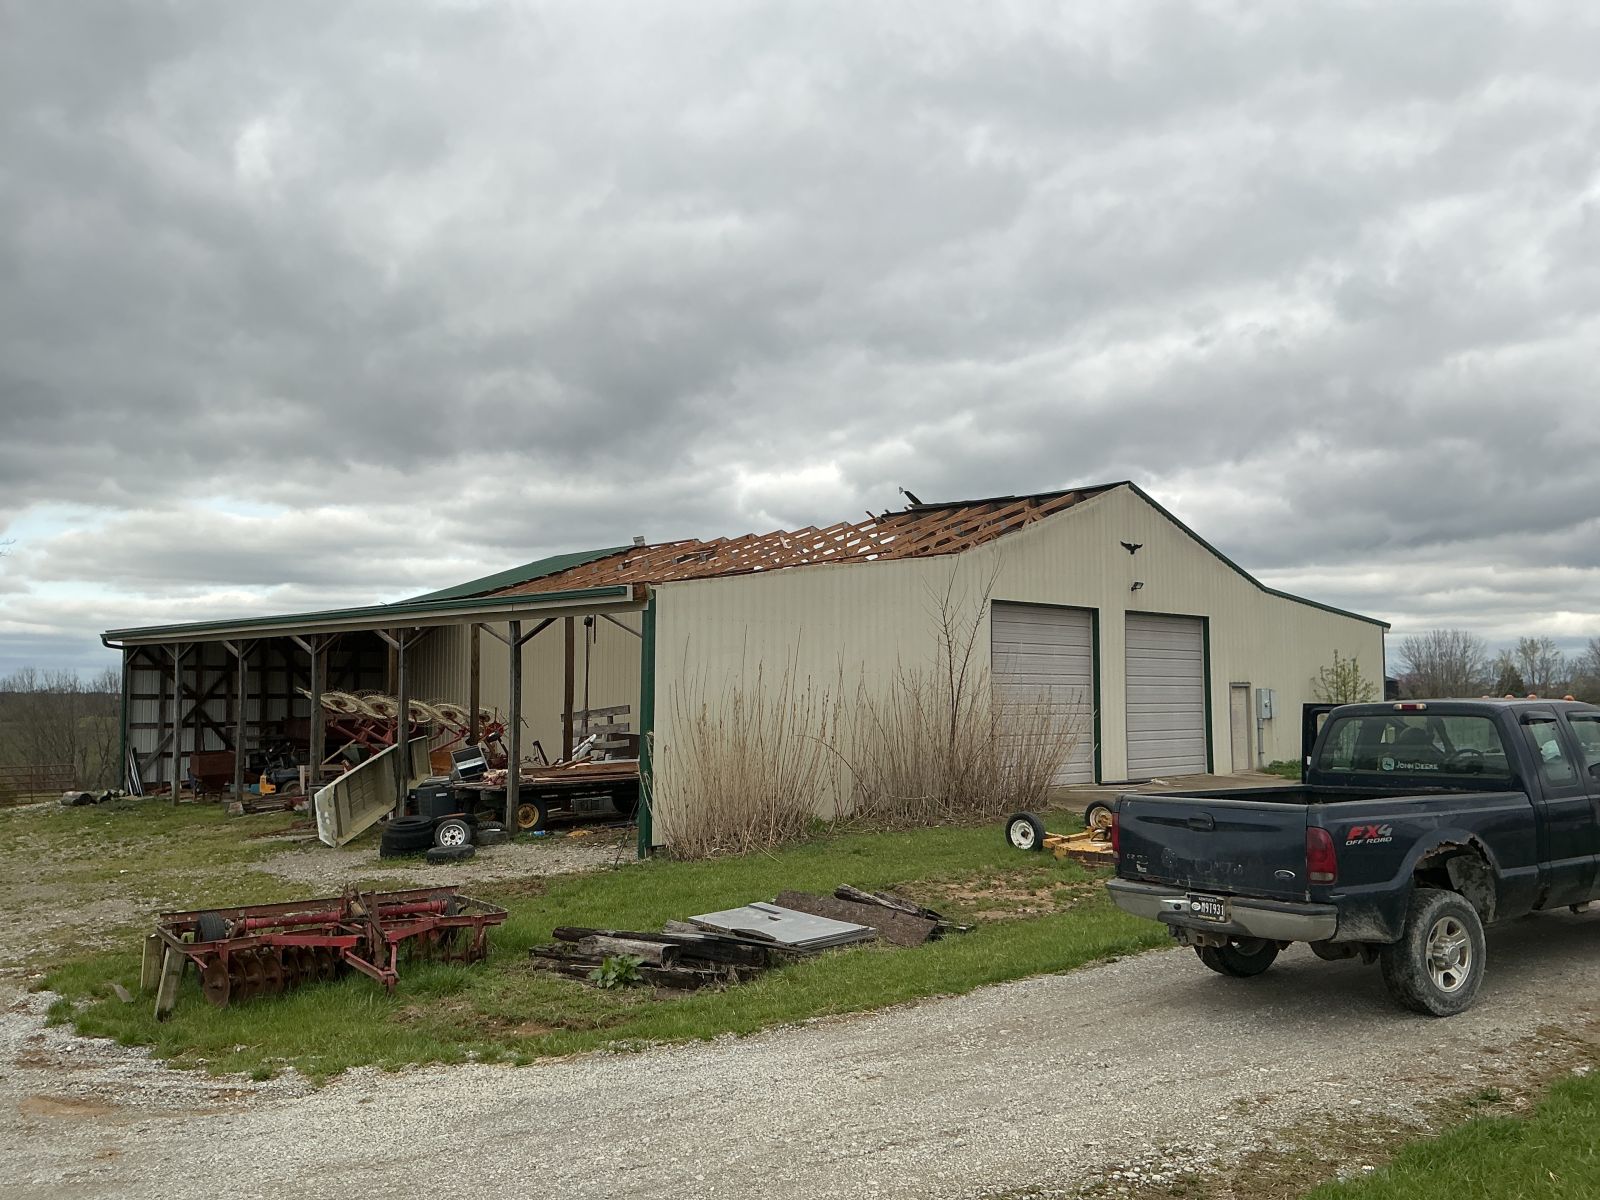
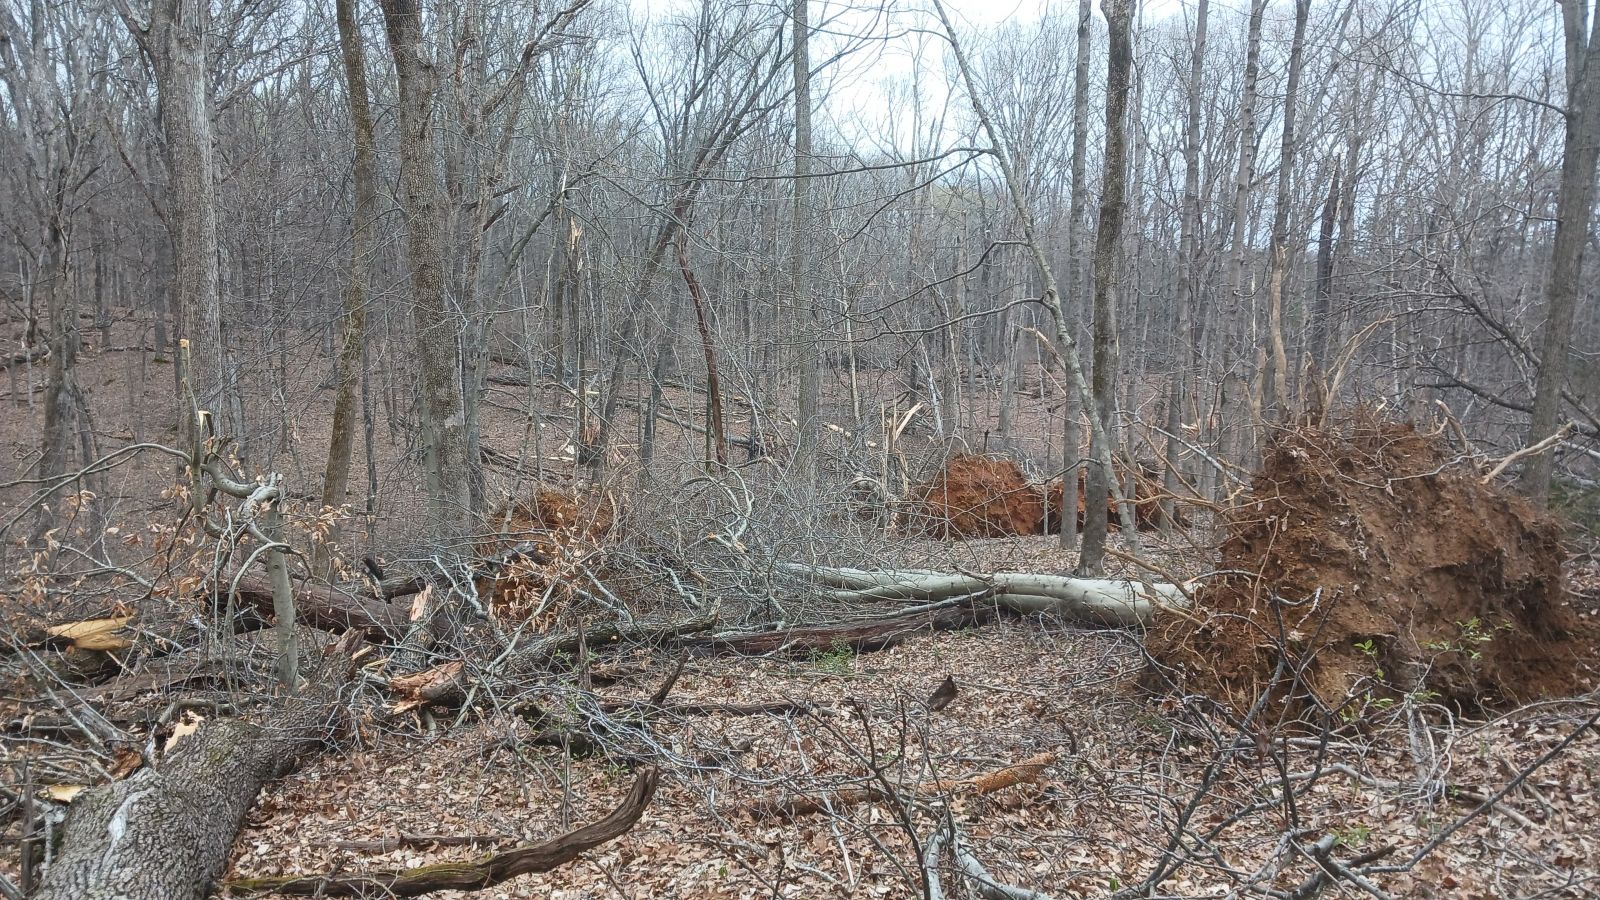
| Tornado damage in Harned, KY (Breckinridge County) | Damage to a barn in Mt Eden, KY (Spencer County) | Tornado damage to trees in Doe Valley, KY (Meade County) | Damage to a building in Radcliff, KY (Hardin County) |
Environment
An upper-level shortwave trough moved across the mid-Mississippi and Ohio Valley during the evening hours on March 30th. A 35-40 kt southwesterly low-level jet provided sufficient shear for severe storms, while a warm and humid environment ahead of a cold front provided the necessary fuel.
 |
 |
 |
| Figure 1: 500 mb Heights and Winds at 8 PM EDT 03/30 | Figure 2: 850 mb Heights and Winds at 8 PM EDT 03/30 | Figure 3: Surface Temperatures, Dewpoints, and Mean Sea Level Pressure at 8 PM EDT 03/30 |
Surface-based instability between 1000-2000 J/kg ahead of the cold front provided ample fuel for thunderstorms. Moderate to strong low-to-mid level flow resulted in enough vertical wind shear for storms to become strong and severe. One key parameter was the 0-3 km bulk shear vector, which was oriented from west-southwest to east-northwest around 35 kt in the vicinity of the tornadic portion of the line. Where the line was oriented more north-south, this shear vector was more favorable for mesovortex genesis, which was between downtown Louisville and the Western Kentucky Parkway.
 |
 |
 |
| Figure 4: Surface-based CAPE at 9 PM EDT 03/30 | Figure 5: 0-3 km Bulk Shear at 9 PM EDT 03/30 | Figure 6: 0-1 km Storm-Relative Helicity at 9 PM EDT 03/30 |
Note the corridor of significant tornado parameter values greater than 1 just ahead of the tornadic portion of the QLCS. LCL heights were not particularly low (between 750-1000 m), but were sufficient to sustain tornadic potential for a few hours on the evening of March 30th.
 |
 |
| Figure 7: Lifting Condensation Level Heights at 9 PM EDT 03/30 | Figure 8: Significant Tornado Parameter at 9 PM EDT 03/30 |
 |
Media use of NWS Web News Stories is encouraged! Please acknowledge the NWS as the source of any news information accessed from this site. |
|


 Weather Story
 Weather Map
 Local Radar