|
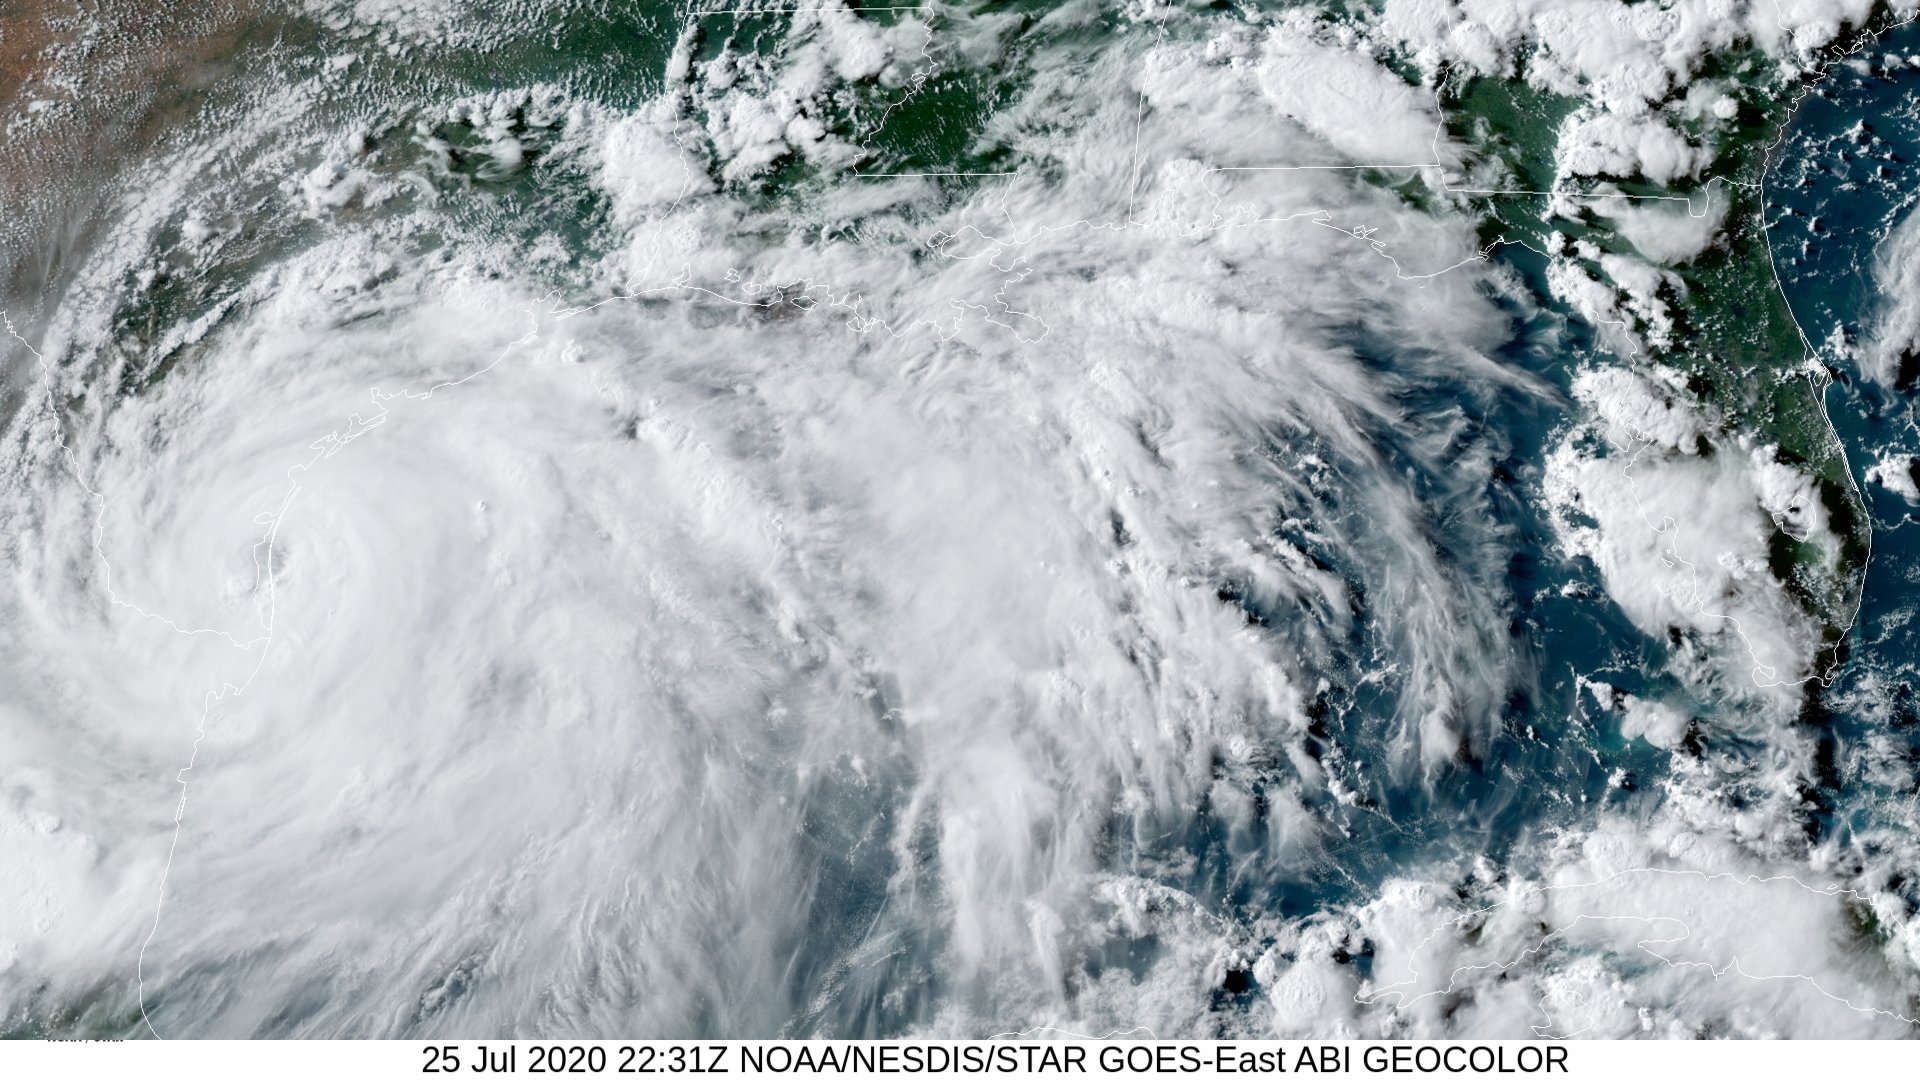
Above: GOES 16 GeoColor Satellite Image of Hurricane Hanna making landfall at 5:31 PM CDT on July 25, 2020.
Hurricane Hanna developed from a tropical wave originating near Hispaniola. The disturbance gradually became better organized and developed into a tropical depression in the central portion of the Gulf on the evening of July 22nd. The depression strengthened into a tropical storm during the evening of July 23rd. This set a new record for earliest eighth-named storm in the Atlantic basin, getting its name 10 calendar days before the previous record holder, Tropical Storm Harvey of 2005. Hanna steadily intensified as it drifted toward Southern Texas, becoming the season's first hurricane just after daybreak on July 25th. It quickly strengthened before making landfall on Padre Island, Texas, at 5:00 PM CDT as a category 1 hurricane, with maximum sustained winds of 90 mph (80 knots) and a minimum central pressure of 973 millibars (28.73 inches). Hanna weakened as it moved inland and turned west-southwest, eventually dissipating over Mexico on July 27th.
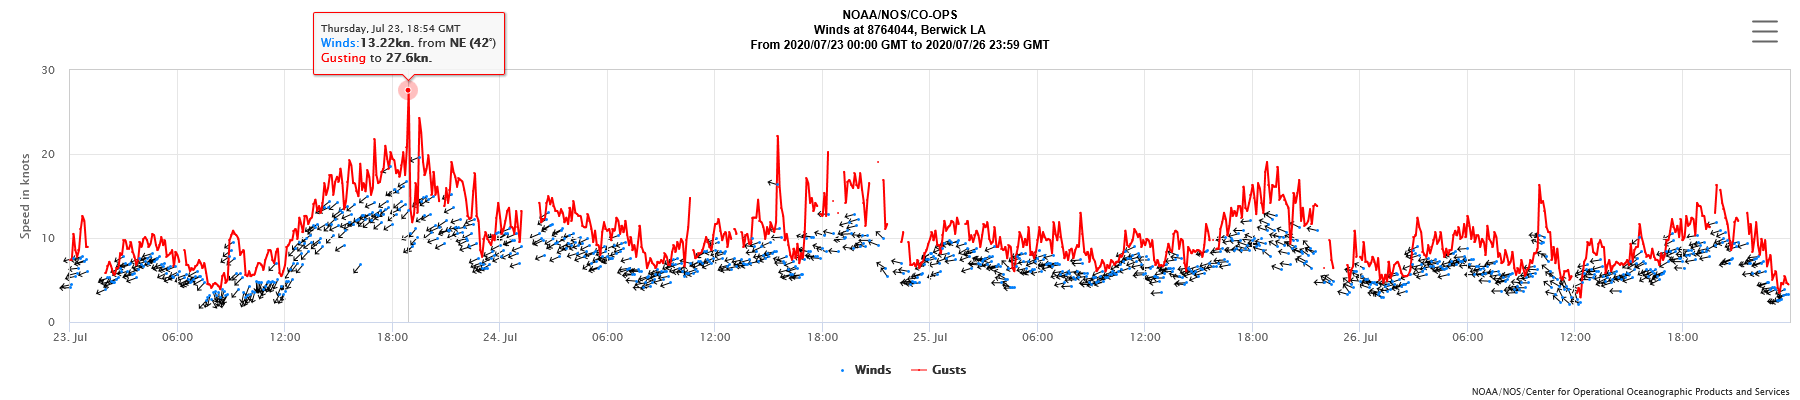
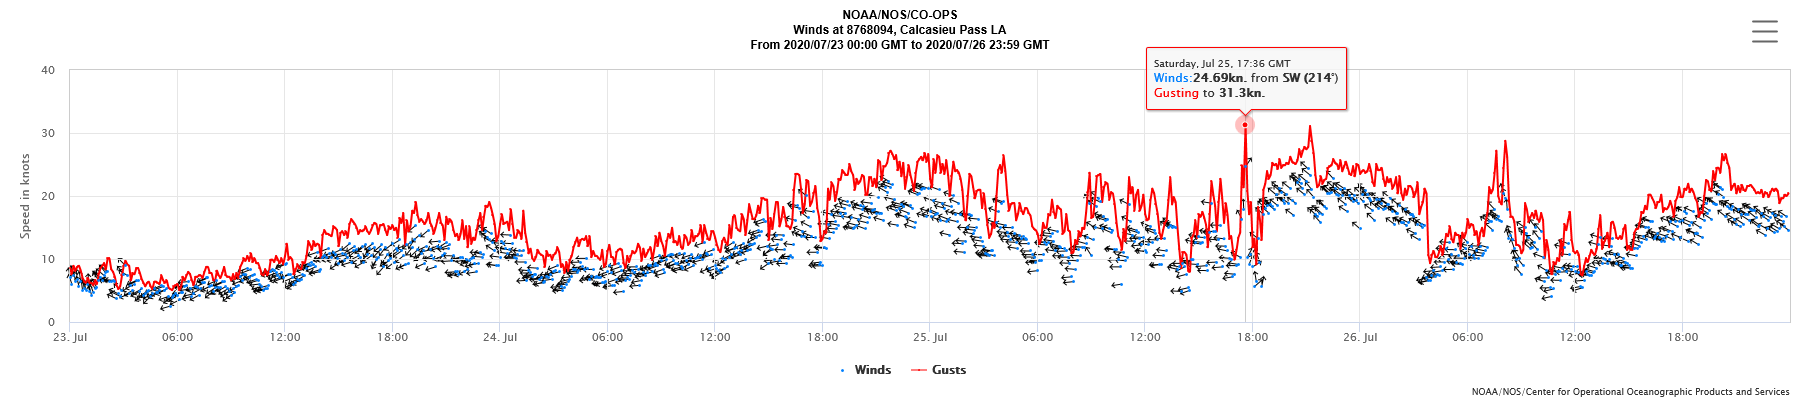
WINDS & PRESSURE:
For our region, minimal sustained tropical storm force winds were briefly recorded just after daybreak on July 25th across coastal Jefferson County and adjacent coastal waters associated with the outer bands of Hanna.
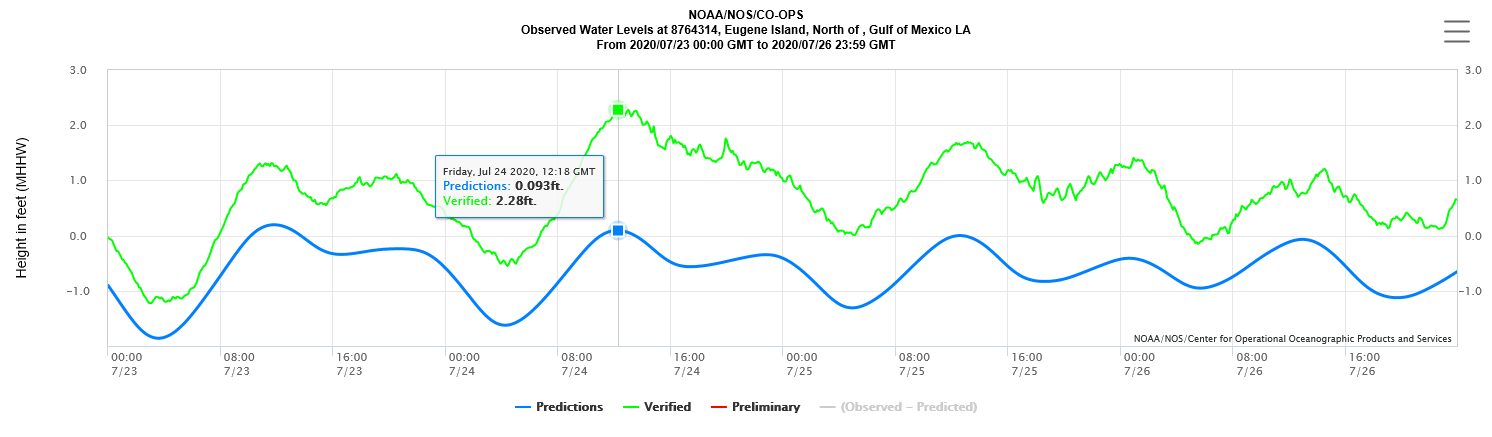
STORM SURGE:
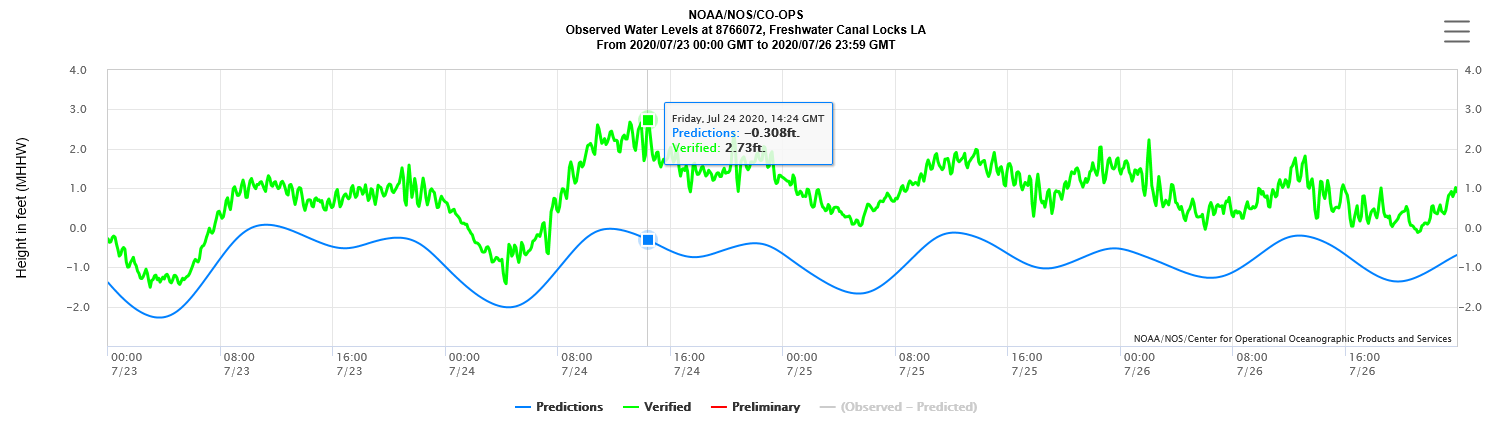
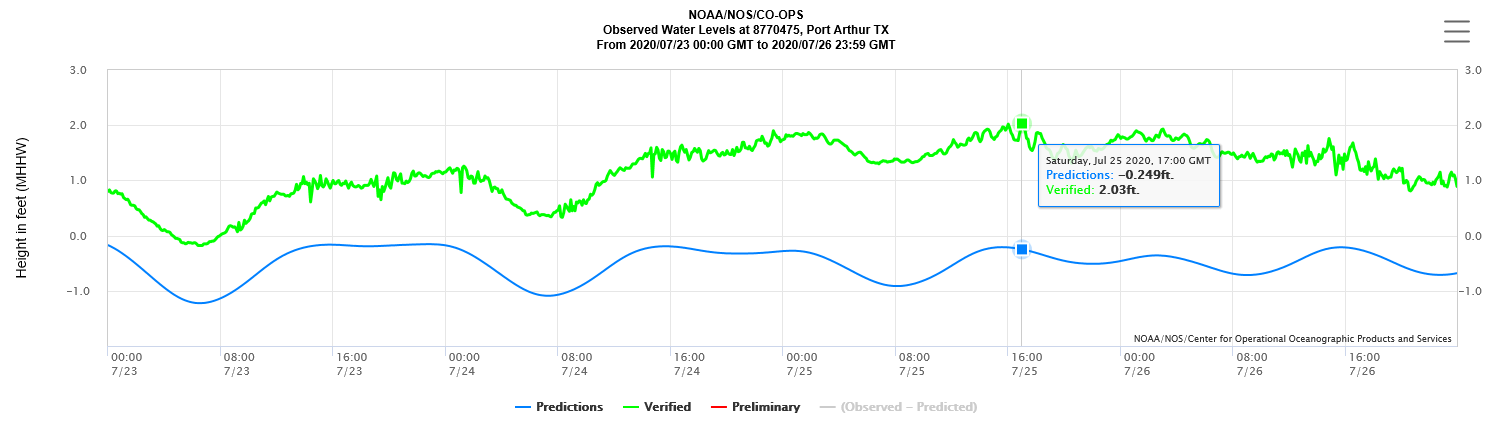
Coastal tides ranging between 2.00-2.75 feet Mean Higher High Water (MHHW), or a rough estimate of the level above ground level, was recorded between High Island, TX and the mouth of the Atchafalaya River near Morgan City, LA. Minor coastal flooding was noted, but limited to the immediate coastline.
RAINFALL:
About one half to two inches of rainfall fell across Southeast Texas and Southern Louisiana.
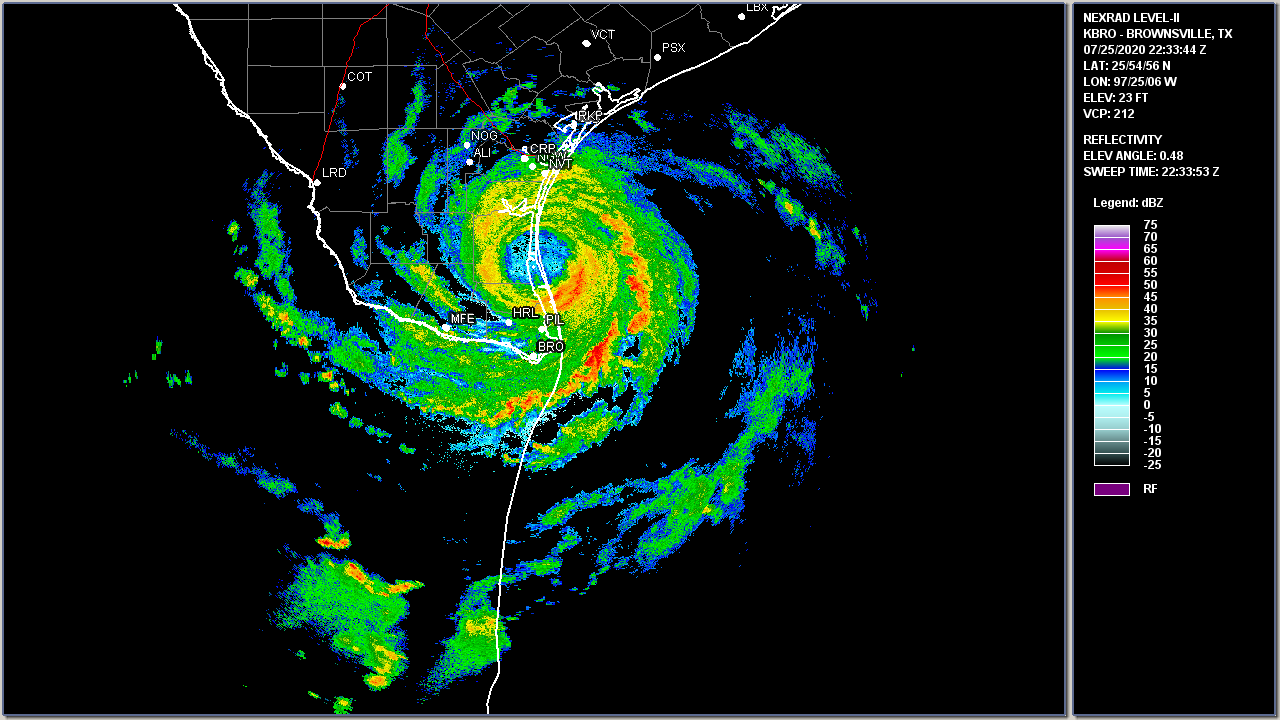
Above: Brownsville, TX WSR-88D Radar Image of Hurricane Hanna making landfall at 5:33 PM CDT July 25, 2020.

Above: Hurrevac track of Hurricane Hanna from operational National Hurricane Center public advisories.
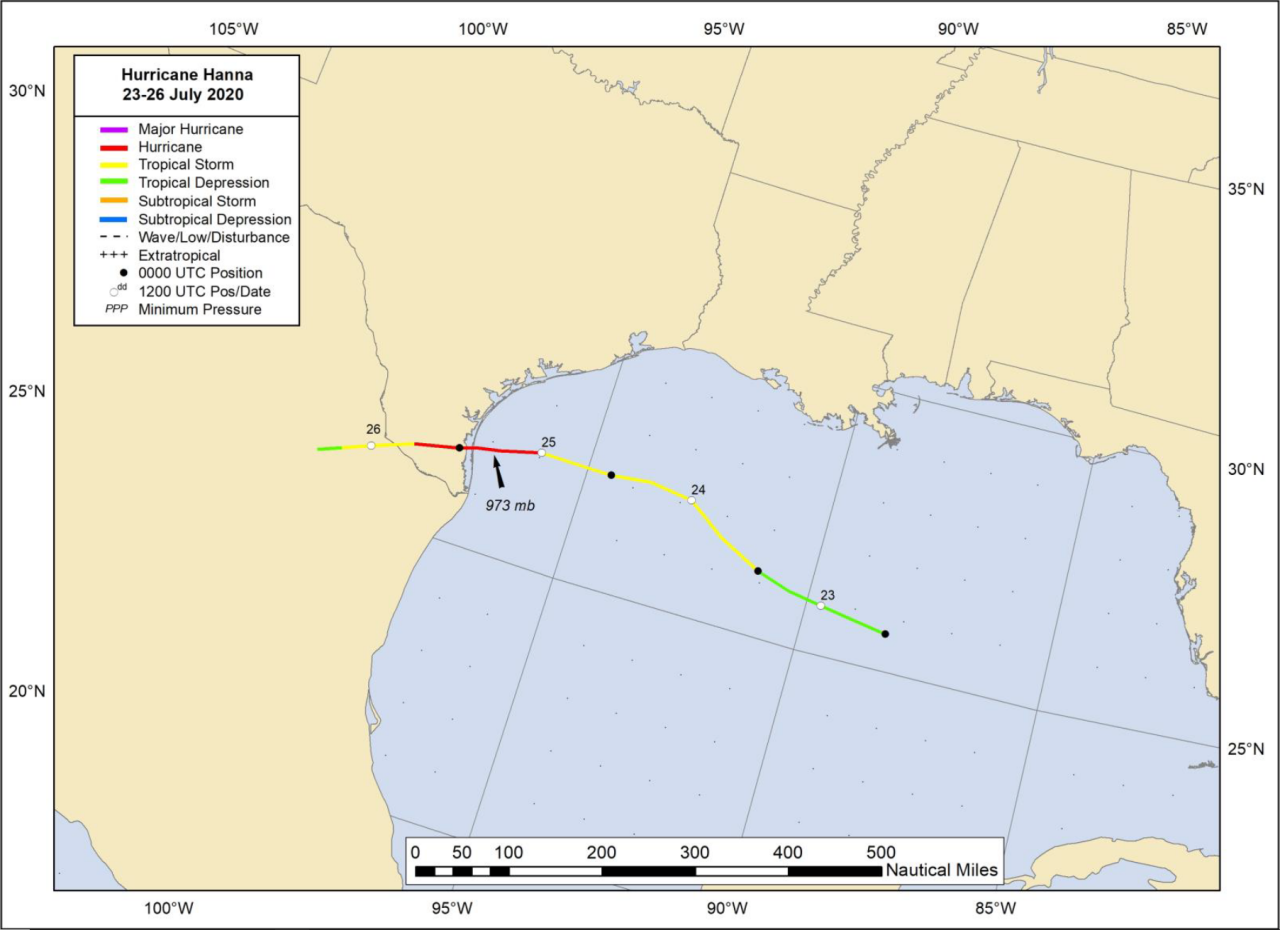
Above: National Hurricane Center best track of Hurricane Hanna.
Listed below are post-storm reports and meteorological data gathered. All data is considered preliminary, and is subject to change at any time. Additional information will continue to be added to this page in the future.
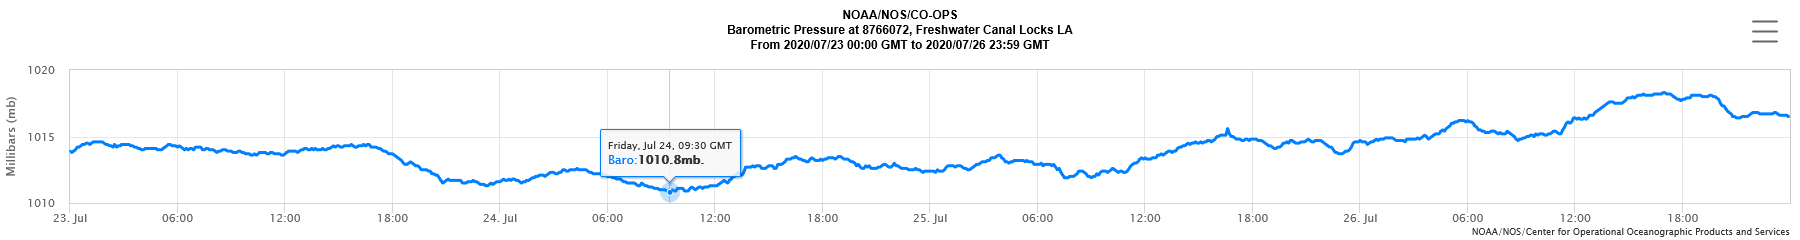
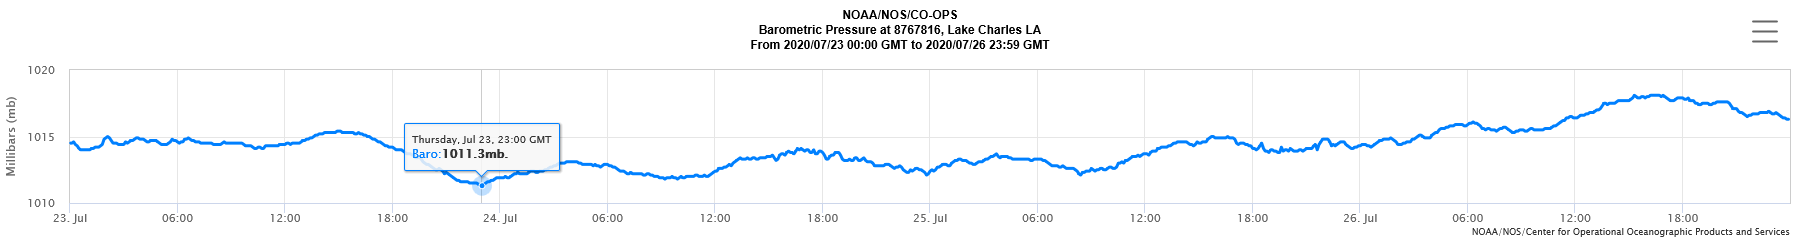
| NOS Tidal Water Graphs |
| Eugene Island, LA |
Amerada Pass, LA |
Berwick, LA |
Freshwater Canal Locks, LA |
| Calcasieu Pass, LA |
Bulk Terminal, LA |
Lake Charles, LA |
Texas Point, Sabine Pass, TX |
| Sabine Pass North, TX |
Port Arthur, TX |
Rainbow Bridge, TX |
|
M = Missing Data
I = Incomplete Data
Webpage design by: Donovan Landreneau
Content by: NWS Lake Charles staff, other sources as noted above.
|

