|
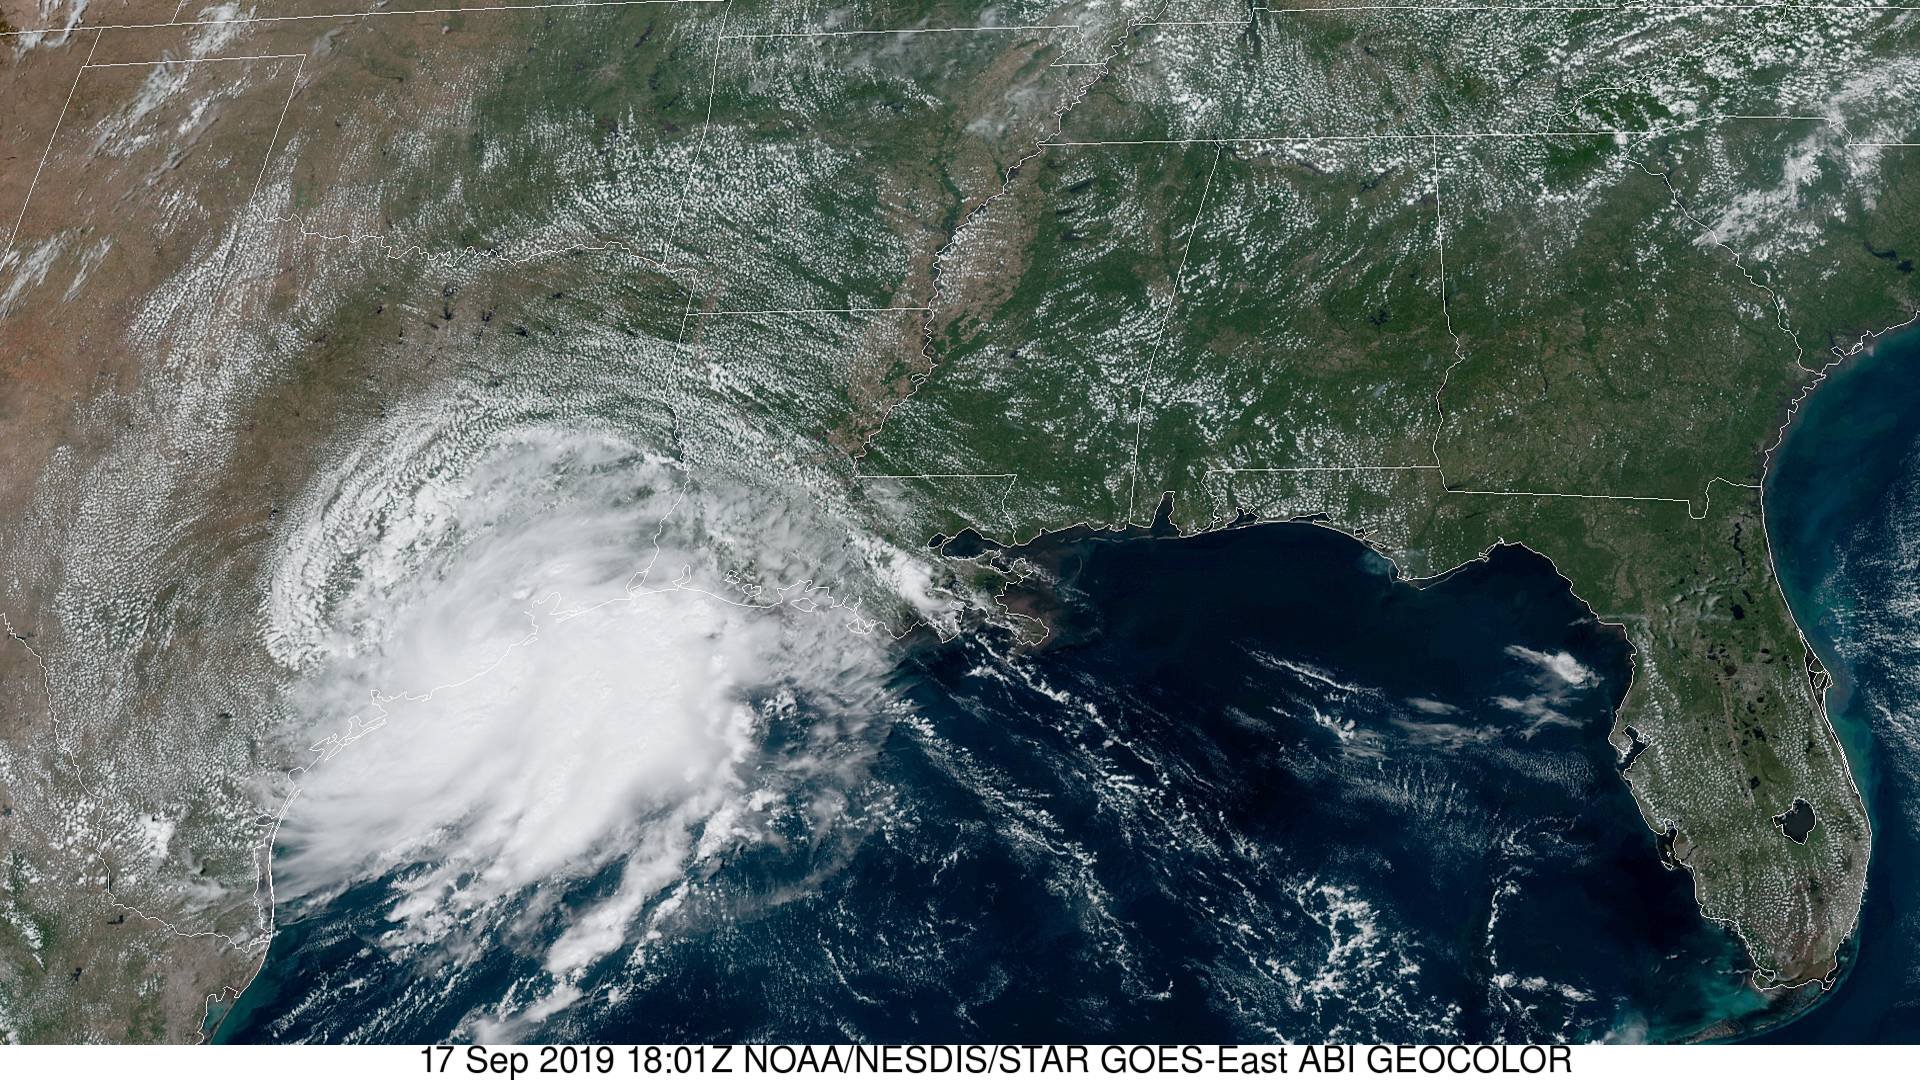
Above: GOES 16 GeoColor Satellite Image of Tropical Storm Imelda around landfall at Freeport, TX at 1:01 PM CDT on September 17, 2019.
On September 14, the National Hurricane Center began monitoring an area of disturbed off the west coast of Florida for possible tropical development. Because the tropical disturbance was near an upper-level low, the chances of development were low, ranging from 10-30% through September 16th.
By September 16 through early on the 17th, the upper level low began to move southwest across the Southwestern Gulf and slowly weakened, while the area of disturbed weather continued westward, reaching the coastal waters off the Southeast Texas and Southwest Louisiana coast, still remaining rather disorganized.
By daybreak on the 17th, significant organization was beginning as observed by GOES satellite and the Houston, TX & Lake Charles, LA WSR-88D radars. By Noon CDT, the system organized into Tropical Depression Eleven, just off the Texas Coast. National Ocean Service tidal station observations at Freeport Harbor, TX and Sabine Pass, TX reported sustained winds of 35 knots (40 mph) with gusts to 42 knots (48 mph) between Noon and 1 PM CDT. At 12:45 PM CDT, the National Hurricane Center issued a tropical cyclone update indicating the depression had strengthened to Tropical Storm Imelda. Shortly thereafter, Imelda made landfall near Freeport, Texas at 1:30 PM CDT with maximum sustained winds of 40 mph and a minimum central pressure of 1005 millibars (29.68 inches of mercury). Imelda weakened after landfall, becoming a tropical depression by 7 PM that evening.
Imelda moved further inland that night, and then stalled between Houston and Lufkin, TX through September 19th, remaining at tropical depression status during this time. By the afternoon of the 19th, the low-level center of the depression had degenerated into an open surface trough. Imelda's remnants began lifting northward across Northeast Texas, Southeast Oklahoma, Southwest Arkansas, and Northwest Louisiana (the ArkLaTex) before dissipating early on September 21st.
As the depression stalled across Southeast Texas, significant convection developed with a feeder band southwest of the center the evening of the 17th into the morning of the 18th, with significant flooding across Galveston to Houston, Texas. Another significant feeder band developed south of the center across Southeast Texas the afternoon of September 18th into the 19th. The orientation of this rain band provided continuous training of thunderstorms across Southeast Texas, with devastating flooding along the I-10 corridor from Winnie eastward to Fannett, Beaumont, Vidor, and Orange Texas. This area accumulated 30 to 44 inches of rainfall during the storm, with the greatest total of 44.29 inches recorded 2 miles south-southwest of Fannett, TX. Also noteworthy about the Fannett, TX total was 31 inches fell in 12 hours. During the height of the flooding, numerous vehicles were either stuck or flooded on I-10 between Beaumont and Winnie for 2 ½ days.
The 44.29 inches recorded 2 miles south-southwest of Fannett, TX makes Imelda the 7th wettest tropical cyclone to impact the United States, 5th wettest in the contiguous United States, and the 4th wettest in the state of Texas.
To emphasize the rarity of such extreme rainfall rates, the Annual Exceedance Probability (AEPs) for the Highest 12, 24, 48 hour Rainfall Period for this event is included. For additional information in interpreting this data, check out the USGS Floods and Recurrence Intervals website.
The following summarizes the effects of Imelda by parishes & counties across the National Weather Service Lake Charles area of responsibility.
Jefferson County, TX:
Two fatalities were reported due to flooding. Texas DPS recovered the body of a 52-year-old male from a pickup truck on Interstate 10 approximately 3 miles west of Beaumont. Texas Task Force 1 recovered the body of a 47-year-old male from a vehicle located in a canal near the 3800 block of Walden road.
As of September 30th, around 5100 homes estimated to have flooded with $13,994,469 in estimated damages. This does not include numerous damaged vehicles. During the height of the flooding, numerous vehicles were stuck on flooded I-10 between Beaumont and Winnie for 2 ½ days after 31 inches of rain fell in 12 hours near Fannett.
Pine Island Bayou preliminary data suggest 3rd highest crest on record for the gauging station near Sour Lake.
Orange County, TX:
As of September 30th, 2679 homes have found to be flooded with $12,100,719 in estimated damages. This does not include numerous vehicles flooded at this time.
Cow Bayou near Mauriceville preliminary data suggest 2nd highest crest on record.
Hardin County, TX:
As of September 30th, an estimated 60 homes were flooded with $2,302,425 in total estimated damages. Pine Island Bayou preliminary data suggest 3rd highest crest on record for the gauging station near Sour Lake.
Jasper County, TX:
As of September 30th, 9 homes were reported flooded with $202,000 estimated damages.
Newton County, TX:
As of September 30th, 6 homes have been found to have flooded with $2,020,000 estimated damages.
Listed below are post-storm reports and meteorological data gathered. All data is considered preliminary, and is subject to change at any time. Additional information will continue to be added to this page in the future.

Above: Hurrevac track of Tropical Storm Imelda from operational National Hurricane Center public advisories.

Above: National Hurricane Center track of Tropical Storm Imelda.

Above: Raw NOAA Multi-radar multi-sensor quantitative precipitation estimation (inches) for Imelda from September 16th (7 AM CDT) to September 21 (7 AM CDT), 2019. Graphic created by Jonathan Brazzell.

Above: Zoomed-in graphic with cities for Southeast Texas & Southwest Louisiana Raw NOAA Multi-radar multi-sensor quantitative precipitation estimation (inches) for Imelda from September 16th (7 AM CDT) to September 21 (7 AM CDT), 2019. Graphic created by Jonathan Brazzell.
Annual Exceedance Probability (AEPs) for the Highest 12, 24, 48 hour Rainfall Period
For additional information in interpreting this data, check out the USGS Floods and Recurrence Intervals. |
 |
 |
 |
| NOS Tidal Water Graphs |
| Sabine Pass North, TX |
Texas Point, Sabine Pass, TX |
Port Arthur, TX |
Rainbow Bridge, TX |
| Calcasieu Pass, LA |
Bulk Terminal, LA |
Lake Charles, LA |
Freshwater Canal Locks, LA |
| Eugene Island, LA |
Amerada Pass, LA |
|
|
Webpage design by: Donovan Landreneau
Content by: NWS Lake Charles staff, other sources as noted above.
|


.png)
.png)
.png)
.png)
.png)
.png)
.png)
.png)
.png)
.png)
.png)
.png)
.png)
.png)
.png)
.png)
.png)
.png)
.png)
.png)
.png)
.png)
.png)
.png)