|
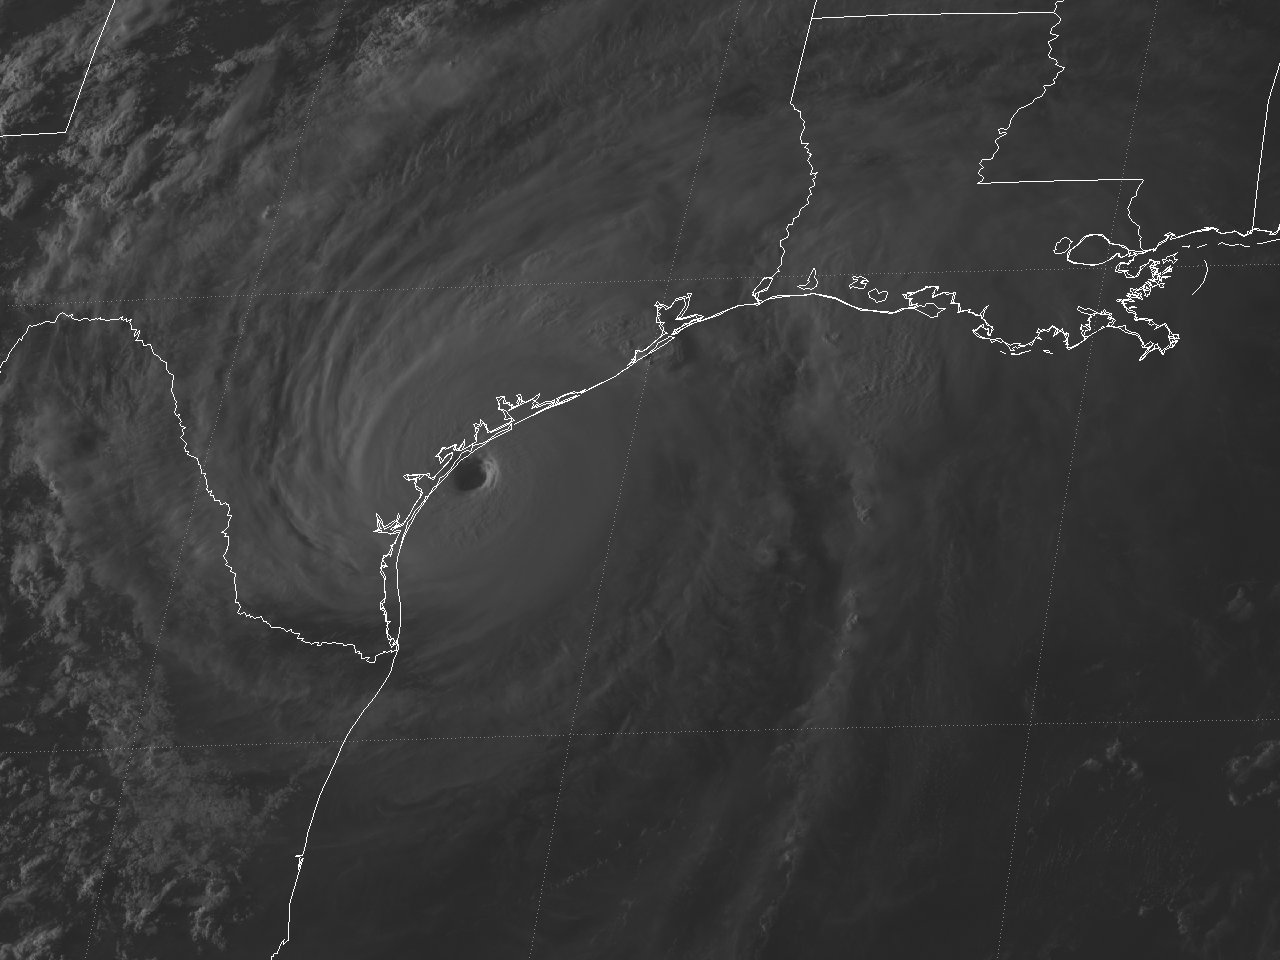
Above: GOES 13 Visible Satellite Image of Hurricane Harvey just prior to Central Texas landfall at 6:30 PM CDT on August 25, 2017.
Harvey began as a weak tropical storm on August 17th, affected the Lesser Antilles on August 18th, and degenerated to an open tropical wave over the central Caribbean Sea on August 19th. The remnants of Harvey crossed the central and western Caribbean Sea August 19th through the 21st, the Yucatan Peninsula on August 22nd, and reformed as a tropical depression over the Bay of Campeche by daybreak on August 23rd.
Harvey quickly regained tropical storm status by that afternoon as the system became much better organized. Harvey continued to strengthen the next 24 hours, reaching hurricane status by the afternoon of August 24th. Harvey continued to rapidly intensify, reaching category 3 status by midday on August 25th, and category 4 shortly before sunset that evening.
Harvey made landfall on the northern end of San Jose Island about 5 miles east of Rockport, Texas at 10 P.M. CDT on August 25th as a category 4 hurricane with sustained winds of 130 mph (115 knots) and a minimum central pressure of 937 millibars (27.67 inches). The hurricane then made a second landfall on the Texas mainland southeast of Refugio on the northeast coast of Copano Bay west of Holiday Beach at 1 A.M. CDT on August 26th with maximum sustained winds of 120 mph (105 knots) and an minimum central pressure of 948 millibars (27.99 inches).
Harvey weakened over land to a tropical storm within 12 hours after landfall and maintained a 40 mph (35 knots) intensity the next couple of days, aided by the sustaining effects of the southeastern portion of its circulation remaining over water. The steady northwestward motion of the cyclone stopped by the afternoon of August 26th as Harvey became embedded in light steering currents between two mid-tropospheric highs over the Southwestern United States and over the northern Gulf. The storm made a slow loop late on August 26-27th, drifted eastward, then southeastward before re-emerging over Matagorda Bay late on August 27th and the Gulf early on August 28th.
Harvey’s sustained winds strengthened slightly while over the coastal waters just off the Southeast Texas coast on August 28-29th. However, the vertical wind shear was too strong for much intensification, and Harvey reached a final peak intensity of 50 mph (45 knots) late on August 29th. Harvey made its final landfall in Southwestern Louisiana at 3 A.M. CDT on August 30th near Cameron with maximum sustained winds of 45 mph (40 knots) and a minimum central pressure of 991 millibars (29.26 inches).
Harvey slowly weakened over land, becoming a tropical depression over Central Louisiana by the evening of August 30th. Harvey then moved northeastward over the southern United States while producing heavy rainfall, and it transformed into an extratropical cyclone by September 1st over the Tennessee Valley. The cyclone dissipated over northern Kentucky late the next day.
Storm surge values associated with Harvey as a tropical storm occurred from August 28-30th, and ranged from 4-5 feet Mean Lower Low Water (MLLW) along the Southeast Texas to Central Louisiana coast. For inundation purposes, water levels are referenced above Mean Higher High Water (MHHW), which is used as a proxy for inundation (above ground level) on normally dry ground along the immediate coastline. When converted to these levels, roughly 3-3.5 feet of inundation occurred along the coast and inland lakes, bays, and waterways that are pronged to tidal inundation.
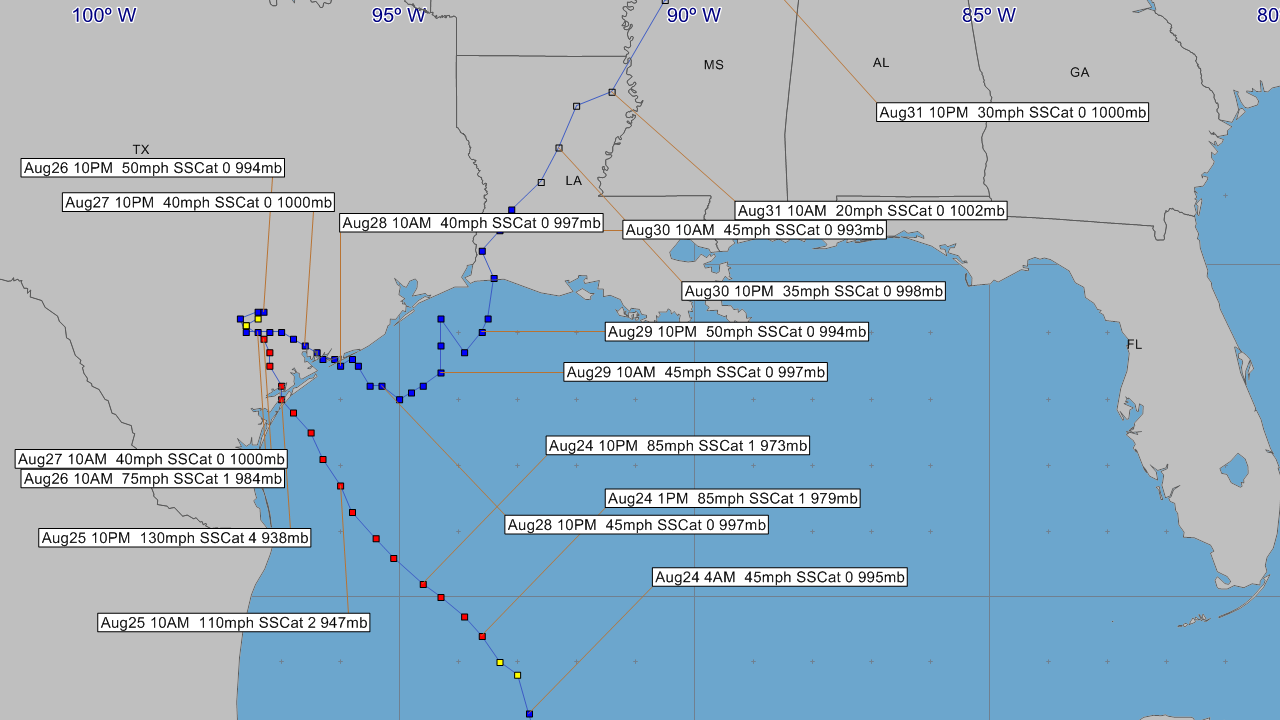
Above: Hurrevac track of Hurricane Harvey from operational National Hurricane Center public advisories.
However, the biggest impact from Harvey was the large areal extent of heavy rainfall over Southeast Texas and extreme Southwest Louisiana from the afternoon of August 24th through the 31st. This was the result of the complex interaction between Harvey stalling and slowly moving eastward between two steering mid to upper level high pressure centers and a weak stationary front just inland over Southeast Texas and Southern Louisiana. Further explanation of this and other details can be found in the National Hurricane Center post tropical storm report.
Harvey’s rainfall was the most significant tropical cyclone rainfall event in Southeast Texas and United States history since reliable rainfall records began in the 1880s. The highest storm total rainfall report from Harvey was 60.58 inches near Nederland, Texas, with another report of 60.54 inches near Groves, Texas. Both of these values (and from five other stations) exceed the previously accepted United States tropical cyclone storm total rainfall record of 52.00 inches at Kanalohuluhulu Ranger Station, Hawaii, in August of 1950 from Hurricane Hiki. For the continental United States, the previous tropical cyclone rainfall record was 48.00 inches in Medina, Texas from Tropical Storm Amelia in 1978.

Above: WPC rainfall summary graphic from August 25-September 1, 2017. Figure courtesy David Roth.

Above: Raw NOAA Multi-radar multi-sensor quantitative precipitation estimation (inches) for Harvey in southeastern Texas from August 25-September 1, 2017. Figure courtesy Jonathan Brazzell.
The following summarizes the effects of the flooding by counties and parishes that were hardest hit across the National Weather Service Lake Charles area of responsibility.
Jefferson County, widespread storm total rainfall over 40 inches resulted in over 64,000 homes flooding in the county. Hardest hit areas were Port Arthur, Groves, Bevel Oaks, Hampshire, Fannett, China, and the northeast side of Beaumont. Several refineries in the county received flood waters and were offline for an extended period of time. Record flood crests on pine island bayou and the Lower Neches River were observed.
Orange County, widespread storm totals of 30 to 50 inches of rain resulted in flooding of over 27,742 homes. Hardest hit areas included the city of orange, Vidor, Orangefield, Pine Forest, West Orange, Mauriceville, Rose City, and Lakeview. Record crests were seen on Cow Bayou and the lower Neches River. The Sabine River at Orange was the highest level since Hurricane Ike in 2008. Water was over parts of I-10 in Rose City, Vidor, and near the city of Orange.
Hardin County, 20 to 40 inches of rain fell across the county, resulting in almost 10,000 homes flooding. Worst hit areas were around Lumberton, Silsbee, Sour Lake, and Kountze. Record flooding was observed on Pine Island Bayou at Sour Lake and Village Creek at Kountze. The Neches River at Evadale recorded the second highest reading dating back to 1884. The U.S. highway 96 bridge over village creek near Silsbee collapsed due to the flood waters.
Tyler County, 20 to 30 inches of rain resulted in major flooding in parts of Tyler County, where over 1,730 homes were flooded. The hardest hit areas were in Warren, Fred, and along the Neches River. The Neches River at Town Bluff had its fourth highest crest. Jasper County, 20 to 40 inches of rain fell across the county, resulting in over 4,000 homes flooding. Worst hit areas were Kirbyville, Buna, and Weiss Bluff. The Neches River at Evadale had its second highest crest of record, and the 4th highest crest of record at Town Bluff.
Newton County, 20 to 40 inches of rain resulted in almost 2,000 homes flooding. Hardest hit areas were Trout Creek, Call, and along the Sabine River. A record crest occurred at Big Cow Creek near Newton. On the Sabine River, Burkeville had the 5th highest crest on record, Bon Wier had the 4th highest crest on record, and Deweyville had the 3rd highest crest on record.
Cameron parish, the western side of the parish had 20 to 40 inches of rain. Combined with an above normal tide and high flow down the Sabine River, several secondary roads in Johnson Bayou flooded. Temporary workers had their portable homes flood. Water from the Sabine did go as far east as Highway 27. Parts of the road flooded between Hackberry and Holly Beach.
Calcasieu parish, 15 to 30 inches of rain fell in the parish. One event on Sunday August 27th caused east sections of Lake Charles near Chennault, as far east as Iowa and as far north as Moss Bluff to flood homes. Other homes flooded near the Sabine River west of Vinton. Total numbers of homes flooded in the parish were 1,572. The Sabine River at Deweyville/Starks saw its 3rd highest crest and the Sabine River at Orange saw its 2nd highest crest. On the West Fork of the Calcasieu River at Sam Houston Jones State Park, they saw their 4th highest crest on record, the Calcasieu River at Old Town Bay saw its 6th highest crest on record, and the Calcasieu River at Salt Water Barrier saw its 8th highest crest of record.
Beauregard parish, 15 to 30 inches of rain caused 387 homes to flood in the parish, primarily near the Sabine River and Bundick Creek. The Sabine River near Bon Wier had its 4th highest crest of record. Bundick Creek near Bundick Lake had its 3rd highest crest on record.
Listed below are post-storm reports and meteorological data gathered. All data is considered preliminary, and is subject to change at any time. Additional information will continue to be added to this page in the future.
|


.png)
.png)
.png)
.png)
.png)
.png)
.png)
.png)
.png)
.png)
.png)
.png)
.png)
.png)
.png)
.png)
.png)
.png)
.png)
.png)
.png)
.png)
.png)
.png)
.png)