|
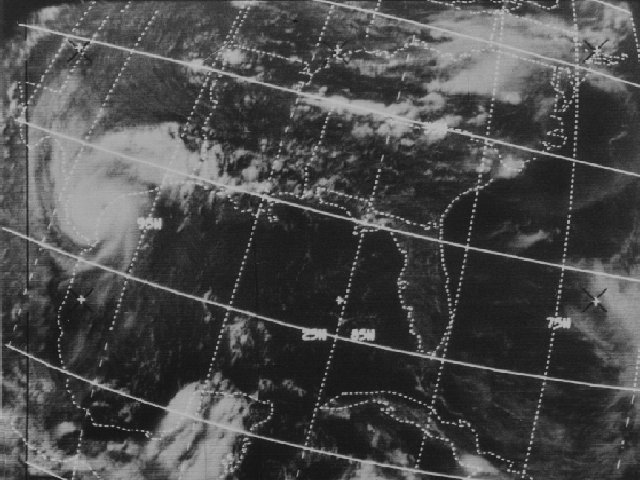
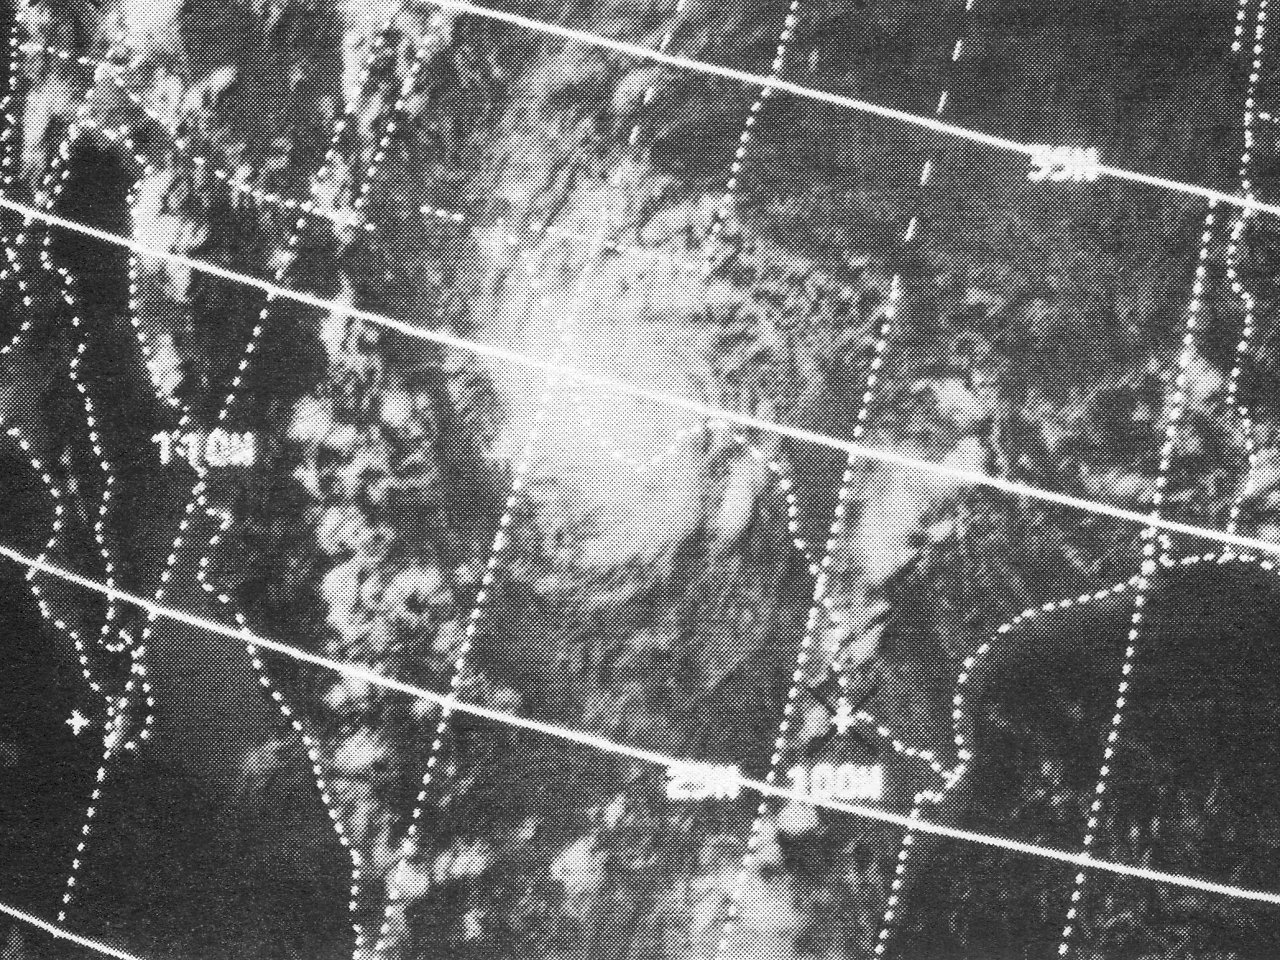
Above: ITOS-1 visible satellite image of Hurricane Celia shortly before landfall August 3, 1970 at 3:33 PM CDT.
Hurricane Celia originated as a tropical wave that emerged from the west coast of Africa July 23rd. The system moved quickly across the Atlantic and reached the Lesser Antilles by July 28th, and the Eastern Caribbean Sea by July 30th where it slowed down and became better organized. The wave was classified as a tropical depression by the evening of July 30th as it headed north-northwest, and became Tropical Storm Celia the evening of July 31st as it was crossing the western tip of Cuba into the Gulf.
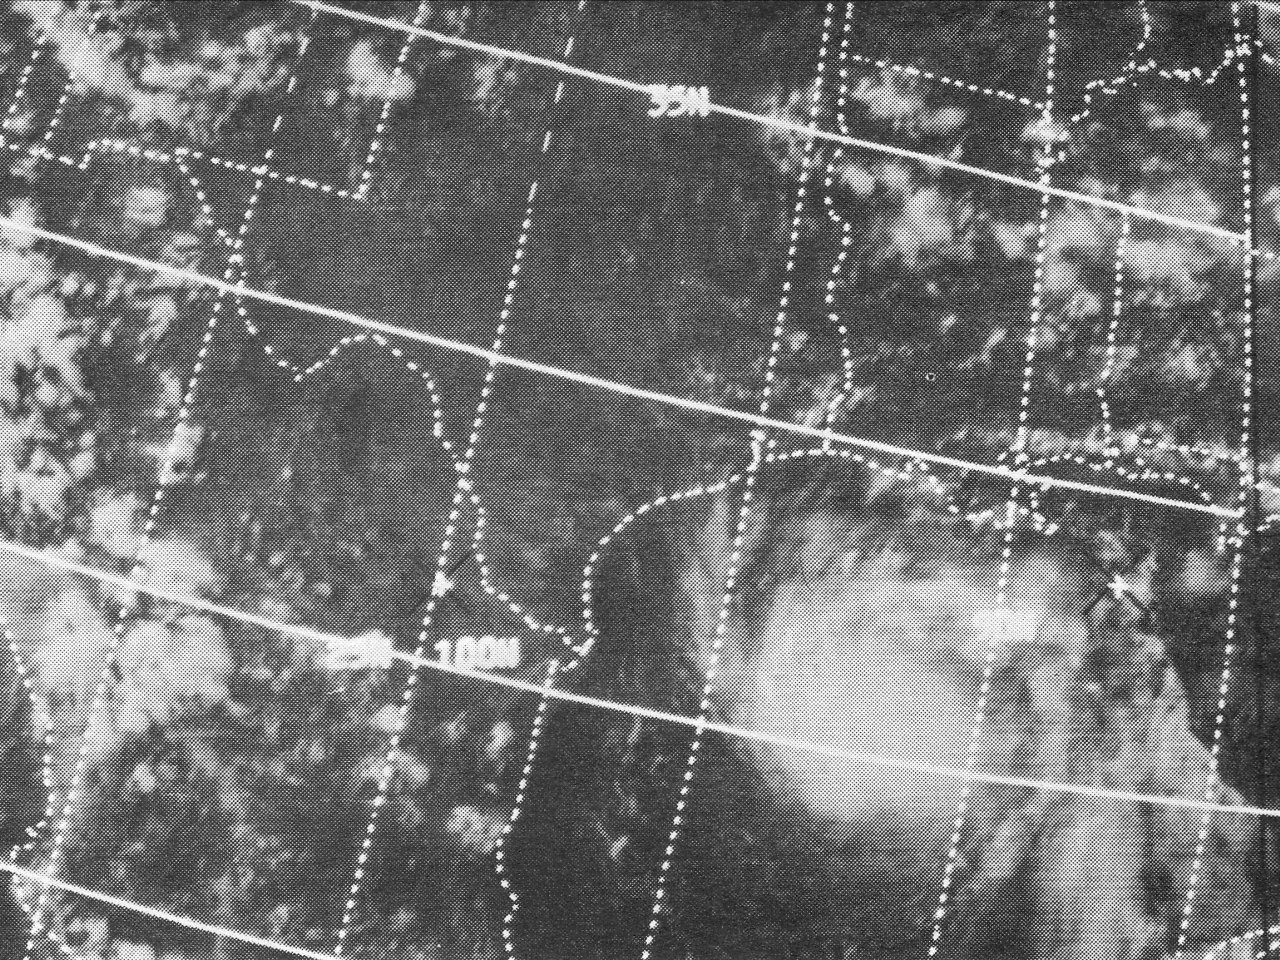
Once in the Gulf, mid to upper level high pressure ridging across the Central and Eastern U.S. intensified, steering Celia more to the northwest, and west northwest for the remainder of the lifetime of the tropical cyclone. This also provided a more favorable environment for strengthening. Celia began to intensify more rapidly, and became a hurricane by the afternoon of August 1st, reaching the first peak intensity of 90 mph (80 knots) by the evening hours. The intensification trend leveled off, with Celia remaining a category 1 hurricane through August 2nd. Pictured here is an ITOS-1 Visible satellite photo at 4:32 PM CDT August 2nd.
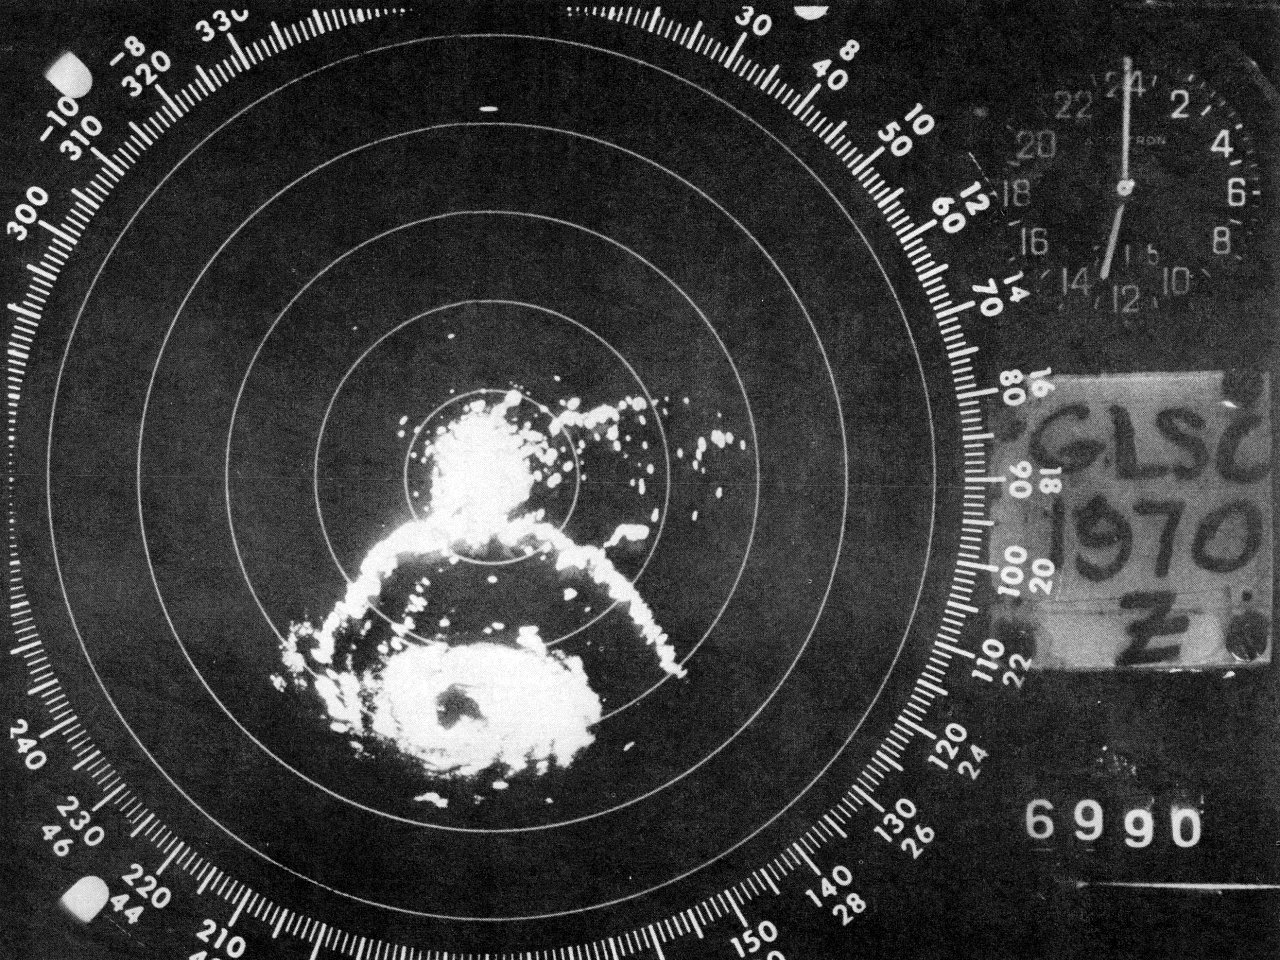
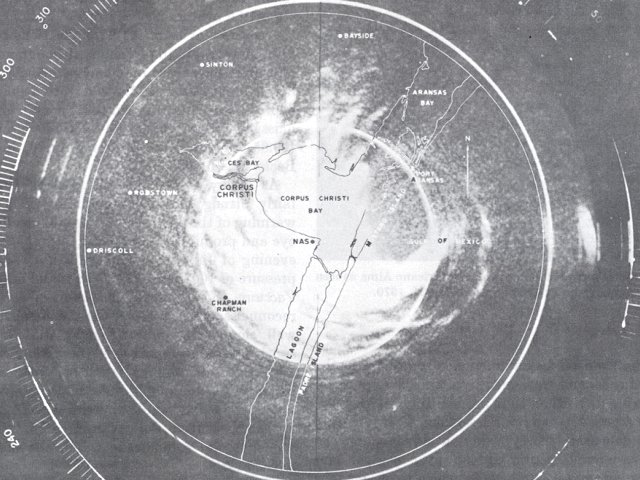
Early on August 3rd, Celia began an explosive intensification trend while it was headed for the Texas Coast. The hurricane strengthened to a category two hurricane by 7 AM CDT with winds of 105 mph (90 knots). The WSR-57 radar at the U.S. Weather Bureau in Galveston, Texas captured this image around 8 AM CDT. Celia continued to strengthen, reaching a category three hurricane by 1 PM CDT with winds of 125 mph (110 knots). Celia continued to intensify up to the time of landfall near Port Aransas & Corpus Christi, Texas at 4 PM CDT as a category four hurricane with maximum sustained winds of 140 mph (120 knots) and a minimum central pressure of 944 millibars (27.88 inches). A radar photo from the Corpus Christi Naval Air Station around 3:20 PM CDT and a visible satellite photo at 3:33 PM CDT shows Celia shortly before landfall.
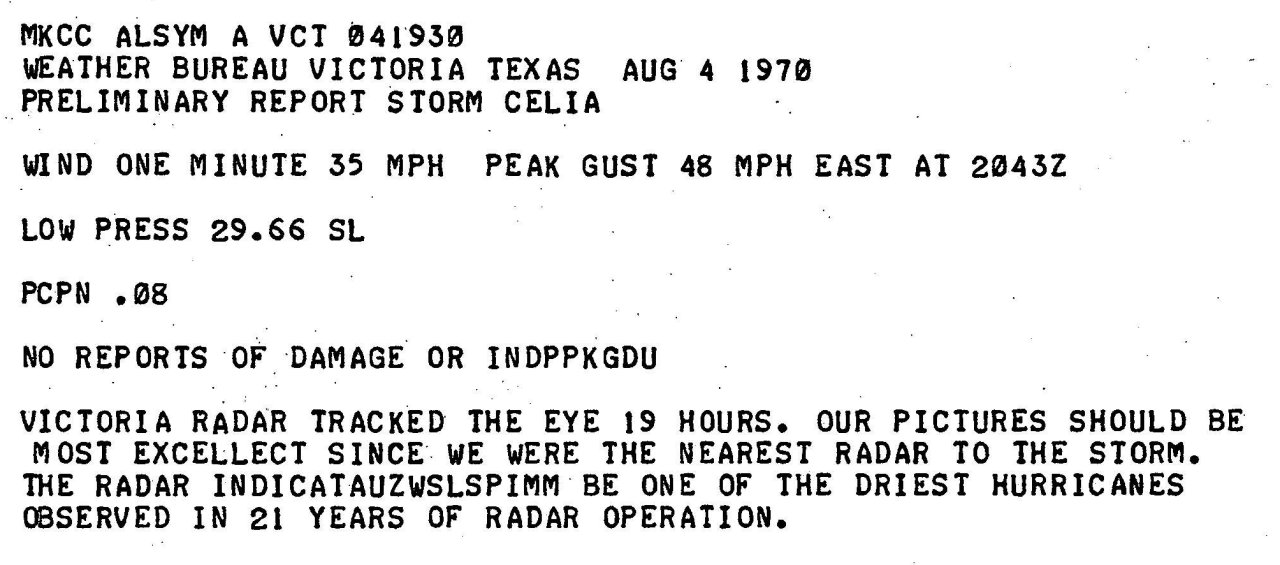
After landfall, Celia steadily weakened, remaining a hurricane through the early morning hours of August 4th at it moved across South Texas. Celia weakened to a tropical storm as it was crossing the Rio Grand into Northern Mexico before daybreak. Here is a visible satellite photo of Celia across the Big Bend country of West Texas at 4:29 PM CDT. Celia later weakened to a tropical depression that evening, and dissipated across Southern New Mexico on August 5th. Click here for an interactive track of Hurricane Celia.
Celia was originally designated a category three at landfall. This storm was investigated by the ongoing Hurricane Re-Analysis Project of the Hurricane Research Division, and found sufficient evidence for upgrading the hurricane to a category four at landfall.
WIND & PRESSURE:
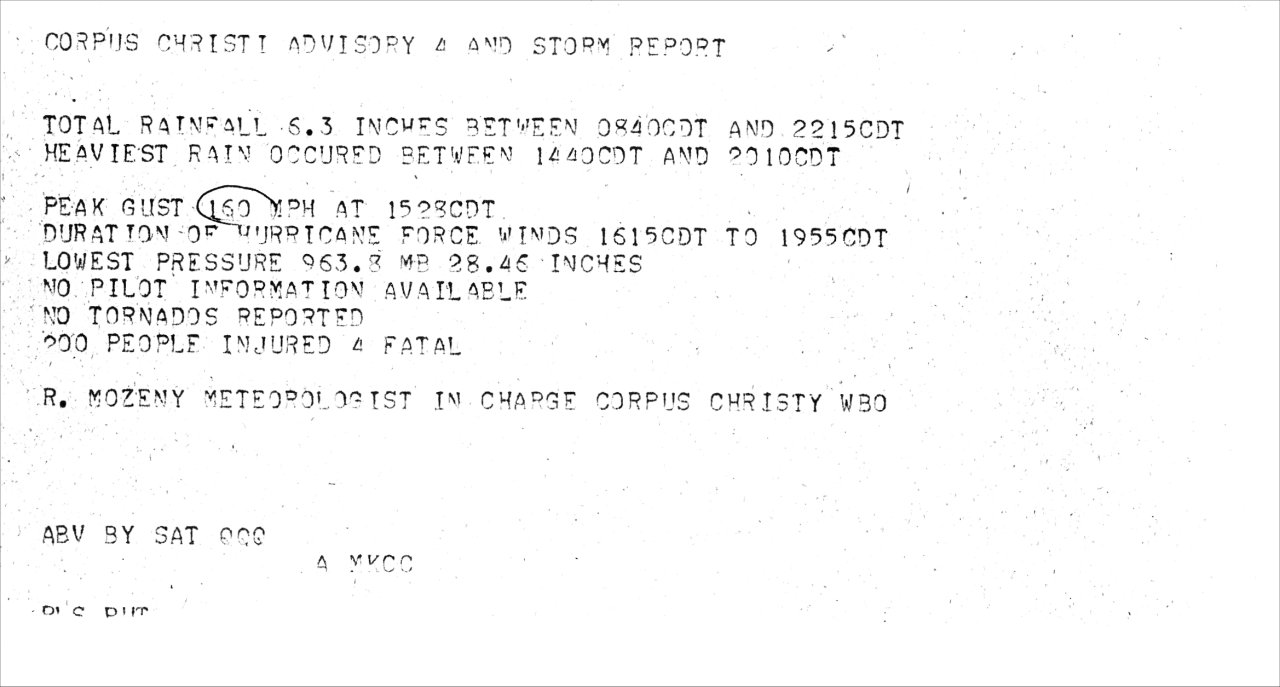
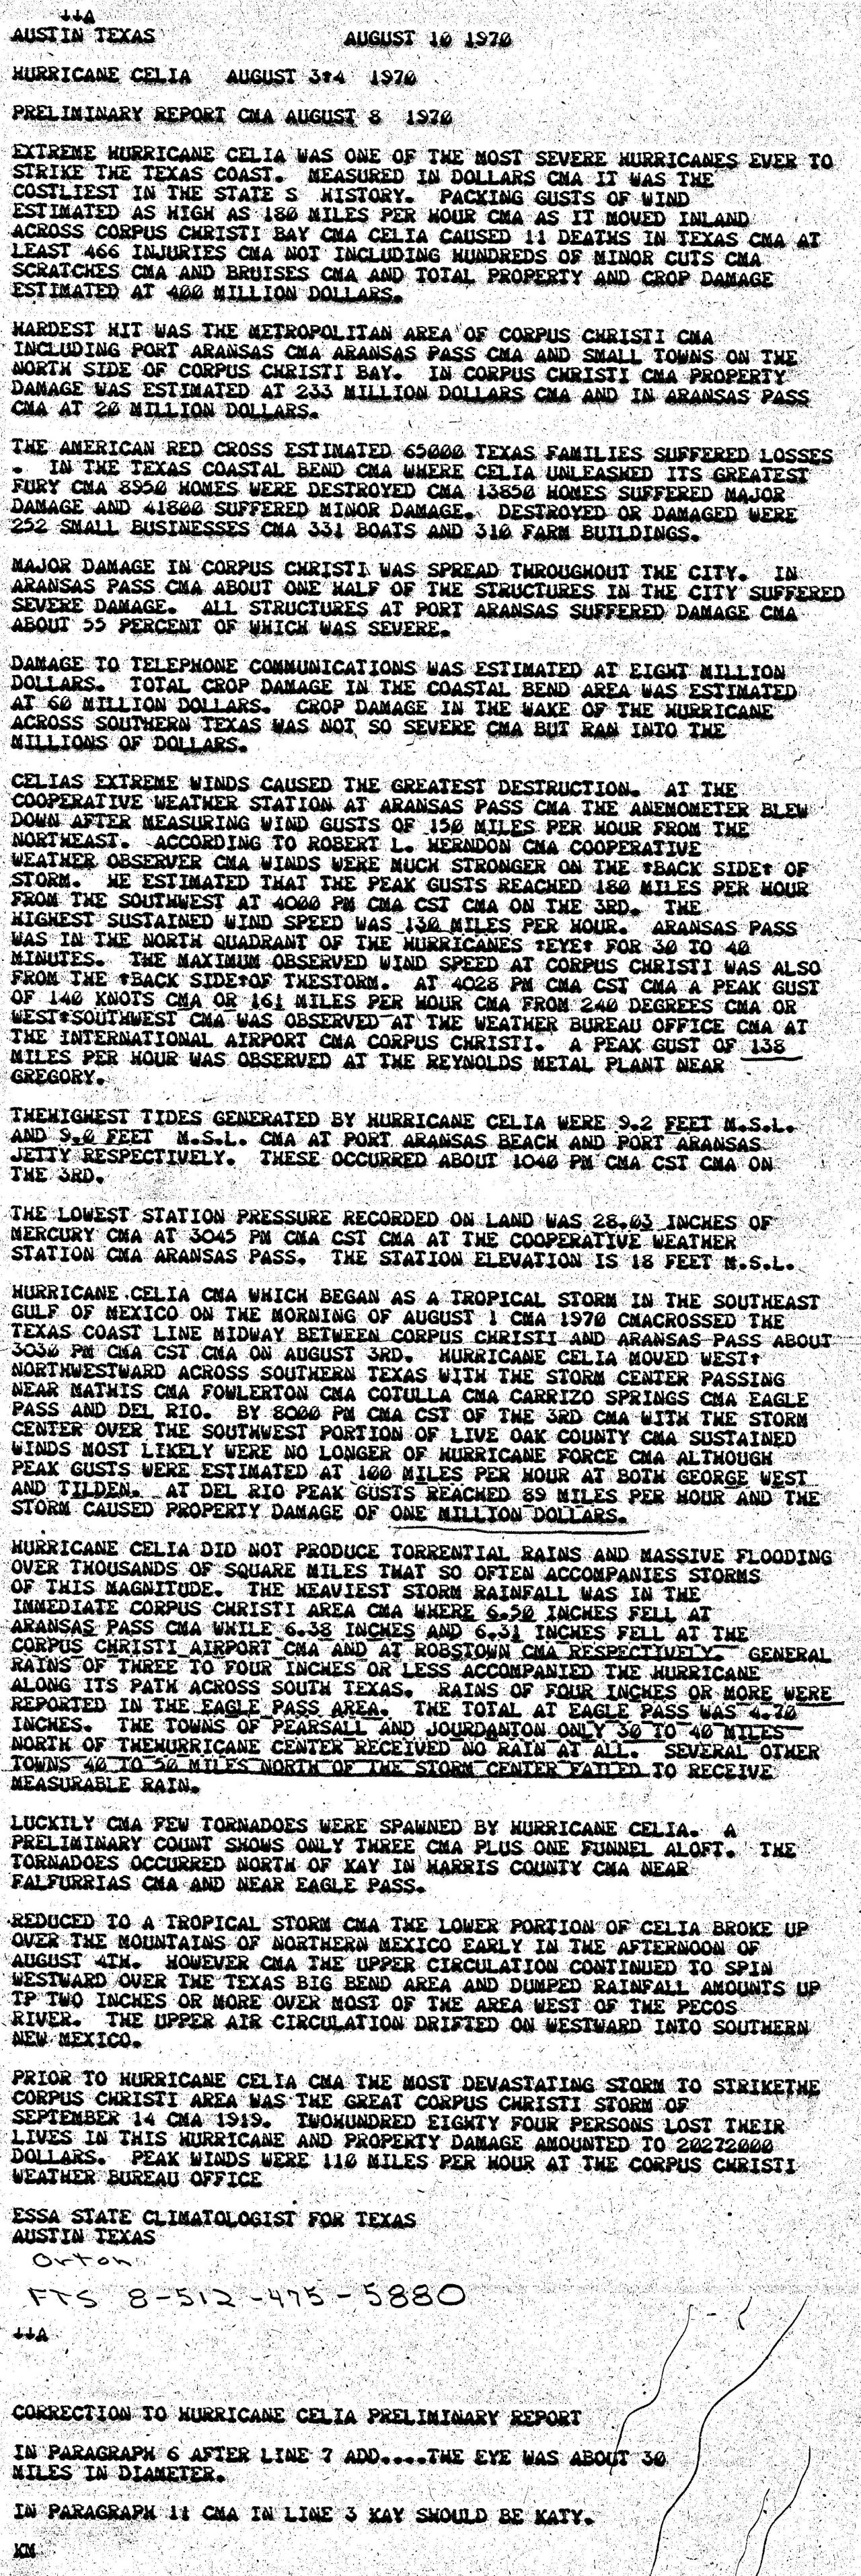
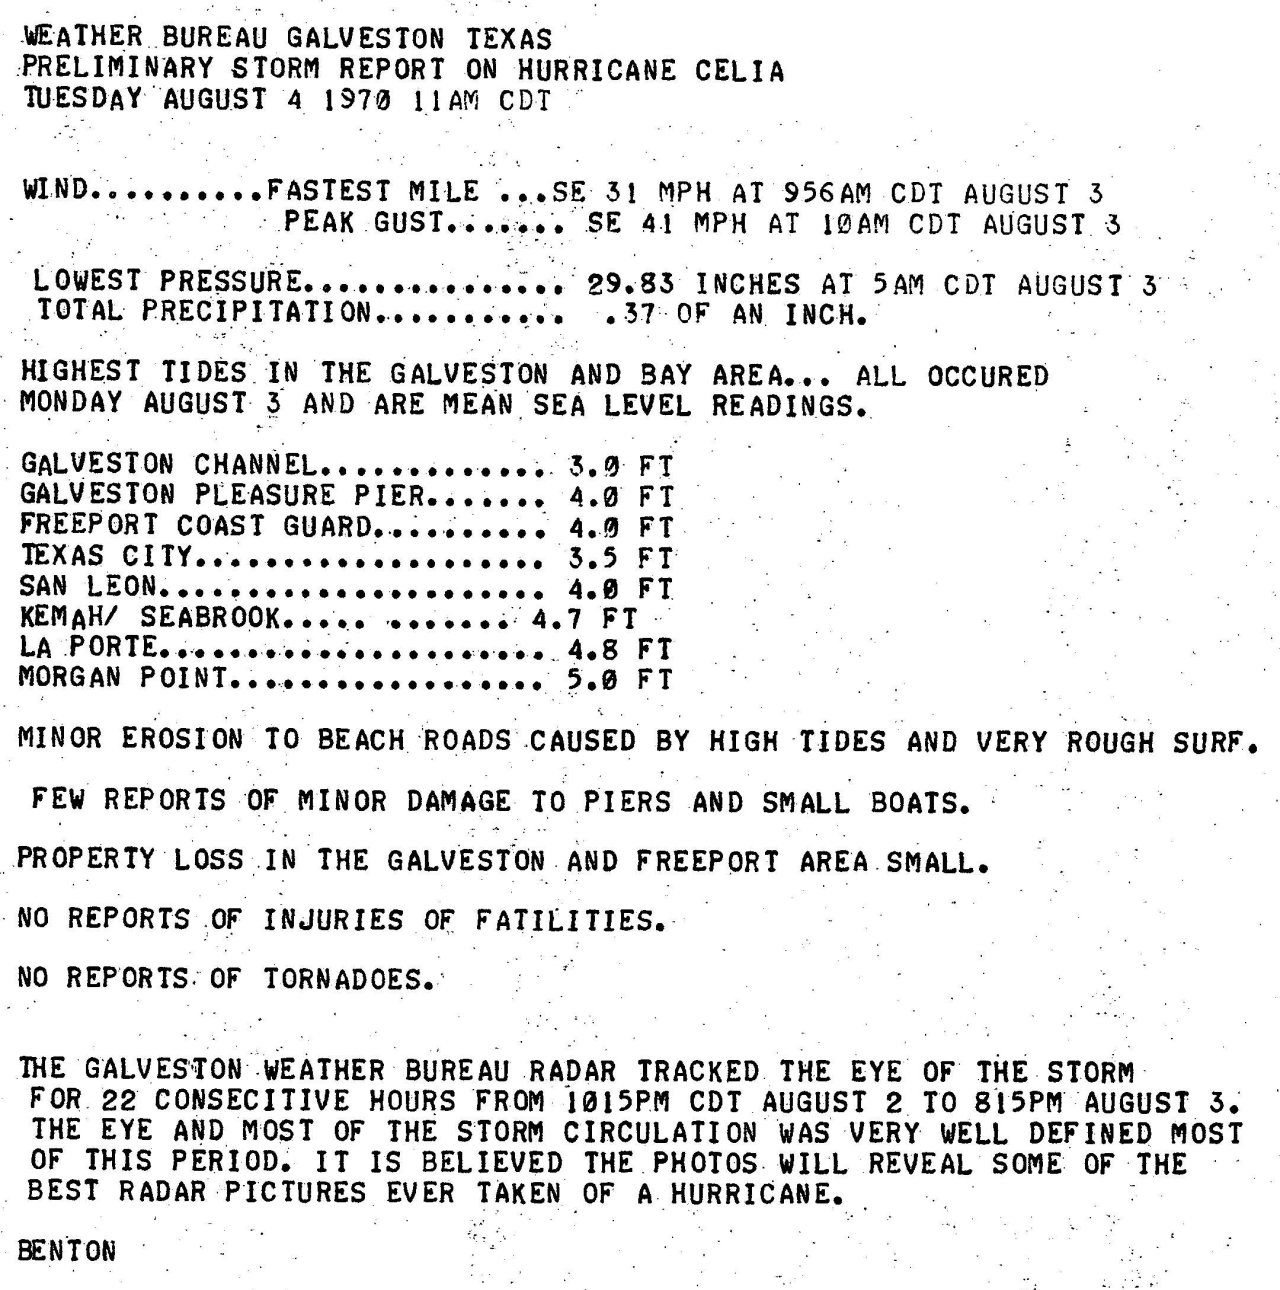
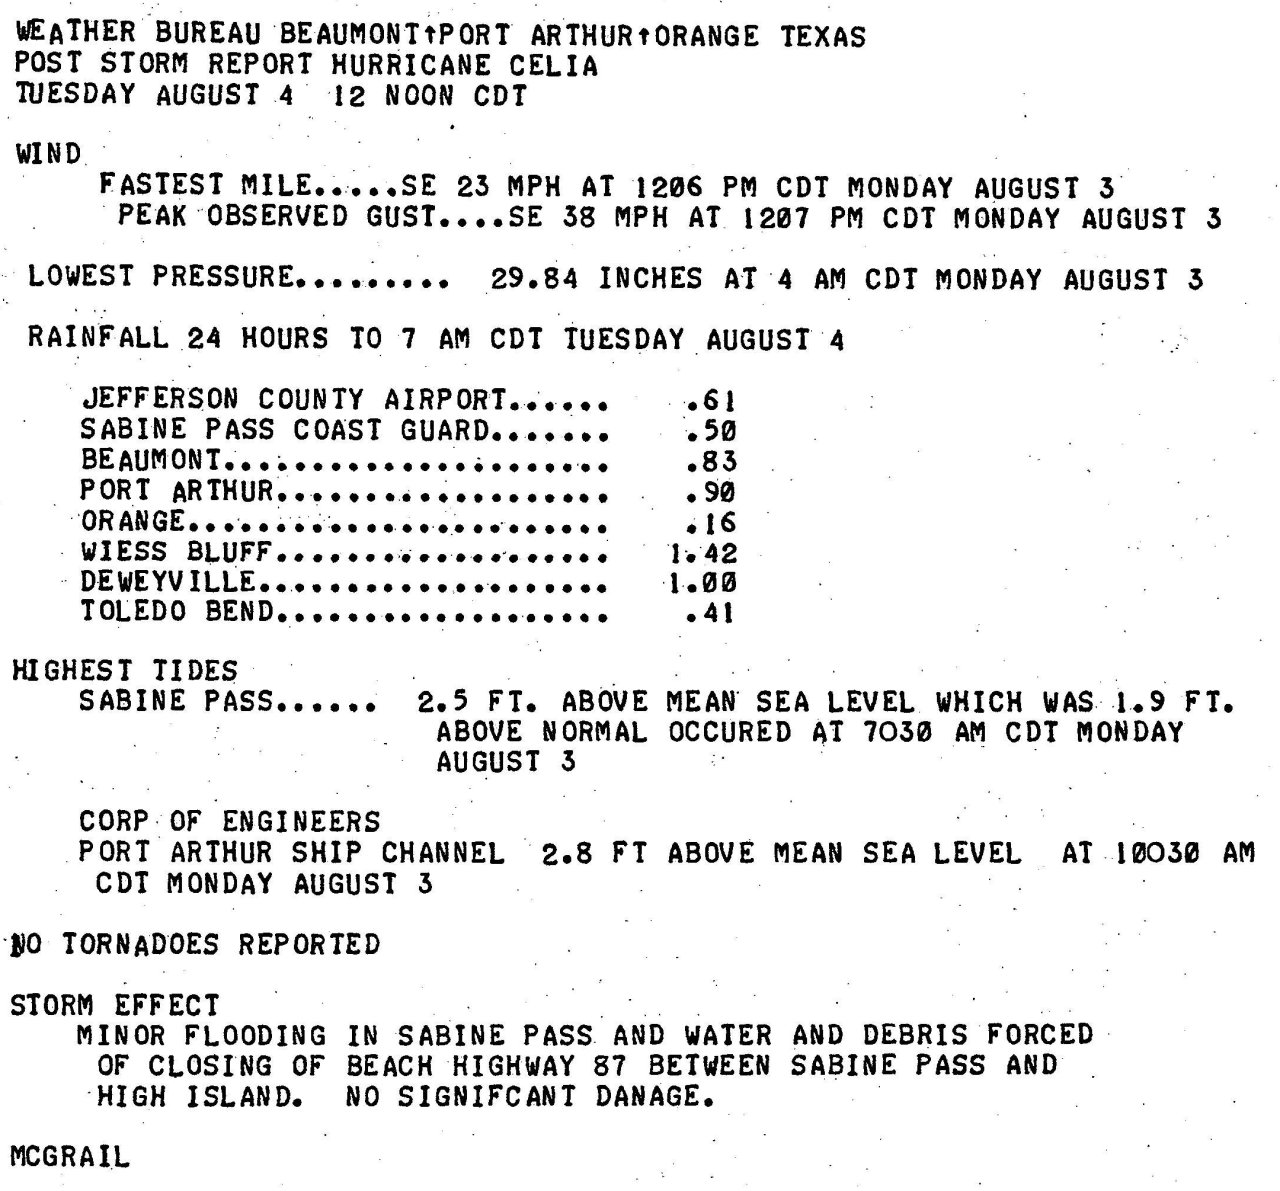
The highest winds were confined within the eyewall of Celia. At the U.S. Weather Bureau in Corpus Christi, Texas, the highest sustained winds of 125 mph (109 knots) and a peak wind gust of 161 mph (140 knots) was recorded at 5:28 PM CDT August 3rd. Similar sustained winds and gusts were noted around the eyewall, with many cases, destroying the anemometer. Further up the Texas coast at the U.S. Weather Bureau in Port Arthur, the highest sustained winds of 23 mph (20 knots) and a peak wind gust of 38 mph (33 knots) was recorded at 1:07 PM CDT August 3rd. No tropical storm force winds were recorded across Southeast Texas or Southern Louisiana. For complete meteorological statistics, see the Wind and Pressure section.
STORM SURGE:
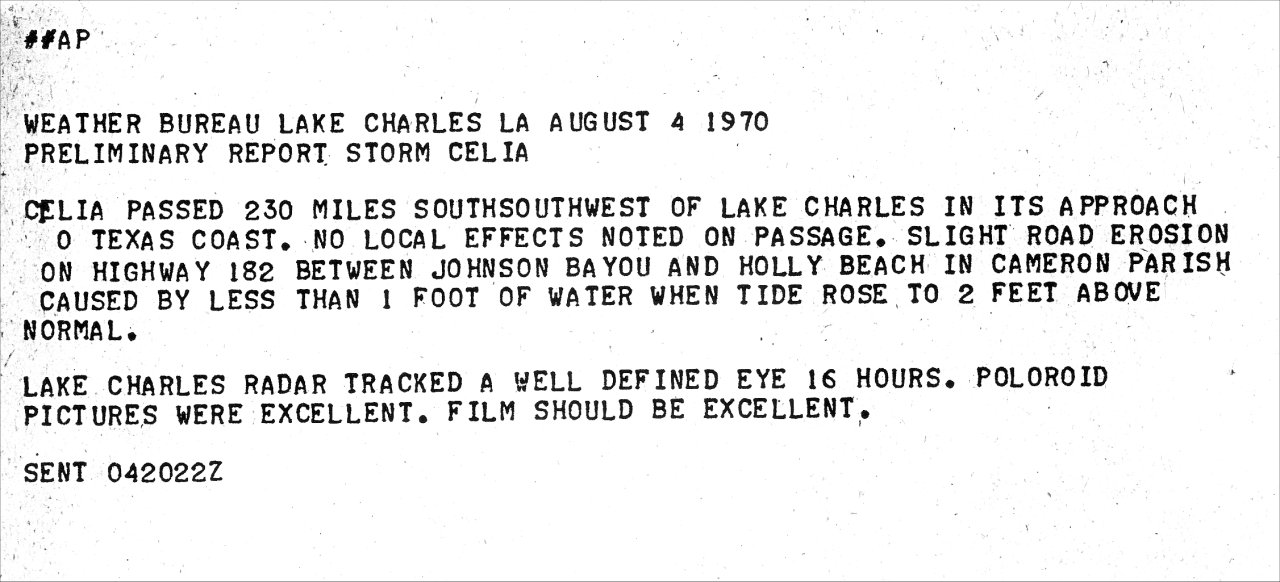
The greatest storm surge was confined near and to the right of landfall across the Central and South Texas coast where 8 to 10 feet MSL was recorded near Aransas Pass, Texas. The highest storm surge across Jefferson County was 2.8 feet MSL at 2.5 feet MSL at Port Arthur Ship Channel and 2.5 feet MSL at Sabine Pass. The highest storm surge of 2.0 feet MSL at Cameron, LA. Minor damage to Highway 87 between High Island and Sabine Pass in Jefferson County and Highway 82 between Johnsons Bayou and Holly Beach in Cameron Parish. For other storm surge and high-water marks across our region, see the Storm Surge section.
RAINFALL:
Rainfall was limited to the northernmost bands that generated 1-2 inches along the coastal parishes and counties, and less than an inch further inland. The highest rainfall across our region was 2.48 inches in Jeanerette, Louisiana. The highest storm total rainfall was 7.26 inches in Robstown, Texas. For complete rainfall totals reported across our region, see the Rainfall section.
TORNADOES:
Several tornadoes ranging from F0 to F2 occurred in the outer bands of Celia the afternoon and even of August 3rd across South Texas. For complete details on all the tornadoes reported, see the Tornadoes section.
|

