
Flash flooding threatens areas from the Tennessee Valley to the Carolinas as storms repeat along a stalled front. Monsoonal storms may trigger flooding in the Southwest. Dangerous heat expands across the Desert Southwest, Plains, mid-Mississippi Valley and Southern Tier. Critical fire weather for interior Pacific Northwest. Cooler, drier air brings brief relief to the Great Lakes and Northeast. Read More >
The Tornado Climatology for the NWS North Platte County Warning and Forecast Area
from 01 January 1950 to 31 December 2008
Teresa Keck
NWSFO North Platte
North Platte, Nebraska
The North Platte County Warning Forecast Area (CWFA) lies within the Great Plains region referred to as “Tornado Alley”, and shown in Figure 1. The region consists of the natural topography and terrain that favor ingredients for the generation of thunderstorms that can produce tornadoes. This climatology study will review tornado data, occurrences, and verification aspects for the North Platte CWFA from 01 January 1950 to 30 June 2008. The study also presents the challenge in forecasting and verifying tornado events where the disparity between square miles and the population base is a limiting factor in verification.
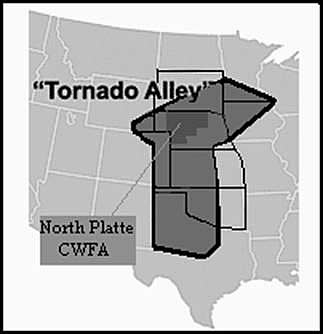
Figure 1. Tornado Alley Adapted SRH Jetstream
For this study, NCDC Storm Events and SeverePlot datasets were used to complete graphs representing the period of over 50 years. The climatology datasets originate with the National Severe Storms Forecast Center (NSSFC), which is known today as the Storm Prediction Center (SPC). In 1976, tornado climatology records were updated through a collaborative process between NSSFC and the Nuclear Regulatory Commission (NRC). The updated records are included in the SeverePlot program that covers the period from 1950 to 2003. To include the most recent records the NCDC Storm Events database was used to compile tornado events to June 2005. Non-rated events are included in this study and noted using an “F” notation in F-scale diagrams.
The North Platte CWFA includes 26 counties in Western and North Central Nebraska. In Figure 2 the map identifies the 26 counties that encompass 42.7 percent of the state of Nebraska, with Cherry County encompassing the largest area with 5,961 square miles. The topography follows a gradual rise from the east to west, with the elevation rising from around 1200 feet in the east and ranging from 3500 to 4280 feet in the west. The highest point within the North Platte CWFA is Wolf Hill at 4280 feet, in Sheridan County.
The forecast area is largely agricultural and open rangeland. The land coverage is identified by the high plains, sandhills, canyons, and loess plains that are prime development regions for farming and livestock. The Nebraska Department of Agricultural recognizes Cherry County as the nation’s top cattle producing county in the United States, followed closely by Holt and Custer counties in cattle production.
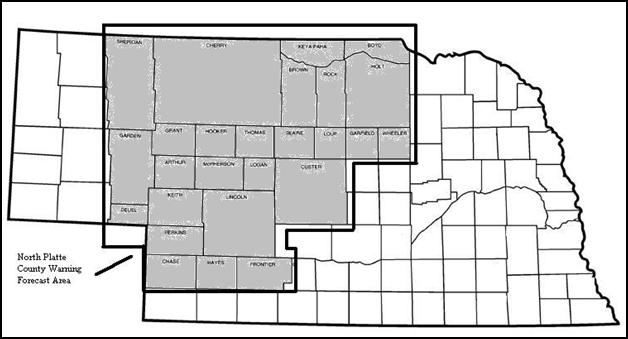
Figure 2. North Platte CWFA includes 42.7 percent of the land area within Nebraska
a. Population
In Nebraska the population density generally decreases from east to west. In 2003, the U.S. Census Bureau estimated that 109,183 people lived within the North Platte CWFA. Their data also suggests that there are 22.3 persons per square mile in Nebraska based on 2003 data. Yet in the North Platte CWFA, population decreases significantly to less than 1 person per square mile in at least five counties. For the North Platte CWFA the geographic information is shown in Table 1. The U.S. Census Bureau data estimates are broken down for population per square mile for each county.
|
County |
2003 Population |
Square Miles |
County Pop per sq mi. |
|
County |
2003 Population |
Square Miles |
County Pop per sq mi. |
|
Arthur |
398 |
718 |
0.6 |
|
Holt |
11,078 |
2,413 |
4.6 |
|
Blaine |
533 |
711 |
0.7 |
|
Hooker |
737 |
721 |
1.0 |
|
Boyd |
2,330 |
540 |
4.3 |
|
Keith |
8,472 |
1,109 |
7.6 |
|
Brown |
3,490 |
1,221 |
2.9 |
|
Keya Paha |
953 |
773 |
1.2 |
|
Chase |
4,041 |
895 |
4.5 |
|
Lincoln |
34,802 |
2,575 |
13.5 |
|
Cherry |
6,053 |
5,961 |
1.0 |
|
Logan |
710 |
571 |
1.2 |
|
Custer |
11,542 |
2,576 |
4.5 |
|
Loup |
744 |
570 |
1.3 |
|
Deuel |
2,053 |
440 |
4.7 |
|
McPherson |
542 |
859 |
0.6 |
|
Frontier |
2,904 |
975 |
3.0 |
|
Perkins |
3,057 |
883 |
3.4 |
|
Garden |
2,193 |
1,731 |
1.3 |
|
Rock |
1,613 |
1,008 |
1.6 |
|
Garfield |
1,841 |
570 |
3.2 |
|
Sheridan |
5,808 |
2,469 |
2.4 |
|
Grant |
695 |
783 |
0.9 |
|
Thomas |
669 |
713 |
0.9 |
|
Hayes |
1,104 |
713 |
1.5 |
|
Wheeler |
821 |
575 |
1.4 |
Table 1. County population and square miles
The U.S. Census Bureau estimates show that Arthur County is the lowest populated county within the state of Nebraska at 398 people. The North Platte CWFA contains 10 counties where the population is less than a 1000 people. The highest population resides in Lincoln County at 34,802. To put in prospective the verification challenge that exists, Arthur and McPherson counties each have 0.6 persons per square mile, which represents fewer people to observe and submit reports on tornado events. When the threat exists for tornadoes, advance notification to emergency managers and spotter groups provides the opportunity to have networks in place when and where the threat exists in order to supplement ground truth from the observing community.
b. Agricultural and Livestock
In Nebraska the economic impact of agricultural and livestock is significant. NAIP states that cattle out number people by a 4 to 1 ratio as the combined number of cows and heads total nearly 6.64 million (NAIP, 2006). As hazardous weather develops the agricultural and livestock industry are interested in where and when tornadic storms may hit, and the potential economic loses that may occur.
The precedent to issue tornado warnings was set in 1948 by Major Fawbush and Captain Miller, after a devastating tornado hit Tinker Air Force Base, in Midwest City, Oklahoma on 20 April 1948. Prior to this date, tornadoes had been an occurrence that kept the public in awe, but the lack of scientific knowledge and forecast ability had limited issuance of tornado warnings by the United States Weather Bureau, which is now the National Weather Service. Major Fawbush and Captain Miller, as documented in the Golden Anniversary files (NSSL, 1998) show the importance of research and cooperation between organizations that work in the field of weather to provide information and lead time for public safety.
Tornado events prior to 1950 are documented in Thomas Grazulis’ book, Significant Tornadoes 1680-1991/a Chronology and Analysis of Events. The book provides detailed tornado information not available in climatic records at NCDC. Grazulis documented one such event in the Keya Paha Valley, in Boyd County in 1901 that is rated in the top ten killer tornadoes within the state of Nebraska.
Modern tornado records, as documented in Storm Data began in earnest in 1954 with records back to 1950 added. The first documented tornado warning event in the North Platte CWFA occurred on 13 May 1951, at 1900 CST. A tornado touched down in Custer County approximately 4 miles southwest of Anselmo, or near 20 miles northwest of Broken Bow. No damage description was made at the time of the event. In 1951 there were four verified tornadoes within the North Platte CWFA.
From 1950 to 2005, the North Platte CWFA has averaged 11 tornado days per year. A tornado day represents the potential for a tornado occurrence on any one day of the year. Storm data records identify a total of 626 tornado events, or number of recorded tornado occurrences since records have been maintained, through June 2005. The data also reflects that an increase in events has occurred in the last ten years as new radar technology came online and spotter networks expanded. Figure 3 depicts tornado events verified by year with a record 44 events in 2004.
Figure 3. Tornadoes from 01/01/1951 to 05/30/2005
5. Tornado events in the North Platte CWFA
a. Tornadoes by Month
In reviewing events by months, tornadoes have occurred from April through November. Tornadoes are shown to begin in April, peak in June, and then decline as we move into the fall season. However in the fall, low top convective storms result in tornadoes that create a secondary peak in October before the season ends in November, as shown in Figure 4.
The data also indicated that 35.6 percent of events occur in June, over 60 percent of events from May through June, and a total of 80 percent from May through July. A small percentage of events have occurred in April, September, October, and November.
While climatic data has shown no tornadoes during the winter season from December through March that is not to say tornado development can not occur during this period
Figure 4. Tornadoes by month
b. Time Occurrences and Peaks
The North Platte CWFA resides within two time zones, central and mountain, therefore all event times have been converted to Central Standard Time (CST) as a point of reference. In Figure 5 the peak time for tornado development is shown between 5 PM to 6 PM CST. The majority of tornado events occur in the late afternoon and evening, with 50 percent of verified tornado events between 4 PM to 8 PM CST.
Figure 5. Tornado Peak Time
A review of all event times showed that tornadoes have occurred for all hours except from 3 AM to 5 AM CST. Tornado development focuses between the hours from 2 PM to 11 PM CST.
The peak time for tornadic development follows the maximum heating of the day as forcing mechanisms overcome convective inhibition. Yet if significant forcing is present the need for surface heating is not a prerequisite as shown in the number of tornado events that have occurred during the late night or early morning periods. Hourly time plots are provided geographically in Appendix A.
c. Tornadoes by County
Tornadoes have been recorded in each county, with Figure 6 identifying the number of tornadoes from January 1950 to June 2005. There have been 70 or more events in three counties, including Custer, Lincoln, and Holt. Through June 2005, Custer County has seen the greatest frequency of tornadoes with 79 verified events.
Figure 6. Tornadoes per county
d. Tornado Path Lengths and Width
In Storm Data the longest path length recorded is 72 miles when an F4 tornado moved across southwest Lincoln County on 29 October 1956. The maximum tornado width recorded is 1000 yards when an F3 tornado tracked from 6 miles south of Brady to 4 miles southwest of Maxwell on 17 May 2000. The potential path length and width of tornadoes are subjective. Past events show that the majority of events are short-lived in duration.
Since 1950, only one tornado related death has been recorded, that death occurred in a vehicle. The death occurred 18 June 1975, at 2015 PM CST, when a pickup was lifted off Highway 92 just west of Arnold, in Logan County. This death was a result of a tornado that moved through southwest Custer County into southeast Logan County and was rated as an F3. The tornado event was well documented as part of a family of tornadoes surveyed by Dr. Theodore Fujita (Grazulis, 2003). The survey that began in Red Willow County ended in southeast Logan County, encompassing a total of five counties and eight tornadoes.
Tornado related injuries have occurred in 14 counties in the North Platte CWFA. From 28 events there are a total of 68 injuries. Table 3 lists injuries by county.
|
County |
Injuries |
|
County |
Injuries |
|
Boyd |
8 |
|
Holt |
5 |
|
Brown |
1 |
|
Keith |
1 |
|
Chase |
3 |
|
Lincoln |
7 |
|
Cherry |
8 |
|
Logan |
3 |
|
Custer |
15 |
|
Perkins |
1 |
|
Deuel |
2 |
|
Sheridan |
8 |
|
Frontier |
2 |
|
Wheeler |
2 |
Table 3. Counties where injuries reported from 1950 to 2005
2. Tornado Size and Strength
The North Platte CWFA land use is largely agricultural and open rangeland. The 2003 census stated that smaller counties have shown a decline in population over the last ten years. Moritz and Guyer (2003) highlighted difficulties shown in rating tornado strength and size in regions that are agricultural based. Storm Data records show that 540 of the 626 events recorded have been rated weak (F0-F1). While some tornadoes may have been large, the tracks have generally occurred in open terrain. Just five tornadoes have been rated violent (F4-F5) in the North Platte CWFA. From these five, two events occurred in Custer County, and one each in Holt, Lincoln, and Rock counties. These five significant events were documented prior, or near to the timeframe, of the current F-scale rating designed in 1971, and accepted by the National Weather Service as the standard for tornado ratings in 1973. Each event occurred in agricultural and open rangeland, with all but one long-lived, border crossing events. These significant tornadoes would more likely have been rated lower if using the adjusted or updated parameters of today. Prior to 1985, several events were recorded, but without an actual F-Scale rating and are identified by the letter F in Figure 7.
Figure 7 shows the F-scale rating for tornado events to date. Tornado plots for each F-scale are provided in Appendix B. A chronological listing of top five events in the categories of F-scale, injuries and number of tornadoes on one day, most costly tornado property and crop damages, and deaths are provided in Appendix C.
The F-scale rating by design looks at permanent structures and how they are built to determine estimated tornado strength. The Fugita Tornado Damage Scale from 0 to 5 is shown in Appendix D. The F-scale winds are not to be used literally as speeds, but are intended to reflect a range and can vary up to an F-scale based on many factors as noted by the Storms Prediction Center .
Figure 7. Tornado F-scale events
An enhanced F-scale system was implemented in February 2007. The update to the current F-scale was completed by a team of meteorologists and wind engineers. The enhanced version is more descriptive as to what strength of winds can create certain types of damage. To learn more about the enhanced F-scale system visit the Storm Prediction Web site.
National Climate Data storm data information can be viewed online at https://www4.ncdc.noaa.gov/cgi-win/wwcgi.dll?wwEvent~Storms.
6. Tornado Warning Information and Distribution
The National Weather Service is the primary source for tornado warnings issued, with various media sources that relay the information to the public. Tornado warnings are available through NOAA Weather Radio, World Wide Web, television and radio stations.
NOAA Weather Radio provides direct access to products issued by the National Weather Office. The National Weather Service operates 13 transmitters that serve residents of Western and North Central Nebraska. The transmitters are dispersed throughout the Western and North Central Nebraska into South Central South Dakota as shown in Figure 8.
Figure 8. NWR Transmitter service
For each transmitter the products aired are modified as severe weather develops. The product sweet focuses on the impending hazards. The circles around each transmitter represent the optimal range of reception, around 40 miles. Reception of the broadcast depends on a number of factors including, type of receiver, terrain, weather, and distance from the transmitter. Transmitter sites and frequencies can be found at NWR weather coverage.
b. World Wide Web
The internet provides a direct access to timely warnings, radar, and satellite images through the World Wide Web. The National Weather Service North Platte web site can be accessed at https://w2.weather.gov/lbf/. At this site additional preparedness information can be accessed on tornadoes and warning information.
c. Television and Radio
Tornado warnings are immediately picked up by local television and radio sources through the Emergency Alert System (EAS). The National Weather Service works with the local sources to ensure the EAS is in working order, with weekly alarm test conducted each Wednesday. The weekly test also provides users with NOAA Weather Radios to test broadcast reception that can vary at any given location.
1. Preparedness
Precautions taken prior to an event can make all the difference. Your National Weather Service Office provides opportunities to learn more information on tornadoes through seasonal storm spotter training preparedness sessions. County emergency managers coordinate training sessions to review concepts in storm identification, communications, and safety for when spotter networks are activated. The county emergency manager is the local resource on county tornado preparations for when storm spotter networks are activated and alarms sounded to notify a community of impending hazardous weather. Spotter preparedness talks can include groups such as fire departments, law enforcement, and local residents. When National Weather Service Doppler radars identify rotation; spotter networks provide ground truth on tornado location, movement, and initial damages. The importance of organized spotter networks can not be understated.
Community preparedness can be enhanced through the National Weather Service StormReady Program. “The StormReady program…helps communities with the communication and safety skills needed to save lives and property–before and during the event. StormReady helps community leaders and emergency managers strengthen local safety programs” (https://www.stormready.noaa.gov/ ). Communities interested in learning more about the StormReady program can contact the local National Weather Service Office or visit the online site for information on how to apply and awareness material.
Advanced preparedness is important. Through advanced planning communities and families know terminology used during tornadoes warnings and watches, and are familiar with safety tips that can save lives. There is no safe place from a tornado—only safer places. The key to survival is advanced planning.
Disaster planning guidelines are available through the local National Weather Service, the Federal Emergency Management Agency (FEMA), and the American Red Cross.
Western and North Central Nebraska experience an average of 11 tornado days per year. Tornadoes have occurred from April through November, usually during the late afternoon and evening hours, with a peak occurrence from 5 to 6 PM CST. History shows that tornadoes can strike counties repeatedly as shown in 2000 when the same homestead near Eustis was hit on two consecutive days in Frontier County. The maximum number of tornadoes that occurred on one day is 13 on May 29, 2004. In 1999, a boundary over the northwest portion of the North Platte CWFA created an environment where 22 tornadoes were observed over a three day period from June 3-5, 1999. The greatest number of tornadoes in one year was 44 set in 2004.
The tornado climatology presented shows when tornadoes have previously occurred in Western and North Central Nebraska. While the data represents historical information, it provides insight for when tornadoes have a higher probability of occurrence. The geographic data also identifies the challenge created through the disparity generated from a low population region that represents 42.7 percent of the state of Nebraska. This information is intended to increase the awareness of tornado occurrences and potential in Western and North Central Nebraska.
9. Acknowledgments
The author would like to acknowledge and thank Angela Oder, Debra Blondin, and John Stoppkotte for their reviews and input.
10. References
Crisp. C. (n.d.). Description of historical events relating to tornado forecasting in the late 1940s and 1950s. Retrieved December 24, 2005, from https://www.nssl.noaa.gov/ GoldenAnniversary/
Grazulis, T. (1993). A chronology and analysis of events: significant tornadoes 1680-1991. St. Johnsbury: Environmental Films.
Guyer, J.& Moritz, M. (2003). On issues of tornado damage assessment and F-scale assignment in agricultural areas. Retrieved October 29, 2005, from http://www.spc.noaa.gov/publications/
Hart, J. & Janish, P. (2003). SeverePlot [Computer software]. Norman, OK:Storm Prediction Center.
National Weather Service Office of Climate, Water, & Weather Services. StormReady Program. Retrieved June 5, 2006 from https://www.stormready.noaa.gov/
Nebraska Agricultural Industry Partnership (2006). Nebraska Livestock. Originally retrieved May 30, 2006. Reference changed August 28, 2010 to Nebraska Department of Agriculture at https://www.nebraskalivestock.org/index.cfm
U.S. Census Bureau (2006). Population Estimates. Retrieved October 30, 2005 from https://www.census.gov/
U.S. Department of Commerce. National Climate Data Center (2006). Storm Events. Retrieved October 22, 2005 from https://www.ncdc.noaa.gov/oa/ncdc.html

