
Heavy to excessive rainfall may produce additional flash flooding Wednesday across parts of the southern Plains where the greatest risk is along the Red River Valley into western Arkansas. Scattered severe thunderstorms are also possible centered on central Texas to eastern Oklahoma and western Arkansas. Large hail, damaging wind, and a few tornadoes will be possible. Read More >
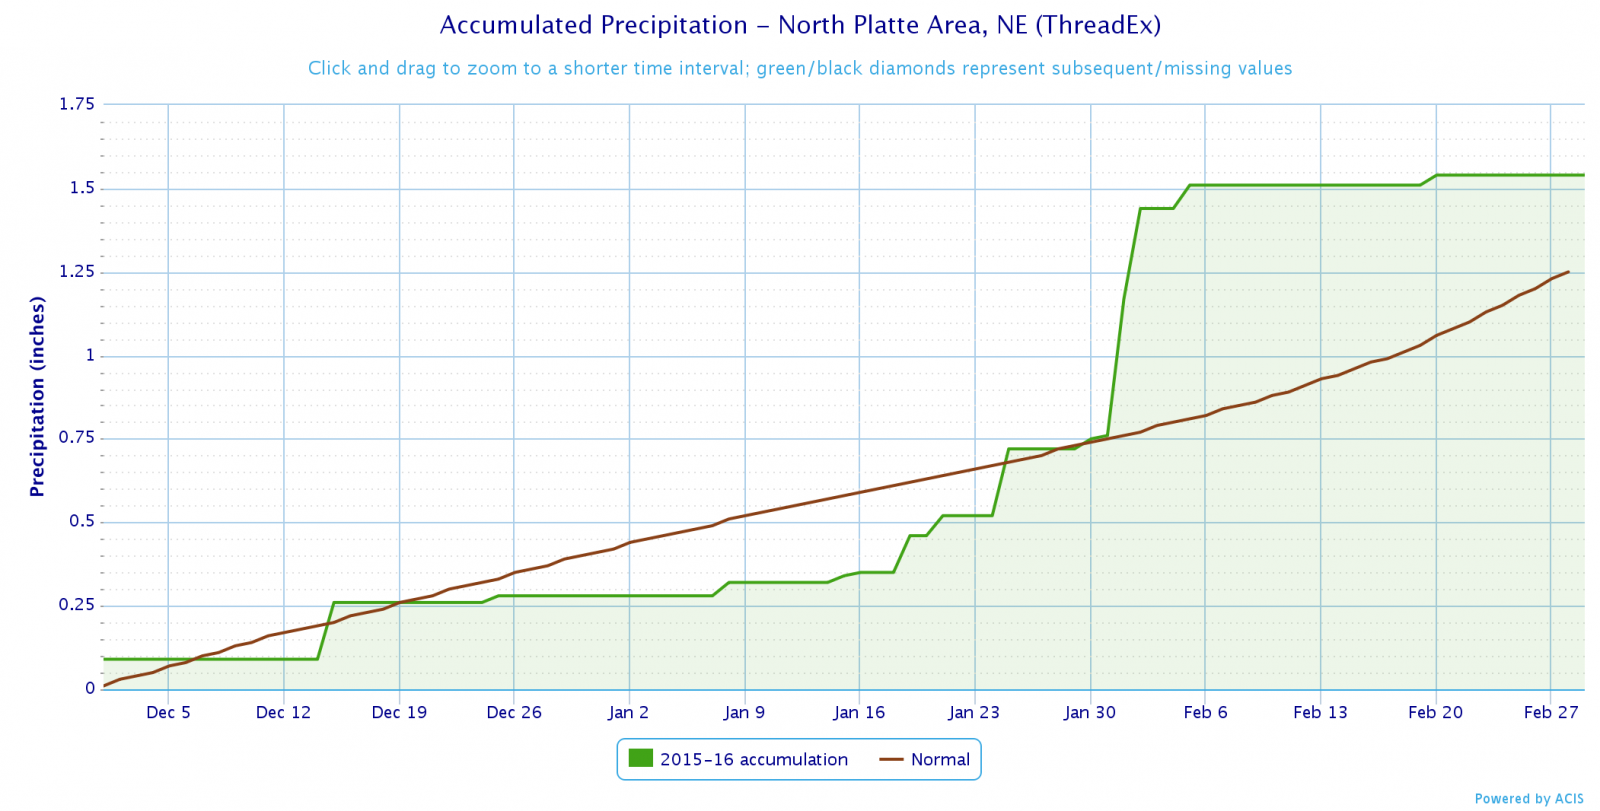
North Platte, NE
Winter Statistics
Facts for the 3 month period of December, January and February
(including the last 5 years)
| Ave High |
Ave Low |
Ave Temp |
Precip | Snowfall | Days Lows < 0 |
Days Highs > 32 |
Days Highs 50+ |
Days Highs 60+ |
|
| Average | 38.8 | 13.4 | 26.1 | 1.37 | 13.8 | 12.5 | 61.6 | 22.8 | 6.4 |
| Max | 47.2 | 22.9 | 34.2 | 4.23 | 34.3 | 42 | 86 | 46 | 23 |
| Year | 1991-92 | 1930-31 | 1991-92 | 1913-14 | 2006-07 | 1978-79 | 1991-92 | 2005-06 | 1980-81 |
| Min | 23.7 | 1.0 | 12.4 | 0.14 | 1.2 | 0 | 25 | 0 | 0 |
| Year | 1978-79 | 1978-79 | 1978-79 | 1980-81 | 1980-81 | 1930-31 1991-92 |
1978-79 | 1978-79 | 10 times latest 2009-10 |
| Last 5 Years | |||||||||
| 2011-12 | 43.9 | 13.1 | 28.5 | 1.67 | 14.1 | 3 | 76 | 28 | 5 |
| 2012-13 | 40.8 | 11.6 | 26.2 | 1.65 | 17.2 | 13 | 68 | 29 | 3 |
| 2013-14 | 38.1 | 8.9 | 23.5 | 1.21 | 19.3 | 17 | 54 | 27 | 5 |
| 2014-15 | 41.3 | 13.4 | 27.3 | 1.78 | 18.5 | 13 | 60 | 27 | 10 |
| 2015-16 | 43.9 | 17.7 | 30.8 | 1.54 | 21.0 | 3 | 73 | 28 | 11 |
| No Top 10 Finishes for the 2015-2016 Winter (Dec, Jan, Feb) |
Temperature and Precipitation Records (1874-1875 to current)
Snowfall Records (1892-1893 to current)
Leap years have 91 days / Non-leap years have 90 days

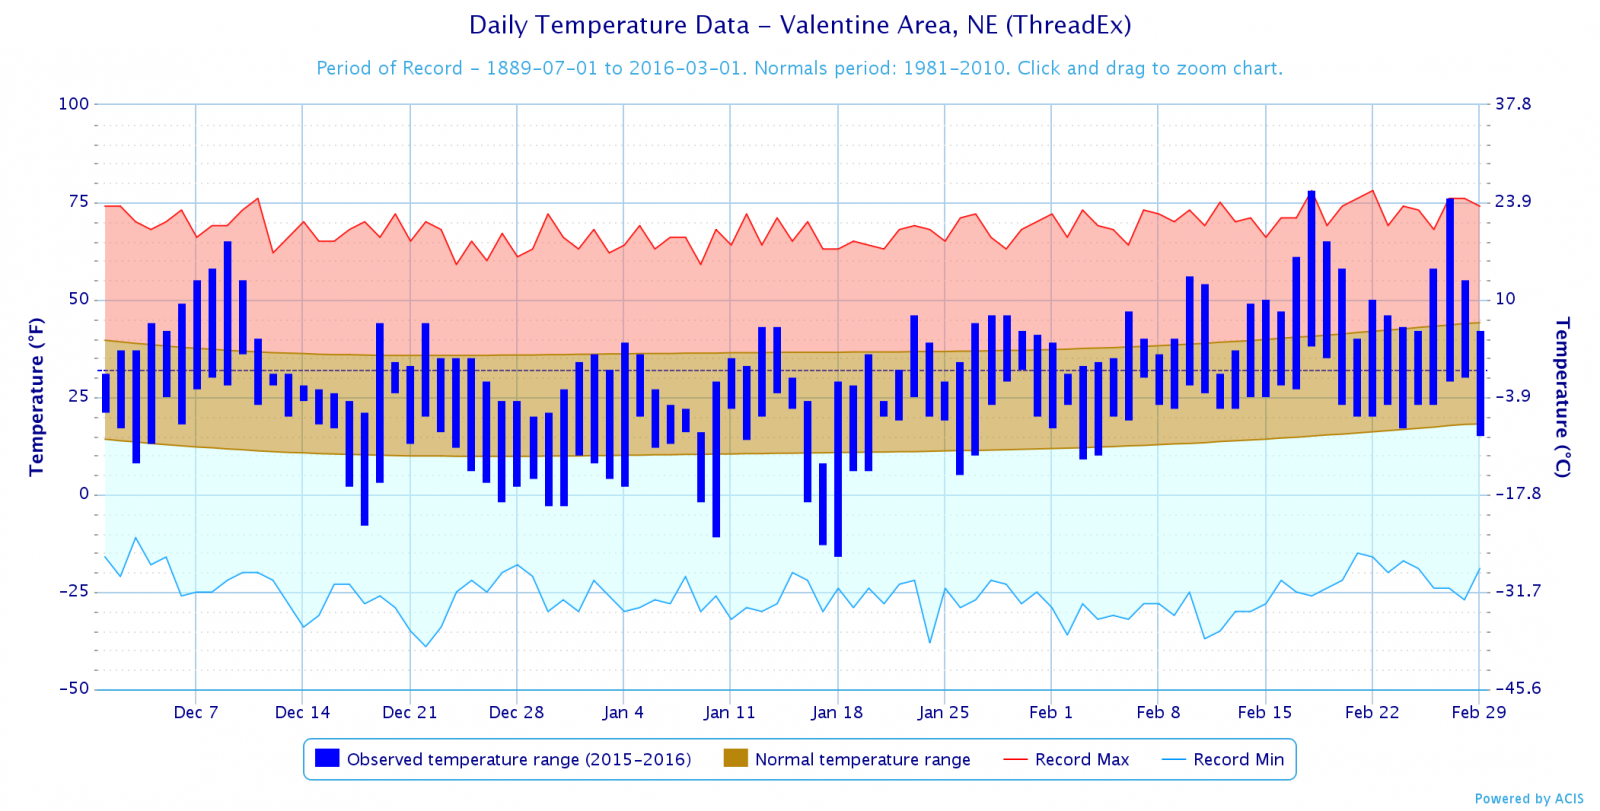
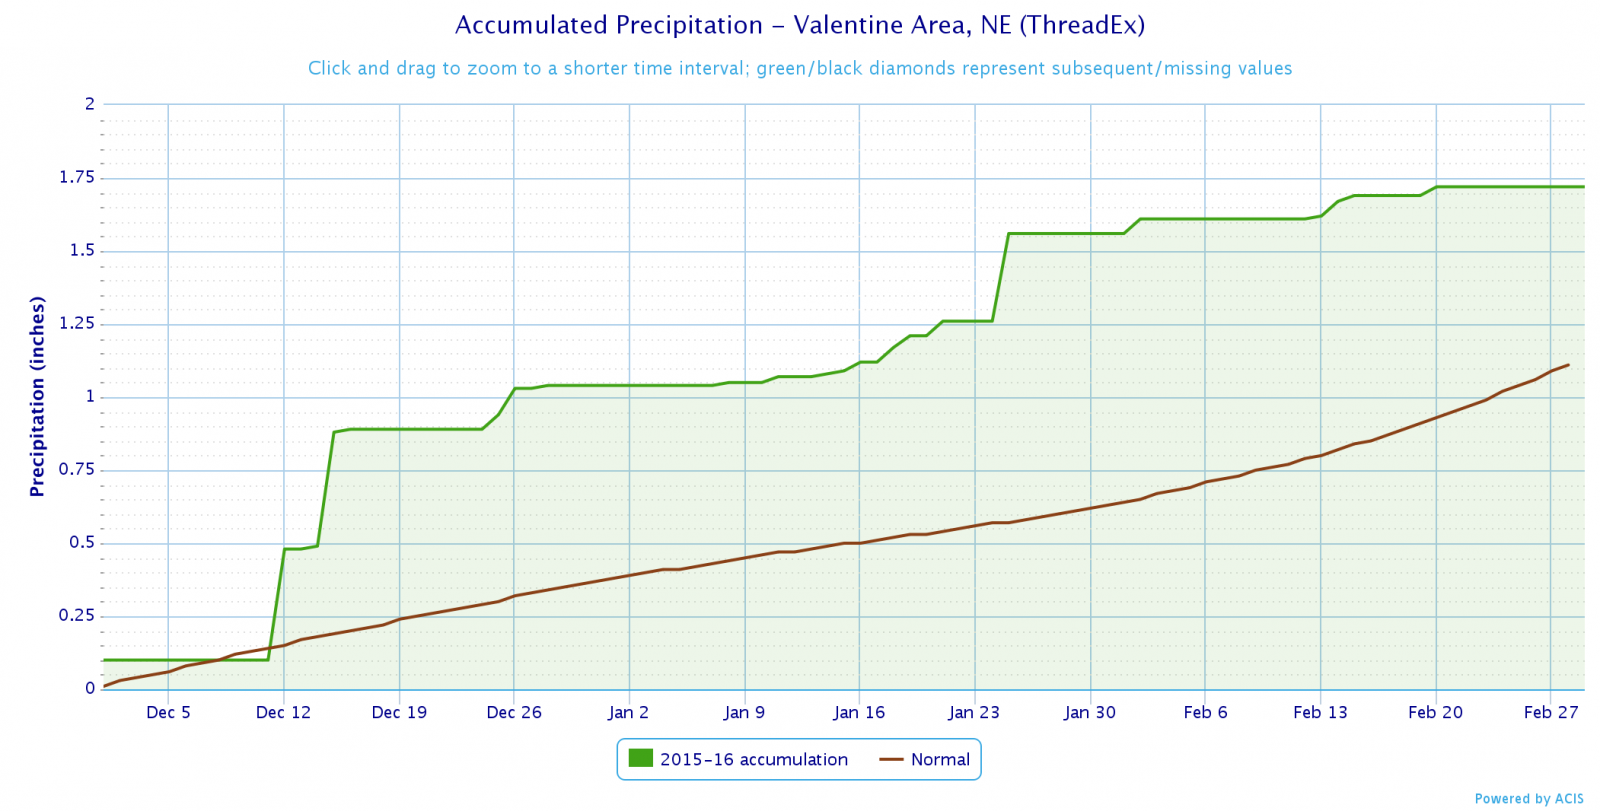
Valentine, NE
Winter Statistics
Facts for the 3 month period of December, January and February
(including the last 5 years)
| Ave High |
Ave Low |
Ave Temp |
Precip | Snowfall | Days Lows < 0 |
Days Highs > 32 |
Days Highs 50+ |
Days Highs 60+ |
|
| Average | 35.8 | 11.3 | 23.5 | 1.38 | 16.5 | 18.1 | 55.4 | 17.6 | 4.5 |
| Max | 44.6 | 20.7 | 31.3 | 3.58 | 42.6 | 48 | 78 | 36 | 12 |
| Year | 1991-92 | 1930-31 | 1930-31 | 1943-44 | 1928-29 | 1978-79 | 1991-92 | 1980-81 | 1961-63 1994-95 1998-99 |
| Min | 22.3 | -2.6 | 9.8 | 0.15 | 4.2 | 2 | 24 | 0 | 0 |
| Year | 1978-79 | 1978-79 | 1978-79 | 1956-57 | 1950-51 | 1930-31 | 1978-79 | 1978-79 | 12 times latest 2009-10 |
| Last 5 Years | |||||||||
| 2011-12 | 42.5 | 14.4 | 28.5 | 2.66 | 13.3 | 7 | 75 | 25 | 8 |
| 2012-13 | 38.6 | 14.2 | 26.4 | 1.52 | 16.9 | 8 | 60 | 24 | 5 |
| 2013-14 | 34.1 | 8.4 | 21.2 | 1.37 | 19.7 | 22 | 51 | 19 | 1 |
| 2014-15 | 38.8 | 12.4 | 25.6 | 1.52 | 15.3 | 19 | 61 | 23 | 11 |
| 2015-16 | 38.5 | 16.4 | 27.5 | 1.72 | 21.1 | 9 | 61 | 15 | 5 |
| Top 10 Finishes for the 2015-2016 Winter (Dec, Jan, Feb) | |
| Rank | Average Low Temperature "Warmest" (Year) |
| 1 | 20.7 (1930-1931) |
| 2 | 17.9 (1953-1954) |
| 3 | 17.8 (1920-1921) |
| 4 | 17.8 (1982-1983) |
| 5 | 17.8 (1997-1998) |
| 6 | 17.5 (1925-1926) |
| 7 | 17.4 (1991-1992) |
| 8 | 16.5 (1933-1934) |
| 9 | 16.4 (2015-2016) |
| 10 | 16.3 (1940-1941) |
Temperature and Precipitation Records (1889-1890 to current - missing 1892-1893)
Snowfall Records (1900-1901 to current)
Leap years have 91 days / Non-leap years have 90 days
 |
Page composition by Matt Masek March 2, 2016 |
 |

