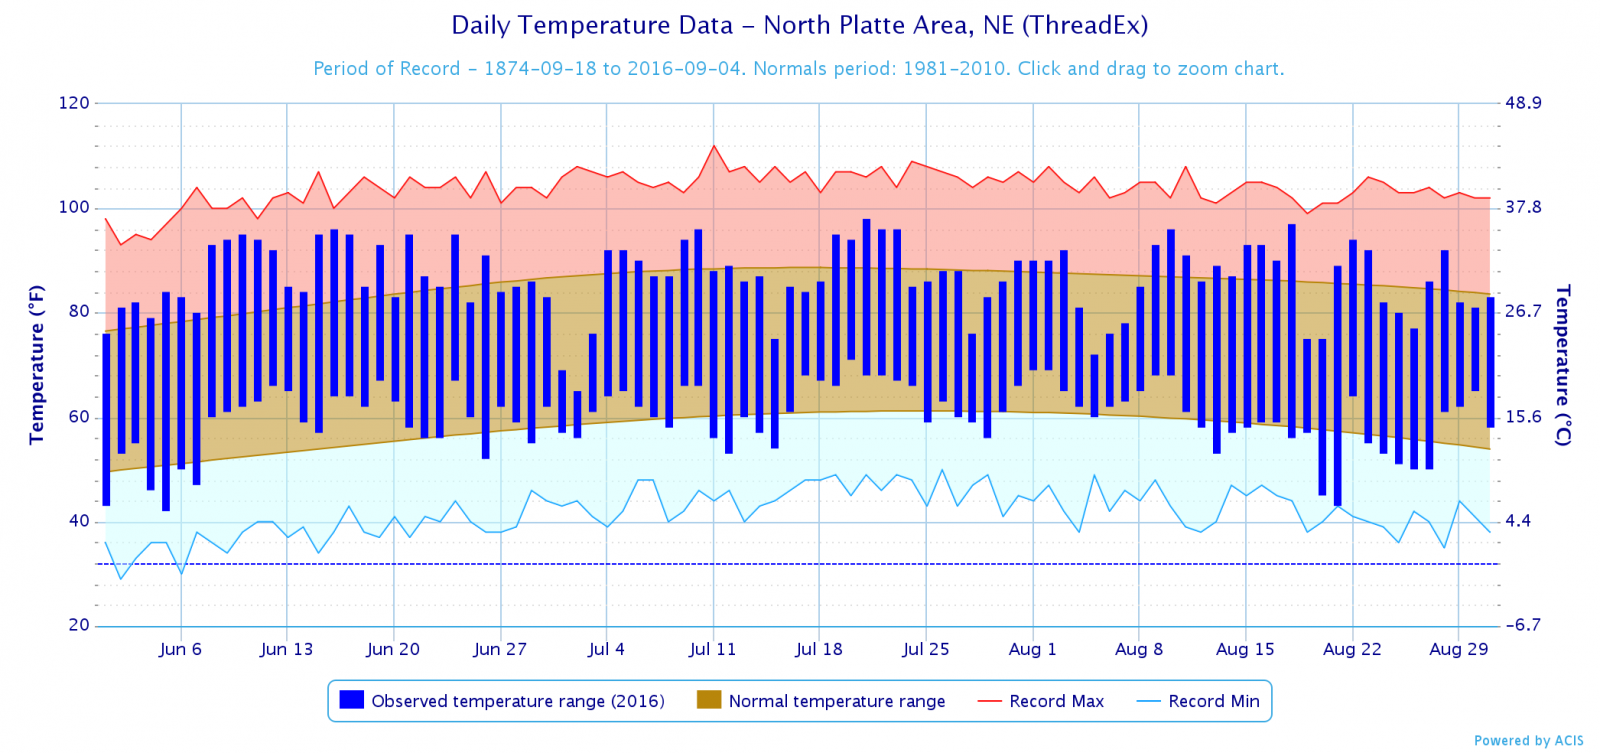
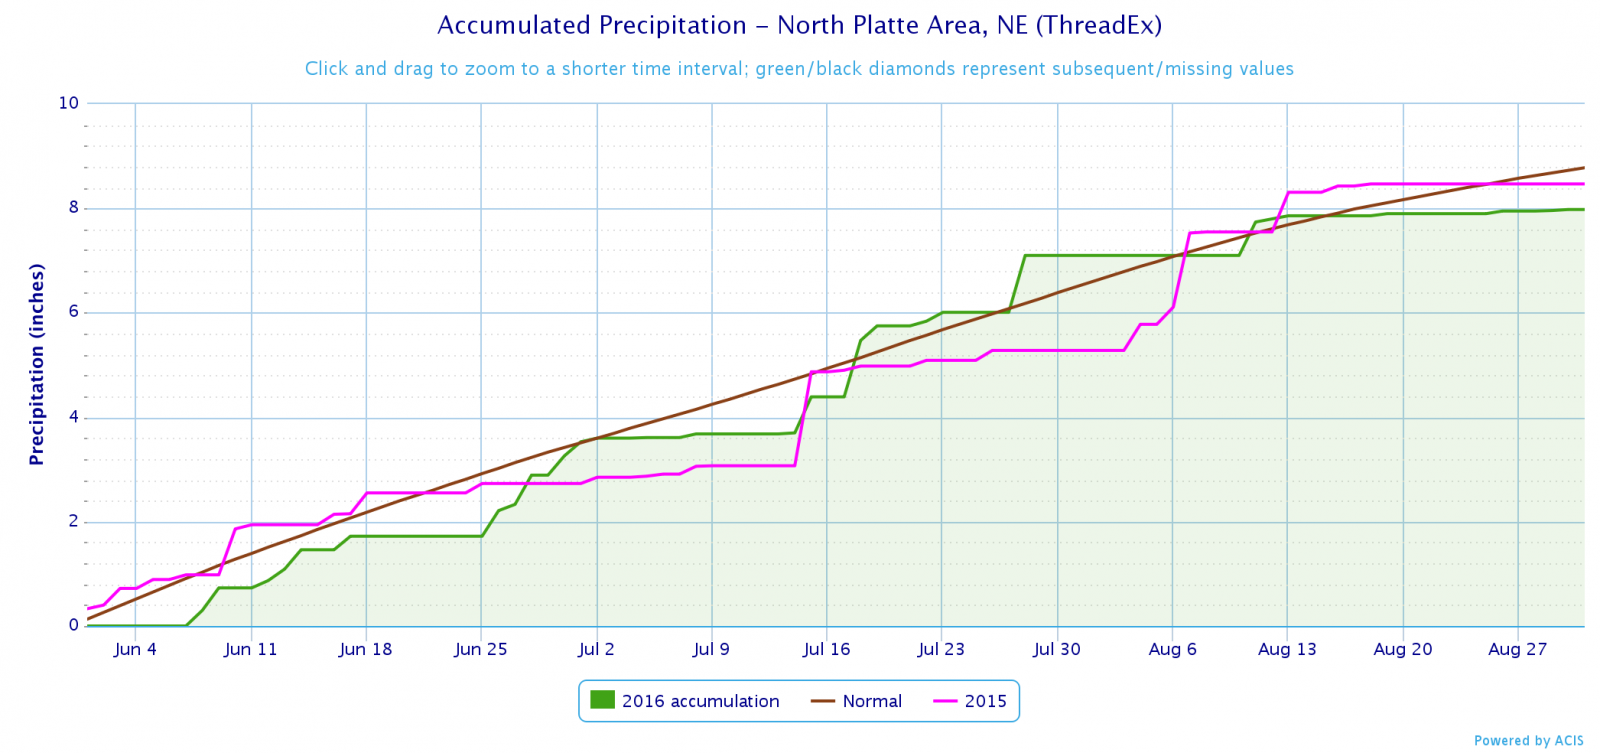
North Platte, NE
Summer Statistics
Facts for the 3 month period of June, July and August
(including the last 5 years)
| Ave High |
Ave Low |
Ave Temp |
Precip | Days Lows < 50 |
Days Highs 80+ |
Days Highs 90+ |
Days Highs 100+ |
|
| Average | 85.1 | 59.0 | 72.1 | 8.32 | 8.5 | 69.7 | 30.7 | 3.4 |
| Max | 93.5 | 64.2 | 78.2 | 18.22 | 28 | 88 | 65 | 29 |
| Year | 2012 | 1934 | 1936 | 1951 | 2004 | 2012 | 2012 | 1936 |
| Min | 78.1 | 54.6 | 66.9 | 2.65 | 0 | 42 | 4 | 0 |
| Year | 1915 | 1992 | 1992 | 2012 | 1921 1932 1933 |
1915 | 1915 | 42 times (last 2016, 2015 & 2010) |
| 2012 | 93.5 | 58.7 | 76.1 | 2.65 | 13 | 88 | 65 | 23 |
| 2013 | 86.7 | 58.8 | 72.7 | 8.20 | 11 | 74 | 34 | 5 |
| 2014 | 84.7 | 57.2 | 70.9 | 13.99 | 10 | 74 | 24 | 1 |
| 2015 | 85.0 | 58.3 | 71.6 | 8.47 | 7 | 73 | 24 | 0 |
| 2016 | 86.7 | 59.6 | 73.2 | 7.98 | 6 | 79 | 36 | 0 |
| No Top 10 Finishes for the 2016 Summer (Jun, Jul, Aug) for North Platte |
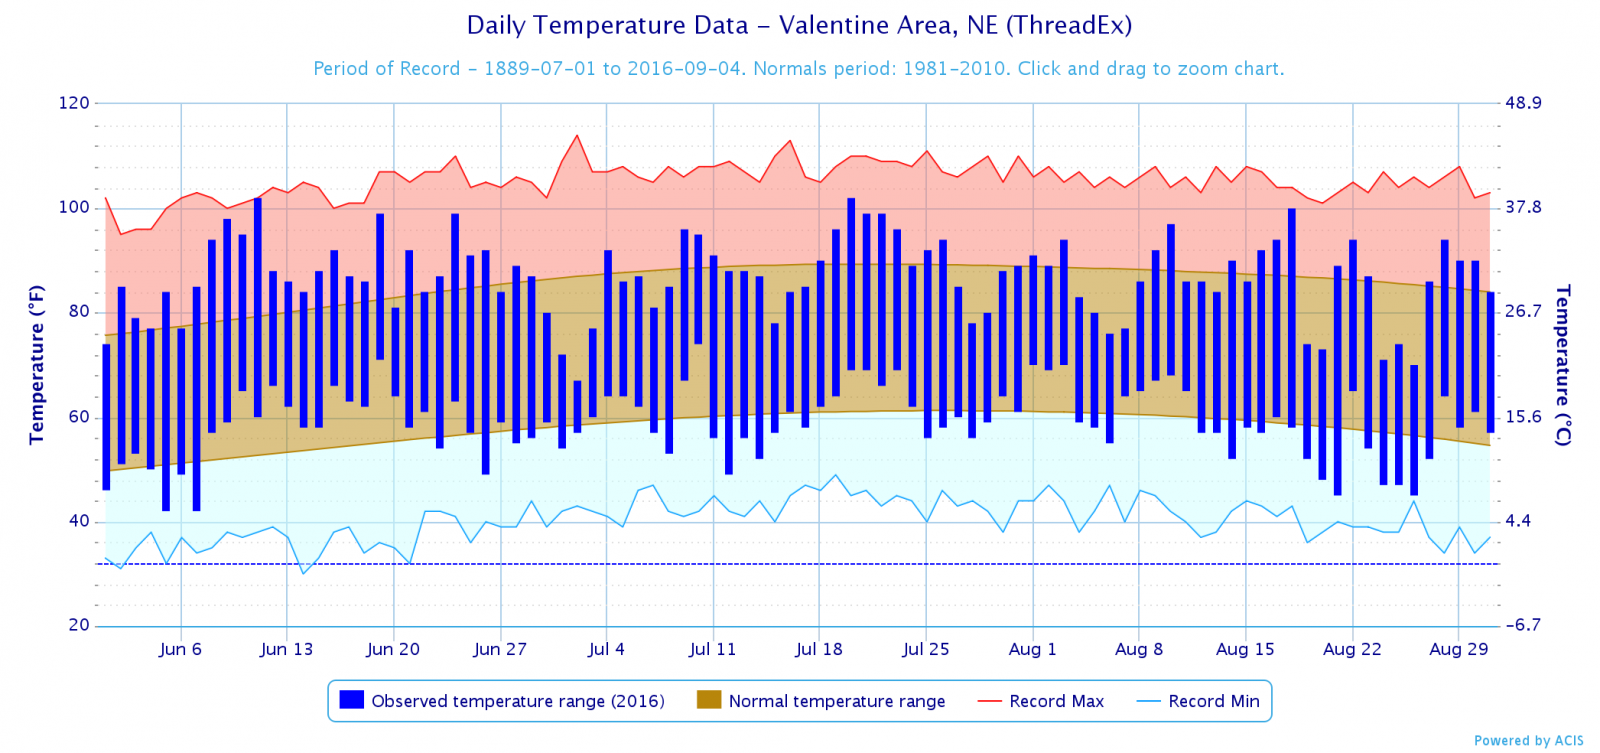
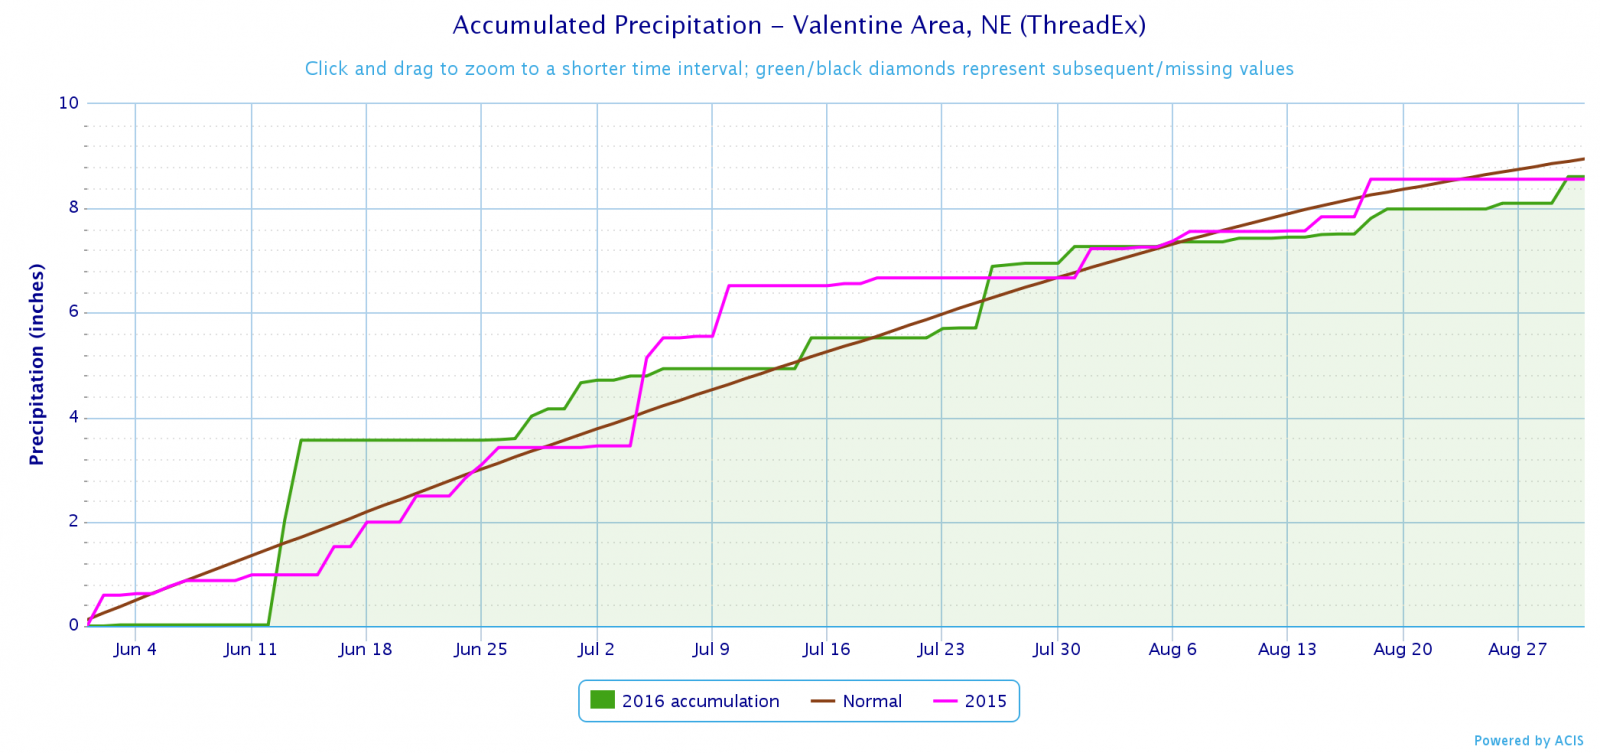
Valentine, NE
Summer Statistics
Facts for the 3 month period of June, July, and August
(including the last 5 years)
| Ave High |
Ave Low |
Ave Temp |
Precip | Days Lows < 50 |
Days |
Days Highs 90+ |
Days Highs 100+ |
|
| Average | 84.7 | 58.0 | 71.3 | 8.29 | 11.5 | 66.2 | 30.6 | 5.0 |
| Max | 93.6 | 63.9 | 77.7 | 16.88 | 28 | 87 | 61 | 28 |
| Year | 2012 | 1936 | 1936 | 1983 | 2004 1992 |
2012 | 2012 | 1936 |
| Min | 76.6 | 52.3 | 65.4 | 2.76 | 1 | 38 | 2 | 0 |
| Year | 1915 | 1992 | 1915 | 2012 | 1933 | 1915 | 1915 | 14 times (last 2009) |
| 2012 | 93.6 | 60.4 | 77.0 | 2.76 | 11 | 87 | 61 | 26 |
| 2013 | 84.7 | 60.0 | 72.3 | 8.24 | 7 | 69 | 24 | 3 |
| 2014 | 83.4 | 57.0 | 70.2 | 11.83 | 14 | 65 | 19 | 2 |
| 2015 | 84.9 | 57.9 | 71.4 | 8.56 | 7 | 70 | 26 | 2 |
| 2016 | 87.0 | 58.6 | 72.8 | 8.61 | 11 | 76 | 34 | 3 |
| No Top 10 Finishes for the 2016 Summer (Jun, Jul, Aug) for Valentine |
 |
Page composition by Matthew Masek Updated 2016 |
 |

