Extreme heat continues today from the central Plains to the lower Mississippi River Valley, over southeast Montana, and from southern California into the Southwest Deserts. Extreme Heat Warnings remain in effect. Severe thunderstorms capable of strong to severe wind gusts and large hail are possible across the Great Lakes into the Ohio Valley today into tonight. Read More >
Phew, that was a windy month! April 2022 finished as one of the windiest Aprils over the last half-century or so. Why was it so windy? First, let's take a look at the basics and main causes of wind. Then we'll get into some numbers and a couple of the notable storm systems.
Wind: simply the movement of air...
On the large (planetary) scale, wind is mainly driven by temperature differences between the Equator and the poles, along with the rotation of the Earth. Zooming in a bit to a regional view, a few more factors determine the strength, direction, and overall characteristics of the wind. The main player is pressure, where the location of high and low pressure systems help steer the wind, while the pressure gradient affects the speed. In the northern hemisphere, wind flows clockwise around high pressure and counter-clockwise around low pressure. As for the gradient, the steeper it is, usually the faster the wind. The gradient can be measured by counting the isobars (lines of equal pressure) on a surface weather map. So what can affect pressure changes? Temperature! The greater the change in temperature between two air masses can be tied to a greater pressure change. One way to see how temperature and pressure are related: having to put air in the tires during winter! Zoom in even further to a local view, and then we deal with terrain (mountains, valleys), land/water interactions (sea breeze), erratic effects with thunderstorms, etc.
The chart below shows the seasonality of wind in western Nebraska. Spring typically features the greatest speeds, while April, on average, is the windiest month. A smaller second peak occurs in the fall. So, what happens in Spring? Taking into account the first paragraph, this is when storm systems feed off the battle between the Arctic air from the north and the increasingly warm, moist air from the Gulf of Mexico. Areas of low pressure often become deeper (lower), producing larger differences in surrounding areas. A common storm track that affects Nebraska is a developing low pressure off the Colorado Rockies and a northeastward trek toward the Great Lakes. Aside from temperature and pressure changes near the surface, big differences also occur in the upper atmosphere, including the jet stream. The jet tends to be in the vicinity of Nebraska during the spring and fall, while it lies well to the north during summer and south during winter.
The next tabs take a closer look in what made April 2022 windier than the typical breezy April.

It may be no surprise this April was unusually windy...
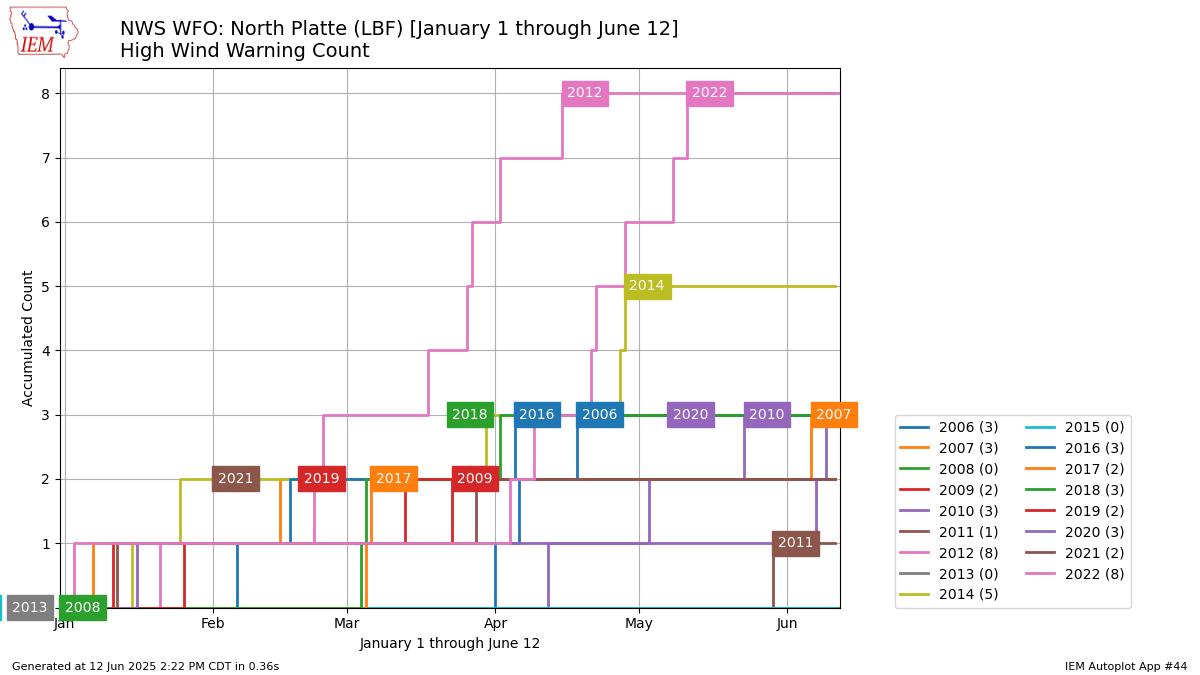
One way to look at the data is the count of High Wind Warnings. A High Wind Warning is issued when sustained winds exceed 40 mph or gusts reach 58 mph (without the influence of thunderstorms). Five warnings were issued in April, the most in recent history. The year-to-date tally of six warnings is the most in ten years. On a related note, the combination of these strong winds and the dry stretch/drought led to a vast increase in Red Flag Warnings due to critical fire weather conditions compared to recent years.
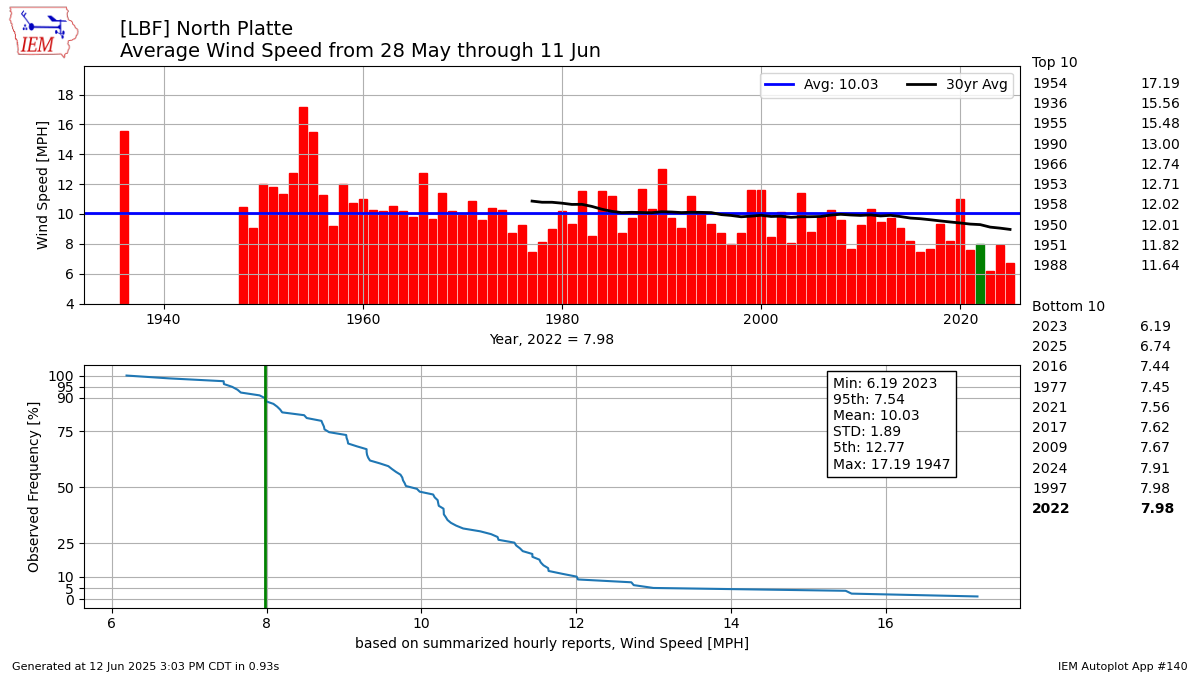
With an average monthly wind speed of around 15 mph, April 2022 finishes in the top 5 windiest Aprils dating to 1948. The past three Aprils were right around 10 mph, while the long-term average is near 12 mph.
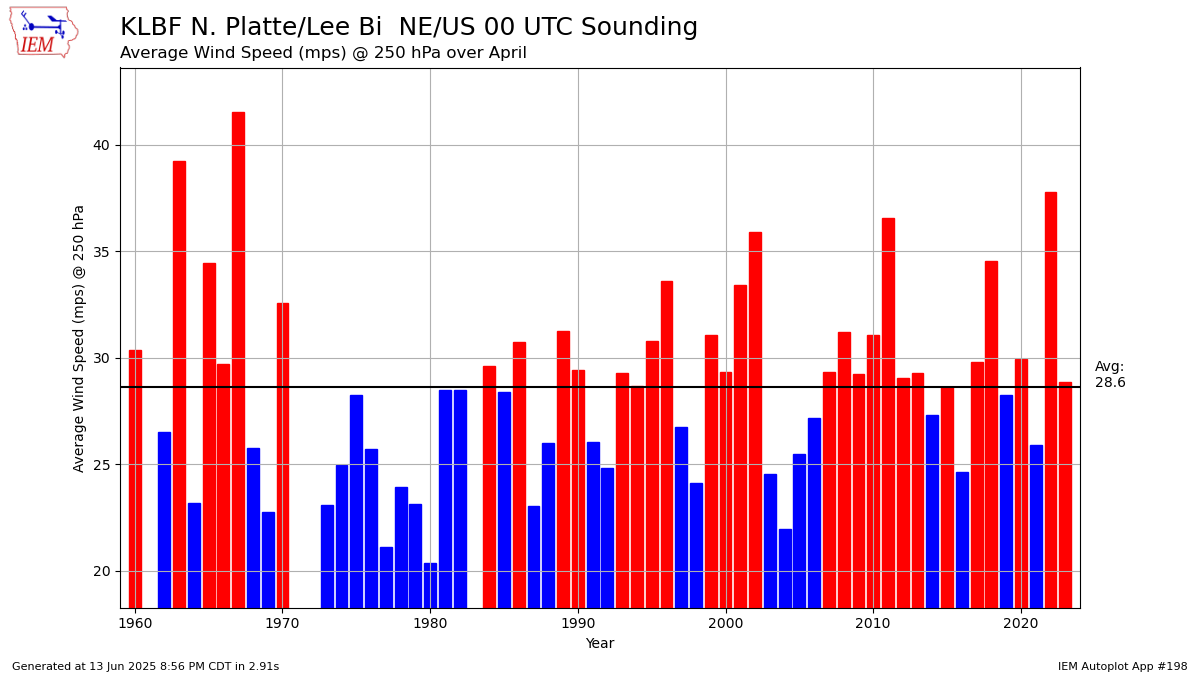
This plot takes into account weather balloon data from near the jet stream layer (250 mb, or ~30,000 ft. up). Red bars signify the monthly average wind speed at that pressure/height are above the long-term average of ~57 mph, while blue bars show a less windy month. (Roughly 2 mph = 1 m/s). April 2022 finished 3rd windiest dating to 1960 in the upper levels of the atmosphere. Two potential causes arise: either the jet stream tended to line up directly over Nebraska more often, the jet was stronger than usual, or both.
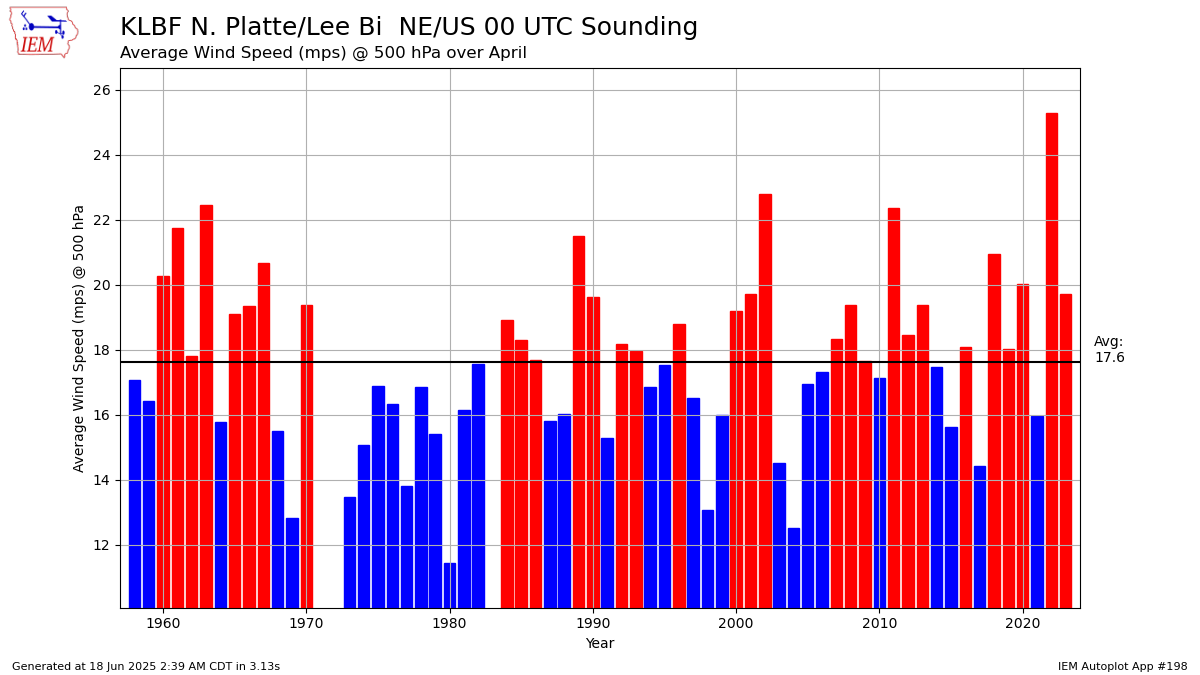
This plot features the 500 mb level (~18,000 ft. up) where strong low pressure systems can develop. The average monthly speed for April 2022 of around 50 mph was the highest in over 60 years, beating the long-term average by nearly 15 mph.
Breaking it down day by day...
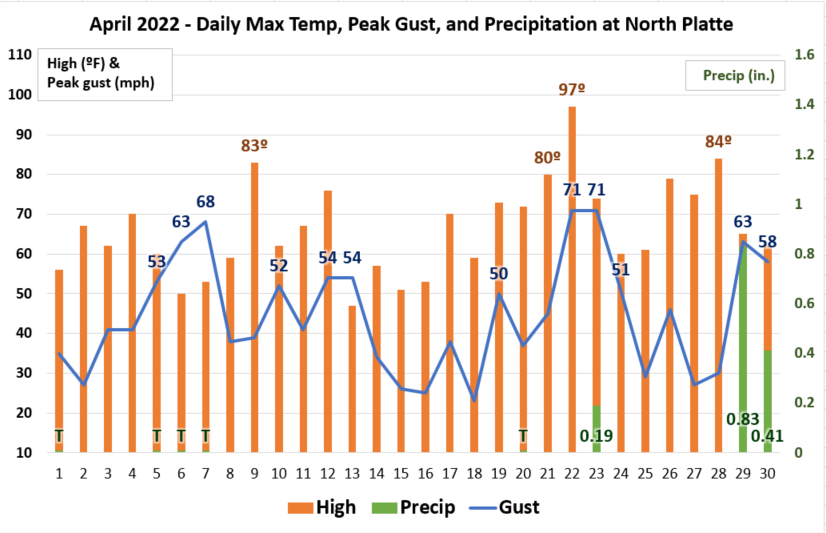
There was very little reprieve from the wind during the month, with only a handful of days where the gusts did not reach 30 mph. At North Platte, there were 12 days when gusts exceeded 50 mph, five days of 60+ mph gusts, and two days of 70+ mph. The plot below shows the daily high temperature (orange bars) overlayed with peak wind gusts (blue line) and precipitation (green bars). All of the measurable moisture at North Platte fell in the last week of the month, exacerbating the drought.
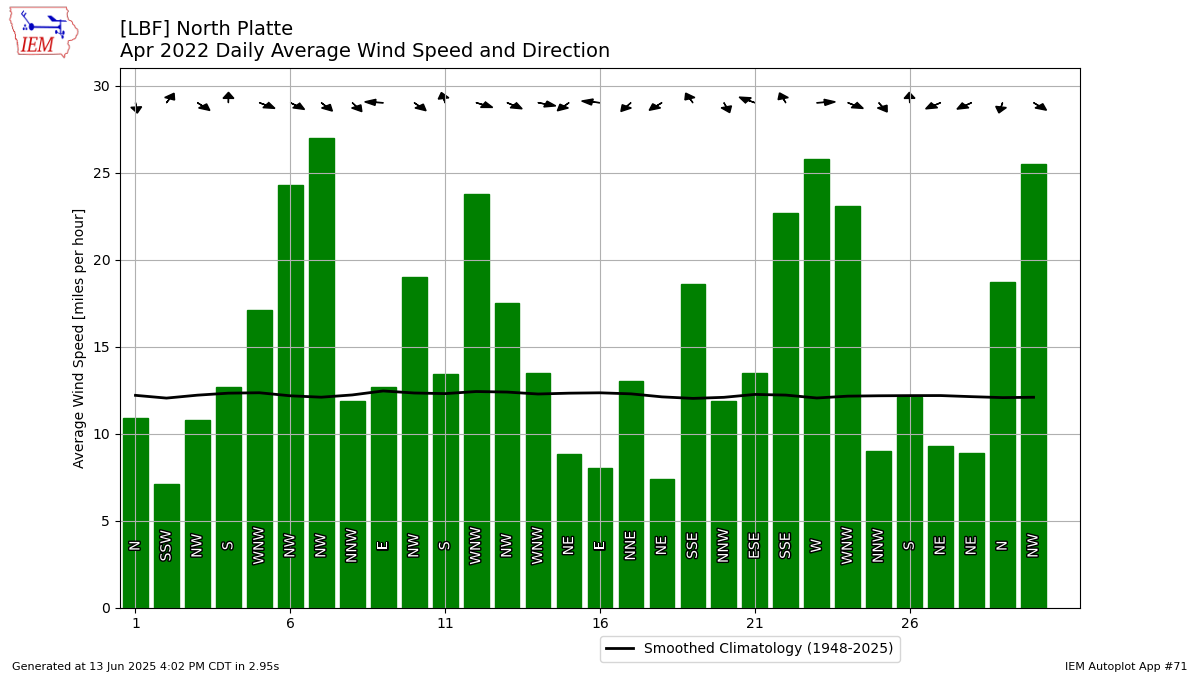
When looking at the general wind speed (not gusts), the daily average was notably high as well. The long-term average (dating to 1948) of daily wind speeds in April at North Platte is around 12-13 mph. In April 2022, the daily average exceeded 15 mph on 12 separate days and exceeded 25 mph on three days. The arrows correlate to the primary direction for that day. Notice how southerly winds usually precede a high wind event, while the event itself is northwesterly.
Let's look at the setup for two of the higher-end events...
April 6-7, 2022:
Headlines in effect for the NWS North Platte coverage area: High Wind Warning, Red Flag Warning, Blowing Dust Advisory
Peak wind gust at North Platte: 68 mph
Surface map overview: A low pressure crossed the northern Great Plains, dragging first a warm front through the Sandhills, then a dryline, and finally a strong cold front. The low pressure strengthened over the Dakotas and nearly stalled over Minnesota, placing Nebraska in an extended period of blustery northwest flow. The dryline pushed humidity values down, leading to critical fire weather conditions and making the environment more susceptible to blowing dust. Standard atmospheric pressure (relative to sea level) is 1013 mb, where any value over is generally considered high pressure and any value below is low pressure. The low with this system measured 985 mb at one point. The followup high pressure over the Pacific Northwest measured 1034 mb the morning of April 6. Notice the jam-packed isobars (lines of equal pressure)!
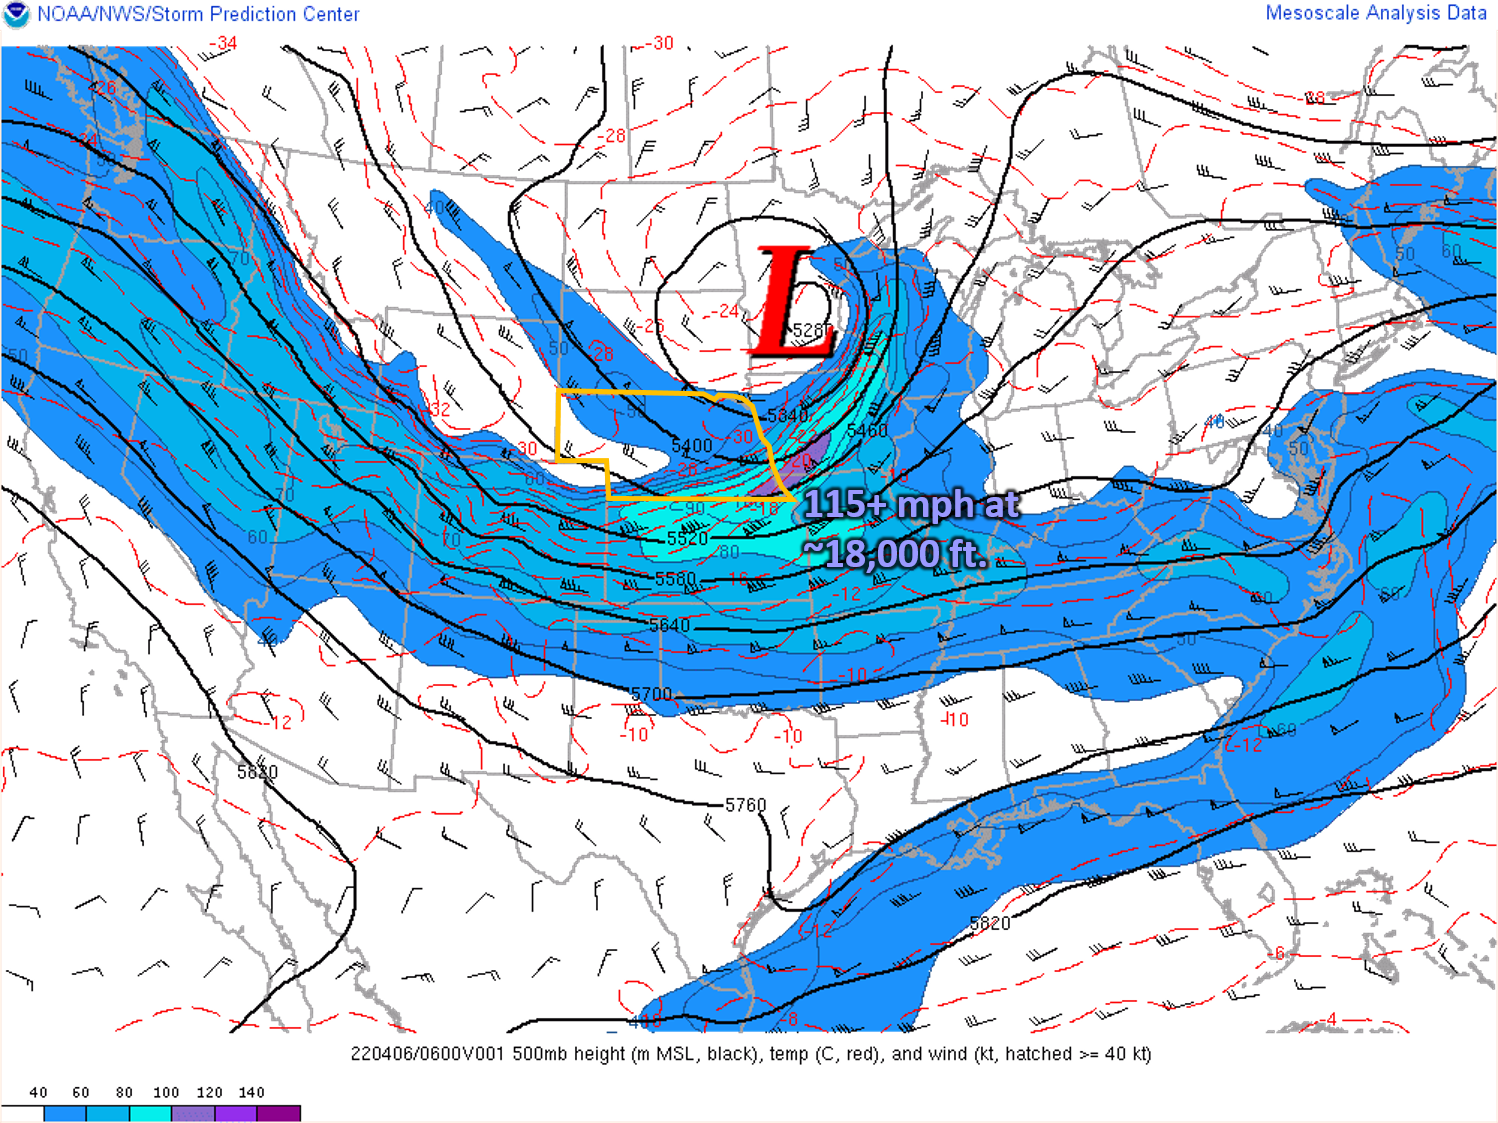
The 500mb chart (about 18,000 ft. up) shows a low pressure over Minnesota which corresponds to the surface low. The mid-level jet features a jet streak (maxima of winds) on the southern edge of the low pressure. Top speeds in the jet during the morning of the April 6 were at least 115 mph! While speeds of this nature don't make it to the surface, the jet can enable features in the lower atmosphere (fronts, other low pressures) to become stronger.
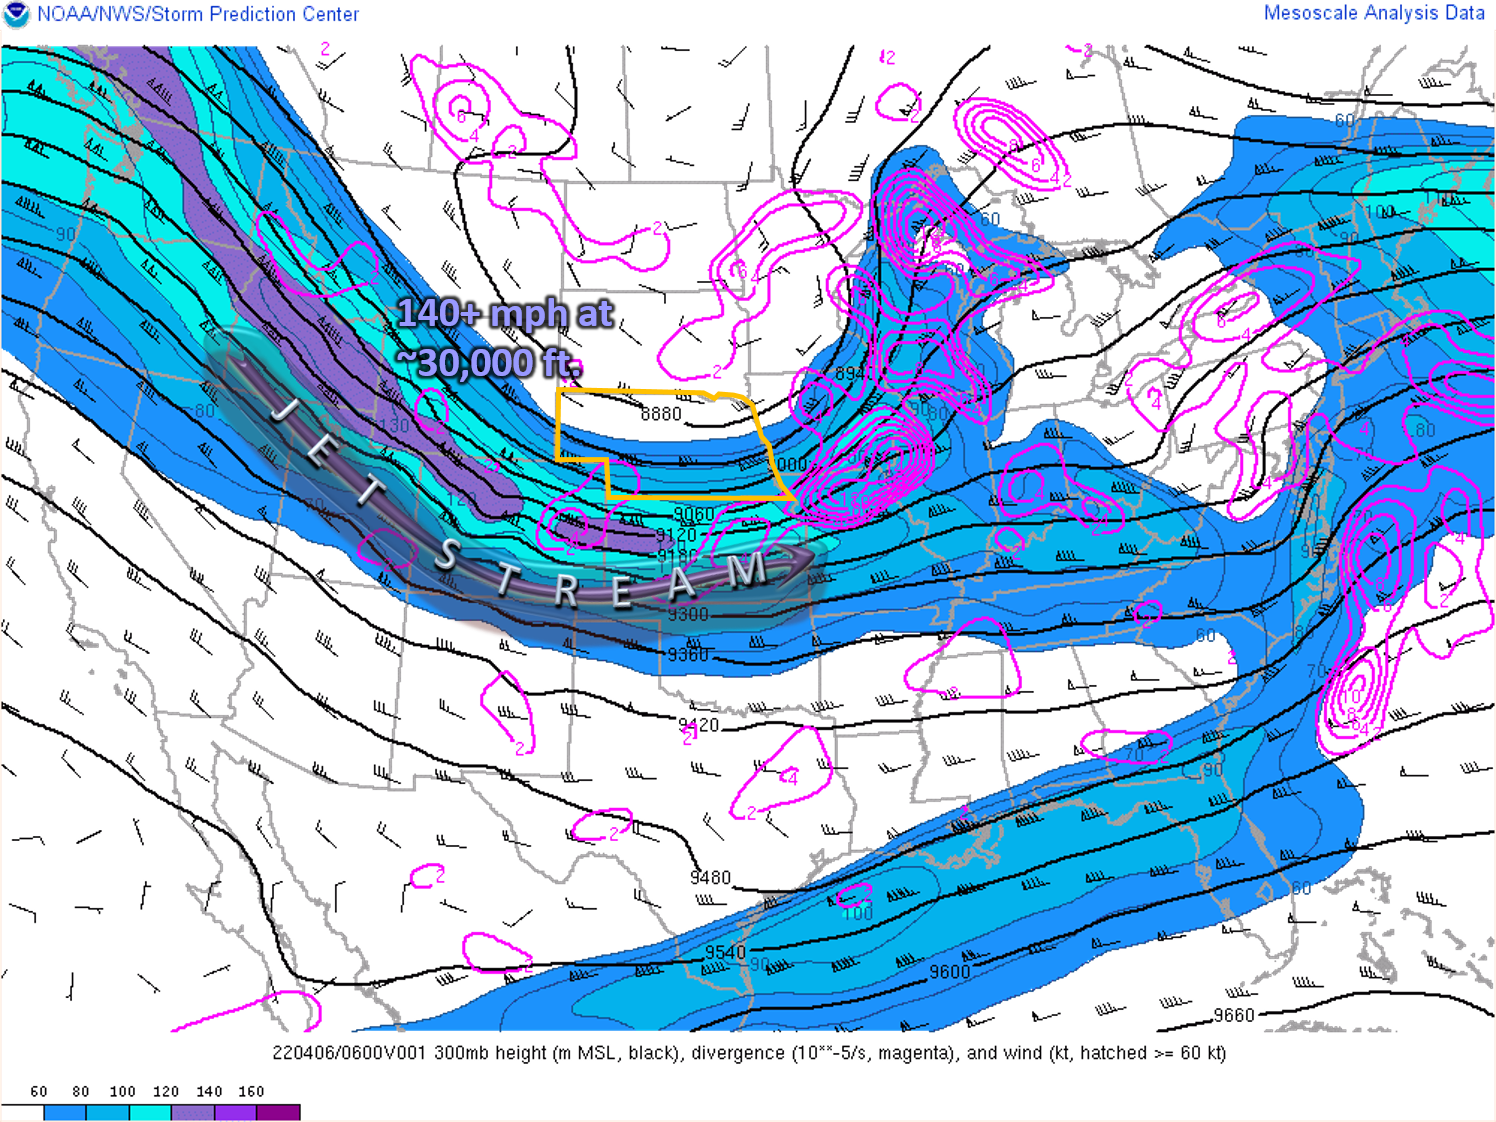
The 300mb chart (about 30,000 ft. up) shows the true jet stream, which during the morning of April 6, lies just south of the Sandhills. The jet streak (highlighted by the solid purple area) featured speeds over 140 mph! The jet also dipped farther south, allowing even cooler air to move into the region. Any available precipitation eventually switched from rain to snow. Light snow accumulations were noted in the northern Sandhills.
April 22-24, 2022:
Headlines in effect for the NWS North Platte coverage area: High Wind Warning, Red Flag Warning, Severe Thunderstorm Watch & Warning, Winter Weather Advisory
Peak wind gust at North Platte: 71 mph
Surface map overview: The progression of the system was similar to the first scenario, where a low pressure intensified along the lee of the Rockies, pushed a warm front, dryline, and cold front through western Nebraska, and nearly stalled in South Dakota. This low pressure bottomed out around 983 mb, even lower than the aforementioned storm! Southerly winds pulled some moisture into the state, but also helped push temperatures into daily record category. Highs reached the upper 90s on April 22 and struggled to reach the 40s on April 24. The dryline led to critically low humidity in the panhandle, drastically increasing the fire weather threat. Thunderstorms first developed when the air near the surface was still very dry, leading to dry lightning. Multiple fires were started across western and north central Nebraska. More widespread thunderstorm activity followed with the cold front. As the low pressure slowed over the Dakotas, northwesterly winds on the back side of the system funneled winter-like air into the region. Accumulating snow fell in the northern panhandle.
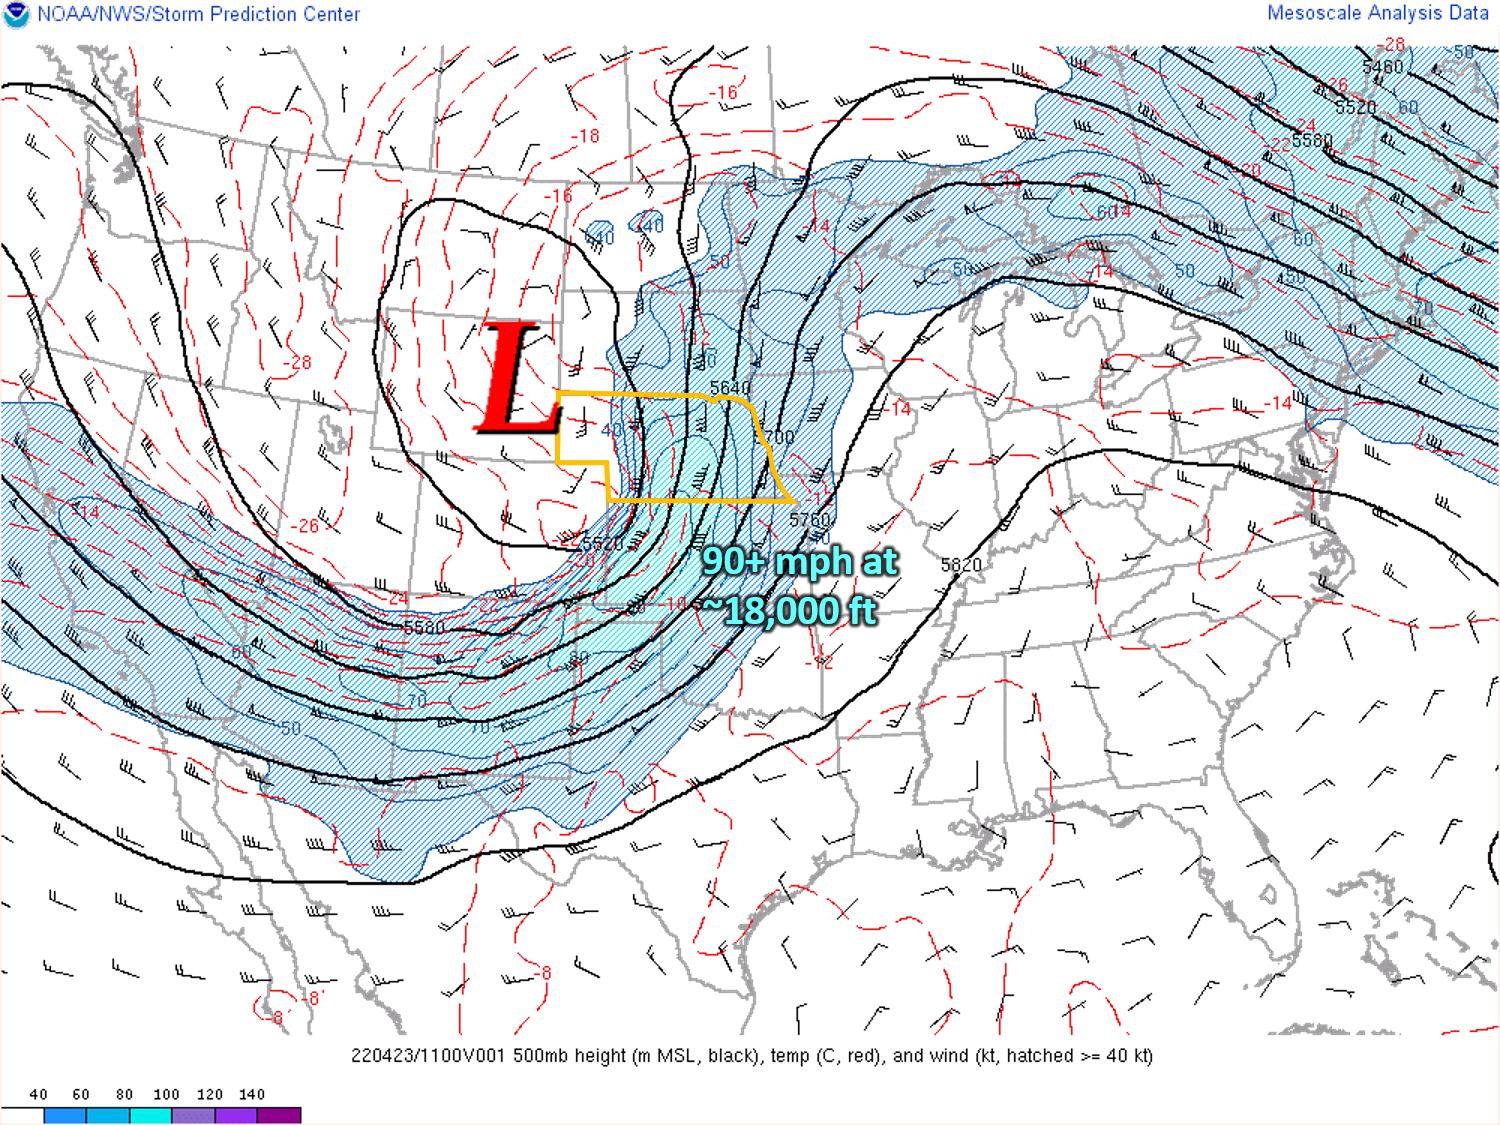
The 500mb chart (about 18,000 ft. up) this time shows the strengthening low pressure over Wyoming with the jet surging north across the Great Plains. The "nose" of the jet cut straight into the Sandhills during the morning of April 23 with speeds of at least 90 mph.
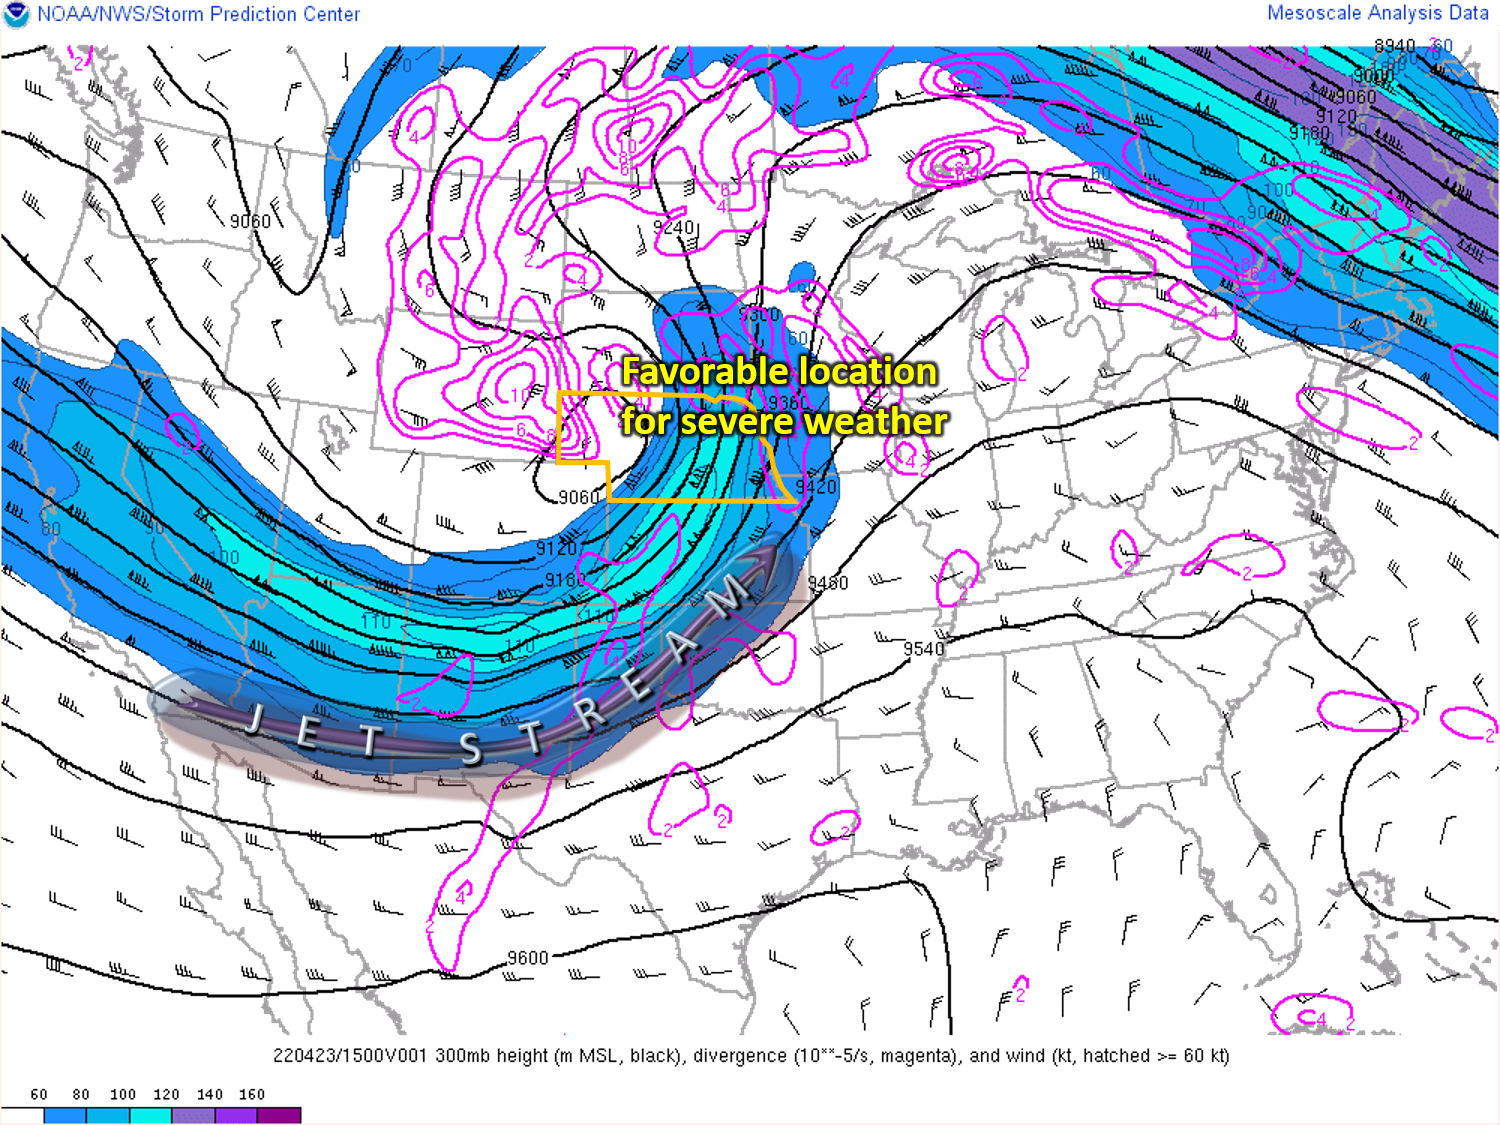
The 300mb chart (about 30,000 ft. up) shows the main jet stream also right on top of Nebraska during this event. The location of the jet streak (cyan-color of 115+ mph winds), along with the other features at 500mb and the surface, made western and central Nebraska conducive for severe weather. The scattered storms ahead of the dryline and the squall line ahead of the cold front each were responsible for locally stronger winds.
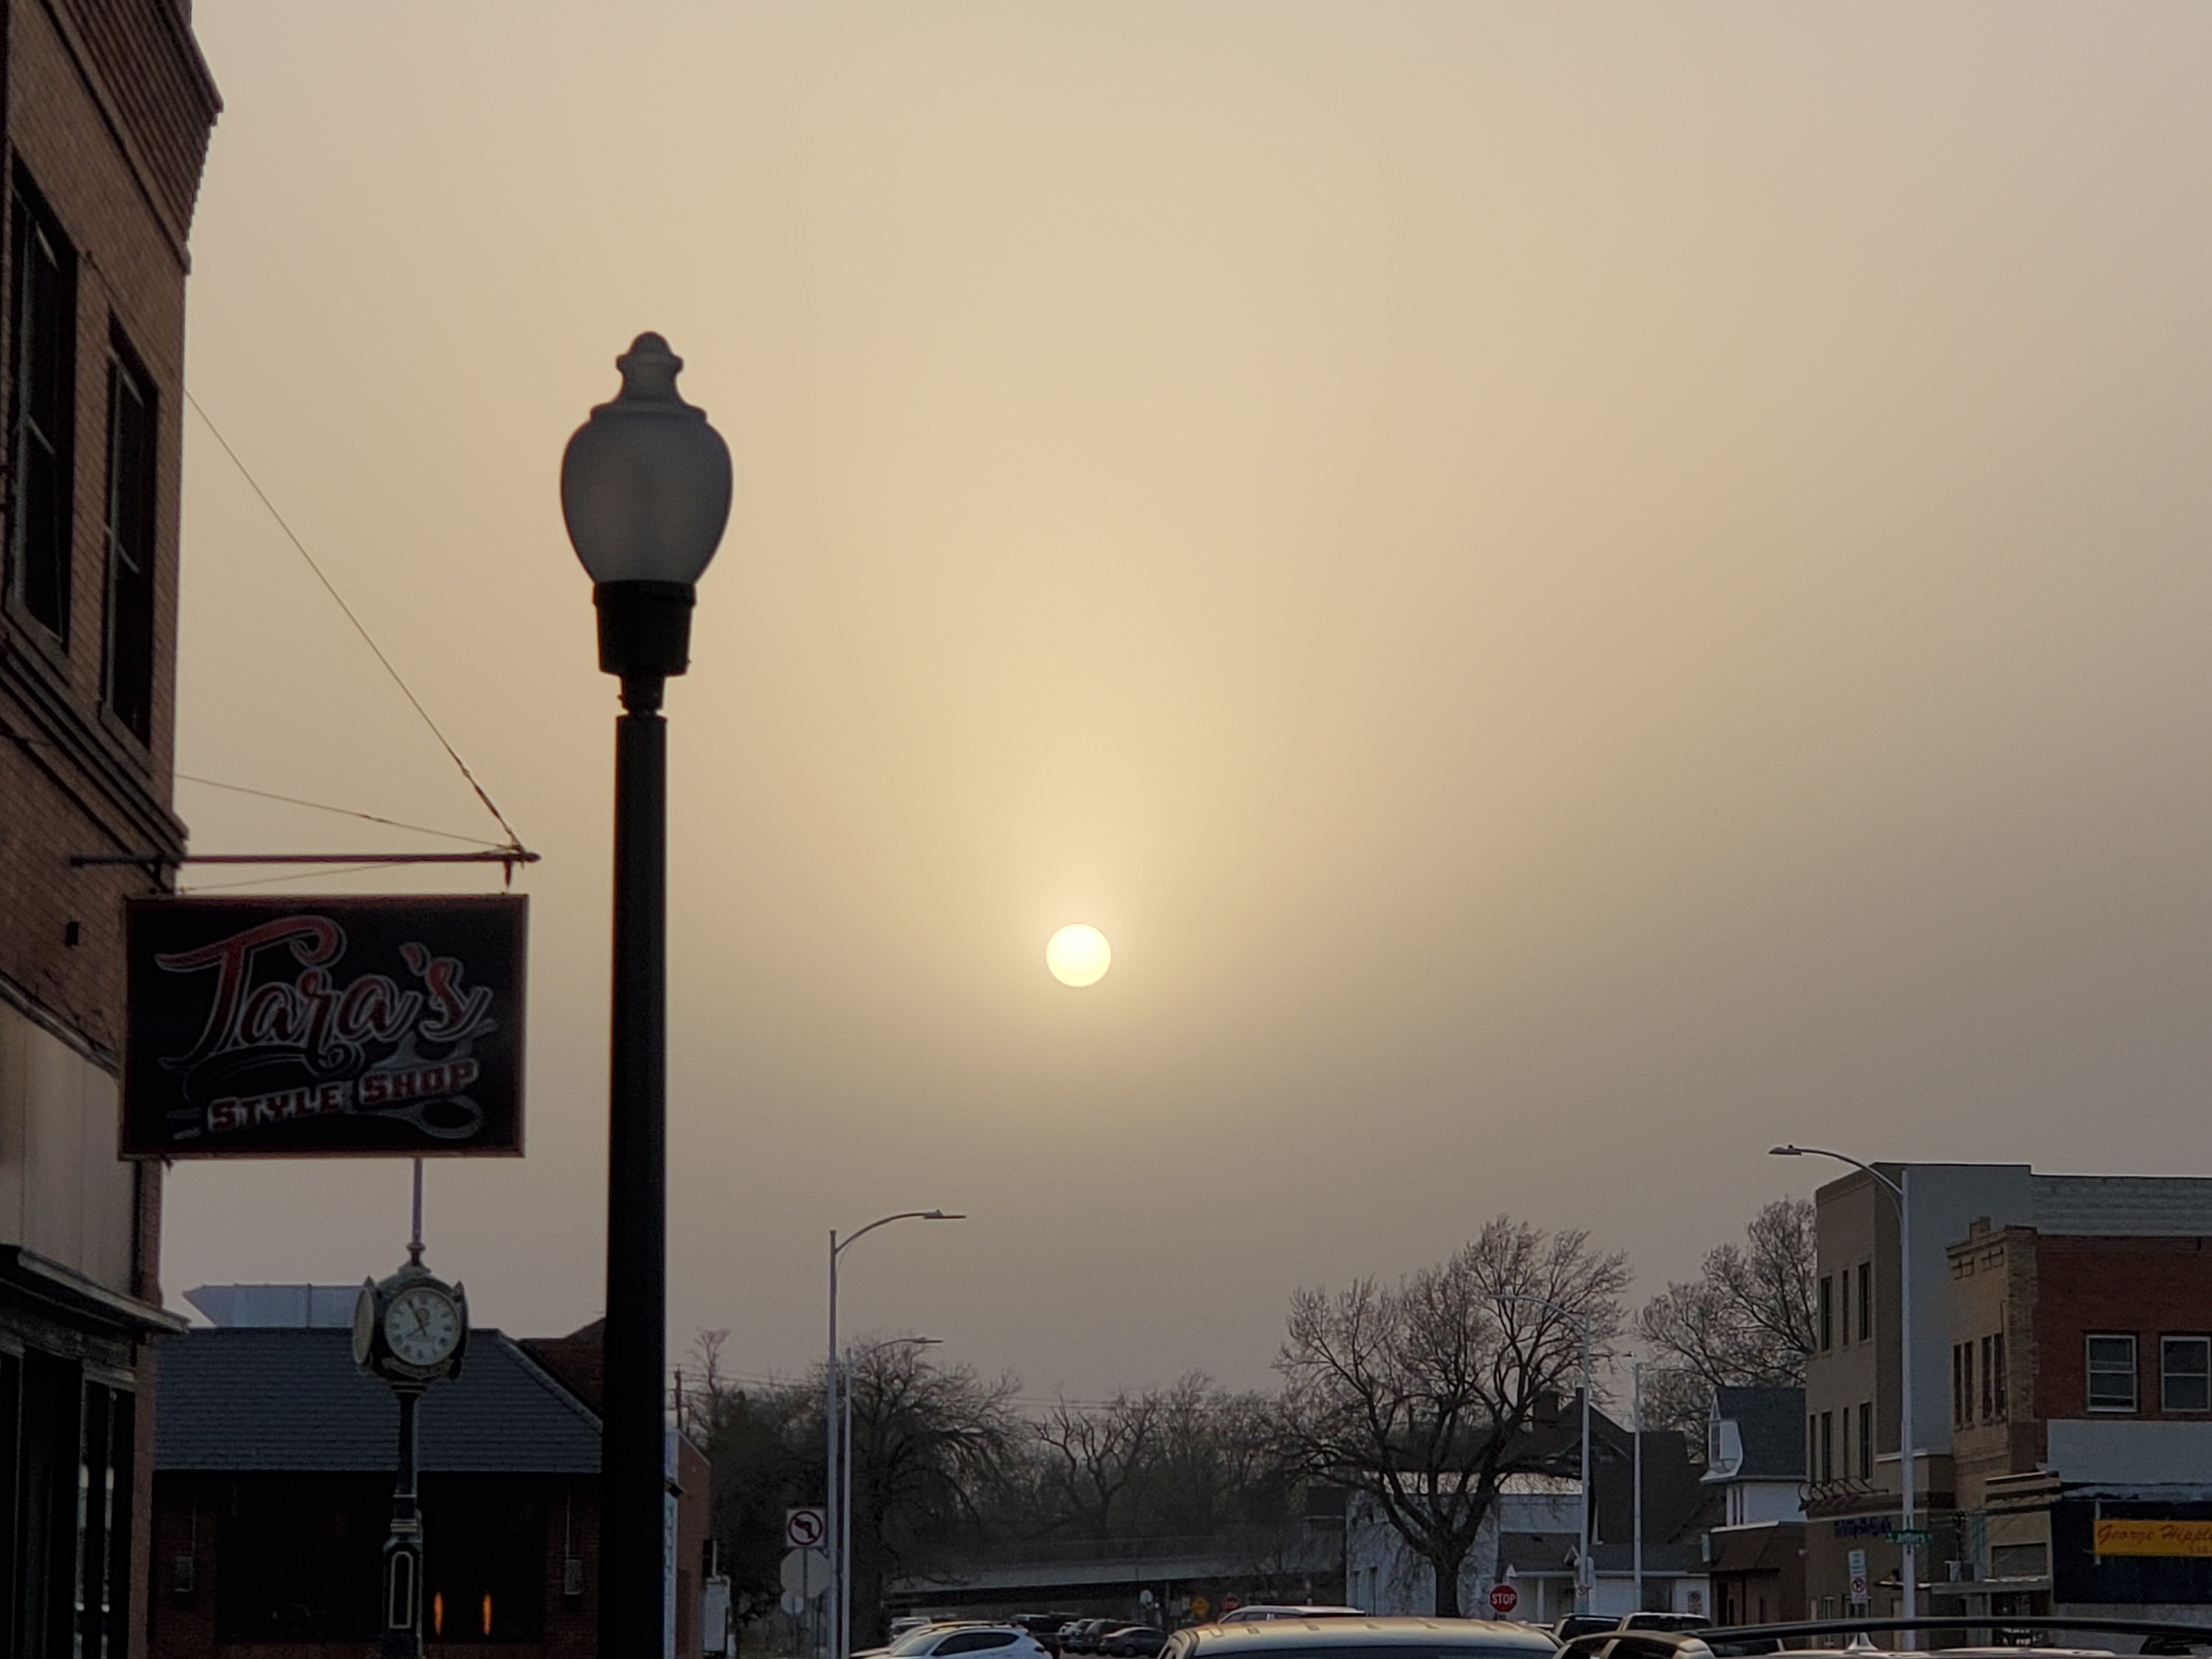
The combination of suspended dust and wildfire smoke filtered out the sun shortly before sunset, as viewed from North Platte on April 22.