Jackson, Mississippi
Weather Forecast Office
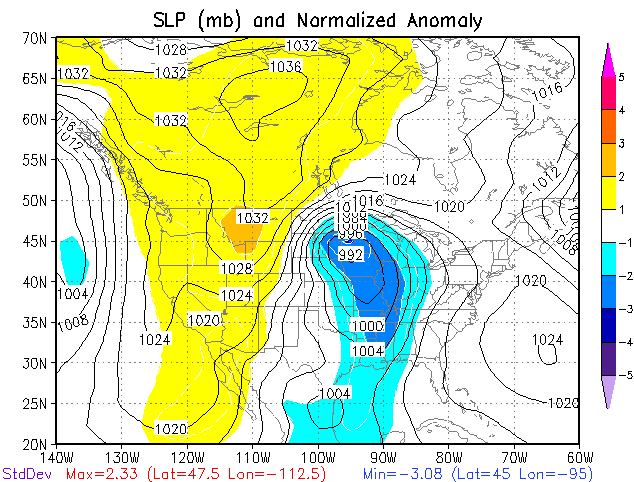
The below image is a rough overview of the surface pattern and the pressure anomalies represented by the standard deviation. Overall, the surface low is rather deep with a front / trough axis extending south. The deep low and trough are depicted well by the 2-3 standard deviation area below what you would expect to see for early March. Click on thumbnails for a larger image.
 |
The 2 images below are regional surface analysis maps.
The first surface map depicts conditions at 18z (noon) on March 3rd. A warm front has moved northward and is located across Central MS. This warm front separates the upper 60 dew points, to the south, from lower 60 dew points, to the north. Also in its wake are fairly stout southerly winds ranging from 10-20 mph. There also exists a substantial 3 hour pressure fall area across Central and Northern MS.
 |
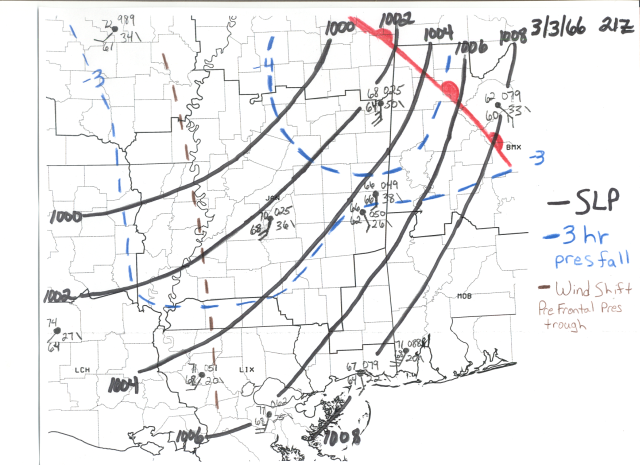
This next map is a 21z (3pm) surface analysis. This is roughly 1 to 1 1/2 hours before the tornado. You can see that the warm front has pushed further to the NE. Warm moist air remains south of the front with strong southerly winds remaining. There continues to be significant 3 hour pressure fall area across the region. Actually, there exists an even more pronounced pressure fall region of nearly 4 mb to 5 mb in 3 hours from Jackson to Columbus. These large pressure fall regions are key in promoting surface moisture convergence and allowing the low-level winds to remain slightly "backed". The final feature of note is the "subtle" wind shift / pressure trough located along the MS River. This feature is likely the "key" to where thunderstorms developed. This feature was also reflected in the 850mb map.
 |
US Dept of Commerce
National Oceanic and Atmospheric Administration
National Weather Service
Jackson, Mississippi
234 Weather Service Dr.
Flowood, MS 39232
601-936-2189
Comments? Questions? Please Contact Us.

