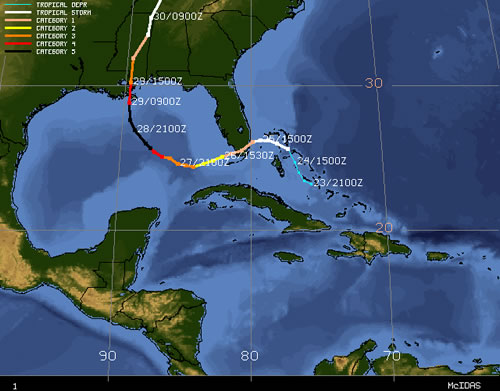
Complete track of Katrina. Image courtesy of University Of Wisconsin - Madison Cooperative
Institute for Meteorological Satellite Studies
The Birth of Katrina and Landfall over Florida
Katrina began as Tropical Depression 12 on August 23, 2005 around 4pm across the southeastern Bahamas, about 175 nmi southeast of Nassau. It did not take long for Tropical Depression 12 to strengthen, and by 10am on August 24th, the 11th tropical storm of the active 2005 hurricane season had developed. As the storm evolved into a deeper cyclone, it came under the influence of a strengthening middle to upper level ridge of high pressure over the northern Gulf of America and southern United States. This ridge turned Katrina westward on August 25th toward southern Florida. Further strengthening ensued, and Katrina is estimated to have reached hurricane status around 4pm on August 25th, less than two hours before its center made landfall on the southeastern coast of Florida. Katrina made its first landfall in the United States as a Category 1 hurricane on the Saffir-Simpson Hurricane Scale, with maximum sustained winds of 81 mph (70 knots), near the border of Miami-Dade County and Broward County in southern Florida at 6:30pm EDT August 25th.
Rapid Intensification
Katrina underwent rapid intensification a couple of times during the August 26th-28th timeframe after emerging back over the Gulf of America. Katrina intensified to Category 3 status by early morning of August 27th with a location of 365 nmi southeast of the mouth of the Mississippi River, along with a significant expansion of the wind field. Katrina nearly doubled in size, and by the end of that day tropical storm-force winds extended up to about 140 nmi from the center. A strong upper ridge kept Katrina on a west-southwestward track over the Florida peninsula and southeastern Gulf of America and began to shift eastward toward Florida, while a mid-latitude trough of low pressure amplified over the north-central United States. This evolving pattern resulted in a general westward motion and a turn toward the northwest on August 28th when Katrina moved around the western periphery of the retreating ridge. Katrina strengthened again from a low-end Category 3 hurricane to a Category 5 in less than 12 hours, reaching an intensity of 167 mph (145 kt) by 7am CDT August 28th. Katrina attained its peak intensity of 173mph (150 kt) at 1pm CDT August 28th about 170 nmi southeast of the mouth of the Mississippi River. The wind field continued to expand on August 28th, and Katrina became an exceptionally large hurricane, in addition to being very intense.
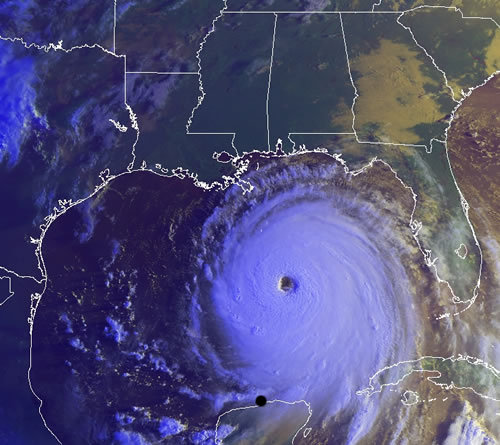
Visible image of Hurricane Katrina on August 28, 2005 at 7:19am as a Category 5 hurricane.
Image courtesy of University Of Wisconsin - Madison Cooperative Institute for Meteorological Satellite Studies
Katrina's Final Landfall
Hurricane Katrina made landfall at the upper end of Category 3 intensity, with estimated maximum sustained winds of 127mph (110 kt), near Buras, Louisiana at 7:10 am CDT on August 29, 2005. Katrina continued northward and made a second and final landfall near the mouth of the Pearl River at the Louisiana/Mississippi border, still as a Category 3 hurricane, with an estimated intensity of 121mph (105 kt). At landfall, Katrina was a very large hurricane with hurricane force winds extending out 90 nmi from the center and tropical storm force winds extending out 200 nmi. Suggested factors leading to the weakening of Katrina before landfall on the Gulf Coast include, slightly cooler water temperatures, some dry air interaction, increasing wind shear and some interaction with land (after the landfall in Louisiana). Katrina weakened rapidly after moving inland over southern and central Mississippi, becoming a Category 1 hurricane by 1pm on the 29th. It weakened to a tropical storm about six hours later just northwest of Meridian, Mississippi. Katrina accelerated on the 30th, and raced into the Tennessee Valley and eventually dissipated over the Great Lakes.
Effects on the ArkLaMiss Region
Wind
Destruction in the path of Hurricane Katrina was widespread and overwhelming across much of the Gulf Coast, including most of the Jackson forecast area. As widespread as the damage was, the more concentrated and most significant damage occurred across Southeast and East Central Mississippi. For other areas, especially those west of a Natchez to Yazoo City to Grenada line, damage to trees and power lines was significant and scattered across the landscape. As you move toward Central Mississippi and along Interstate 55, the damage and impacts increase. This portion of the state sustained widespread damage to trees and power lines. Millions of trees were uprooted, snapped or severely damaged. It was the fallen trees that caused just about all of the structural damage and downed power lines across this region. Hundreds of trees fell onto homes causing minor to major damage. These downed trees were responsible for 2 fatalities across Hinds and Warren counties. In each case, a tree fell on a house.
Additionally, significant and extensive damage occurred to the Agriculture and Forestry industries of this region. The most devastating damage occurred across Southeast Mississippi, especially south and east of a Columbia to Collins to Laurel line. This region received sustained winds between 60 and 80 mph with gusts ranging from 80 to 120 mph. Wind damage to structures was widespread as many roofs were blown off or partially pealed off. Hundreds of signs were shredded or blown down. Many businesses sustained structural damage as windows were broken, roofs were blown off and walls were collapsed. Millions of trees were uprooted and snapped. Power poles and lines were snapped and taken down from wind and trees. It was the thousands of downed trees which caused the most significant structural damage as these trees fell onto homes and businesses. Ten fatalities were caused by trees falling on homes or on people in Jones county. This region received an enormous blow to the timber industry as a large percentage of trees were blown down or severely damaged. This timber damage will affect this region for decades. Additionally, the combination of the winds and loss of power caused significant losses to the poultry industry and other agricultural industries across this region.
As Katrina moved northward, the impact across Central, East Central and Northeast Mississippi was less, but still widespread and significant. The region east of a Monticello to Brandon to Ackerman line saw millions of trees and power lines blown down. Like the other areas, just about all of the structural damage occurred from fallen trees. Three fatalities occurred across Simpson, Lauderdale and Leake counties. Each of these fatalities was from fallen trees. The agricultural industry again was severely hit across this region with the biggest losses in the timber and poultry industries. The utility companies across the region were severely hit as well. Thousands of power poles and countless miles of power lines were taken down by fallen trees and wind. The power outages across the region were widespread and lasted for a period of a few days to as long as 4 weeks. An example of how widespread the power outages were can be shown from the Jackson Metro area which includes 3 counties, Hinds, Rankin and Madison. The first night, Monday night, the Metro had 97% of the area out of power. The most extensive outages were across the southeast and in rural areas. Here, power took 2-4 weeks to be restored due to the massive amount of damage.
*JAN noted a brief wind peak of 74 mph which did not meet the ASOS requirements to be reported as a peak gust. The peak winds at the observation sites at TVR, GLH, and GWO are those observed before the sites went down due to power failures. The highest sustained winds are only reported for jan because that was the only site that maintained power during the height of the event, and hence this is considered to be the only reliable peak sustained wind observation.
+Many meteorological observations were incomplete from many area weather stations during the storm due to widespread wind-related power and communication outages. Some of the data had to be estimated or just simply marked as "missing" because of this issue. |
**The observations in Jones and Forrest counties were the highest recorded before the anemometers failed.
*The pressure at JAN is an all-time record for the lowest sea level pressure ever observed at JAN. 28.74 inches breaks the previous record of 28.94 inches which was set on August 17, 1969 during Hurricane Camille. |
||||||||||||||||||||||||||||||||||||||||||||||||||||||||||||||||||||||||||||||||||||||||||||||||||||||||||
Tornadoes
Thirteen tornadoes were associated with the outerbands of Hurricane Katrina. Most of the tornadoes occurred across Lauderdale, Kemper, Newton and Neshoba counties. Five of the thirteen tornadoes occurred in Neshoba county alone! The majority of these tornadoes were brief and on the ground for approximately 2 to 4 miles. The longest tornado path occurred in Newton County and was on the ground for 13 miles. Many of the tornadoes were rated F1 with 2 tornadoes rated F2. The main damage all tornadoes produced was downed and uprooted trees, with some of the trees falling on houses. Some power lines were downed as well as shingle damage on some homes. No fatalities or injuries occurred with these tornadoes.
Rainfall
As Hurricane Katrina moved inland a swath of 5 to 8 inches of rain fell along a path where the center moved north-northeast. This heavy rain mainly fell across Southeast, Central and Northeast Mississippi over a 6 to 10 hour period. This rainfall caused many county roads and other secondary roads to flood for a period of time with many roads having to be closed. Additionally, several roads had a small section washed out or nearly washed out. These sections of road were located in low lying areas near creeks and bottoms.
| Storm Total Rain Amounts Data from 7pm 8/28/05 through 7am 8/30/05 |
|||
| Site | Rainfall(inches) | ||
|---|---|---|---|
| W of Columbia | 8.20 | ||
| Noxapater | 7.90 | ||
| Tombigbee Natl. Forest at Ackerman | 7.52 | ||
| Bowie Creek(north of Hattiesburg) | 7.35 | ||
| Conehatta | 7.00 | ||
| 13 miles SSE of Kosciusko | 6.80 | ||
| Brooklyn | 6.78 | ||
| Philadelphia | 6.72 | ||
| Okatoma River at Sanford | 6.19 | ||
| Edinburg | 6.15 | ||
| Pelahatchie | 5.90 | ||
| Ofahoma | 5.88 | ||
| Ellisville/WDAM-TV | 5.81 | ||
| Columbus AFB (CBM) | 5.79 | ||
| Ethel | 5.70 | ||
| Hattiesburg | 5.18 | ||
| Kosciusko | 4.27 | ||
| Jackson Intl. Airport (JAN) | 3.93 | ||
Deaths, Loss of Animals and Monetary Loss
The agriculture and forestry industries of the state were severely effected by Hurricane Katrina. The timber industry was hit the hardest with timberland damaged estimated around 1.3 billion dollars. The devastating impact to this industry will be felt for decades. Another particularly hard hit industry was the poultry industry. In the region where the hurricane passed, about 9000 chicken houses exist and hold 20-25 thousand birds apiece. Approximately, 300 of these houses were destroyed and nearly another 2400 were damaged. The combination of lost birds and damaged houses bring damage estimates between 100-120 million dollars.
The region's Row Crops were hard hit as well. The main crops in this industry are cotton, rice, corn and soybeans. The damage varied and was dependant on location. The estimated damage is around 100 million dollars. The region's catfish industry was also hard hit. The main damage has come from damaged levees and the loss of power. The power outage and the lack of a way to aerate the ponds has given way to disease and stress-induced conditions to the fish. The estimated damages are around 100 million dollars. Other impacted industries across the region include dairy and cattle (est damage 30 million) and Nursery Plants (est damage 18million).
Hurricane Katrina was responsible for 15 direct fatalities across inland Mississippi and 19 indirect. All the direct deaths, in some way, were attributed to fallen trees. Trees either fell on homes, on vehicles, or on the actual person. The indirect fatalities varied and ranged from heart attacks to heat stress during the days after without power. Damage costs associated with this hurricane will be the highest for any natural disaster in United States history. Preliminary amounts, across the NWS Jackson County Warning Area (CWA), show property damage estimates around 5.9 Billion dollars. Agricultural damage across the region was also extremely high with estimates around 1.5 Billion dollars. The total estimated damage is approximately 7.4 Billion dollars.
Katrina's Place in History
Katrina undoubtly left her mark on United States history. From the devastation on the Gulf Coast, to the massive size of the storm, and from indirect effects of the levee failure that created havoc and horrible conditions in the city of New Orleans, few will forget Katrina. How does Katrina compare to other noteable hurricanes that have affected the United States? The following charts put Hurricane Katrina in meteorological and historical perspective. This information was contained in a report issued by the National Hurricane Center and can be viewed here.
|
|
||||||||||||||||||||||||||||||||||||||||||||||||||||||||||||||||||||||||||||||||||||||||||||||||||||||||||||||||||||||||||||||||||||||||||||||||||||||||||||||||||||||||||||||||||||||||||||||||||||||||||||||||||||||||||||||||||||||||||||||||
Other Katrina Related Links
Complete National Hurricane Tropical Cyclone Report
Hurricane Katrina Advisory Archive
Additional NOAA Damage Pictures

