
A wet Memorial Day weekend is in store for the East, with widespread rainfall of 1 to more than 2 inches expected from the Gulf Coast to southern New England. Well above normal temperatures are forecast to build across the northern Plains. Another round of heavy to excessive rainfall is expected to impact the western Gulf Coast this weekend with Flood Watches in effect. Read More >
As the winter season wraps up, crunching the numbers reveals interesting statistics about this winter season. Looking back at last winter (2010-2011), top ten seasonal snowfall totals were recorded at both Fort Wayne and South Bend. After a relatively slow start to the winter season, snowfall totals remained well below the 2010-2011 seasonal totals, but how do they compare to normal and other seasons? Also, how do temperatures this winter compare to past seasons?
The snowfall season runs from July 1-June 31, with a majority of snowfall occuring from Oct 1-April 30, and much of this snowfall occuring during or just outside of the climatological winter season (December 1 - February 29).
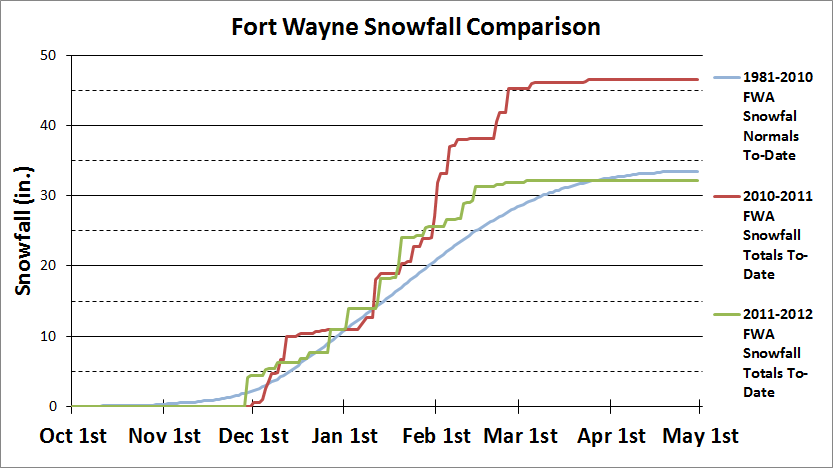
The 1981-2010 normal seasonal snowfall for Fort Wayne is 33.5 inches.Last season, Fort Wayne received 46.5 inches of snowfall, which is 13.0 above normal. This ranked as the 9th greatest seasonal snowfall on record. This winter, Fort Wayne received 32.2 inches of snow, which is 1.3 inches below normal. During the climatological winter season (Dec 1-Feb 29), Fort Wayne received 27.5 inches of snowfall, compared to 45.3 inches of snowfall last climatological winter season. The normal climatological winter season snowfall (1981-2010) is 28.4 inches. Looking at the graph above, the 2011-2012 season-to-date snowfall at Fort Wayne was near, or even at times above, the 2010-2011 season-to-date snowfall in December and January. However, with only 6.3 inches of snowfall in February, the seasonal total fell well behind last season's pace, as 18.3 inches of snow fell last February at Fort Wayne.
This season, there were 30 days with measurable snowfall (at least 0.1") at Fort Wayne. Looking at last season, there were 39 days with measurable snowfall. During the previous 30 snowfall seasons (1981-1982 to 2010-2011), the average number of days with measurable snowfall in a season is 32.3, with 18 days of measurable snowfall in 1994-1995 being the fewest, and 47 days of measurable snowfall in 1981-1982 being the greatest.
|
|
||||||||||||||||||||||||||||||||||||||||||||
While snowfall was near normal and the number of days with measurable snowfall was slightly below normal this season at Fort Wayne, one thing that stands out was the lack of days with more than a trace of snow on the ground (snow depth of at least 0.5", rounded up to 1"). Every morning at 7 AM LST, snow depth is measured and recorded at Fort Wayne, and is then recorded in the climate record as the snow depth for the day. This season, there were only 20 days with more than a trace of snow on the ground. During the previous 30 snowfall seasons (1981-1982 to 2010-2011), the average number of days with more than a trace of snow on the ground in a season is 40.5, with only 8 days with more than a trace of snow on the ground in 1997-1998 being the fewest, and 93 days with more than a trace of snow on the ground in 1981-1982 being the greatest.
While snowfall was near normal and the number of days with measurable snowfall was slightly below normal this season at Fort Wayne, one thing that stands out was the lack of days with more than a trace of snow on the ground (snow depth of at least 0.5", rounded up to 1"). Every morning at 7 AM LST, snow depth is measured and recorded at Fort Wayne, and is then recorded in the climate record as the snow depth for the day. This season, there were only 20 days with more than a trace of snow on the ground. During the previous 30 snowfall seasons (1981-1982 to 2010-2011), the average number of days with more than a trace of snow on the ground in a season is 40.5, with only 8 days with >more than a trace of snow on the ground in 1997-1998 being the fewest, and 93 days with more than a trace of snow on the ground in 1981-1982 being the greatest.
|
|
||||||||||||||||||||||||||||||||||||||||||||
During this season, the greatest daily snow depth at Fort Wayne was 5 inches on January 21. The last season without a daily snow depth of at least 6 inches was 1997-1998, when the greatest daily snow depth was 4 inches on November 16, 1997. During the 1981-2010 period, there were only four seasons without a daily snow depth of at least 6 inches; 1988-1989, 1989-1990, 1994-1995 and 1997-1998.
Fort Wayne actually received more precipitation this season compared to last season. During the climatological winter season of 2010-2011, Fort Wayne received 6.09 inches of precipitation. This climatological winter season, Fort Wayne received 8.87 inches of precipitation. The climatological winter season precipitation normal (1981-2010) value at Fort Wayne is 7.07 inches.
With precipitation and snowfall values near or above normal this past winter, it would appear that this season was a typical winter season when looking at just these variables. However, temperatures were very mild at Fort Wayne during the climatological winter, which can be directly attributed to the snow depth figures shown above.
The winter of 2011-2012 was characterized by much above normal temperatures across most of the Eastern United States. At Fort Wayne, the average temperature for the climatological winter was 32.7 degrees which is the 6th warmest climatological winter on record (warmest is 36.6 degrees in 1932). The 1981-2010 normal average temperature for the climatological winter (Dec - Feb) is 27.4 degrees.
| 10 Warmest Winters at Fort Wayne | ||
| Rank | Average Temp | Winter |
| 1 | 36.8 | 1931-1932 |
| 2 | 34.6 | 2001-2002 |
| 3 | 34.1 | 1982-1983 |
| 4 | 33.8 | 1997-1998 |
| 5 | 33.2 | 1918-1919 |
| 6 | 32.7 | 2011-2012 |
| 7 | 32.1 | 1953-1954 |
| 8 | 32.0 | 1920-1921 |
| 9 | 31.9 | 1930-1931 |
| 10 | 31.8 | 1991-1992 |
During the climatological winter, there were only 16 days with a high temperatures at or below 32 degrees F. This ranks as the third fewest number of days at or below freezing during a climatological winter season. The fewest number of at or below freezing days in a climatological winter season is 12, which occured in 1931-1932. Looking at the winter period of October 1-April 30, the 2011-2012 season ranks as the fewest number of at or below freezing days.
|
|
||||||||||||||||||||||||||||
There have only been 10 winters in the climate history (1897-present) at Fort Wayne without a low temperature at or below zero degrees F. This is only the 11th winter season without a temperature at or below zero degrees F. The last winter season without a temperature at or below zero degrees F was 2001-2002.
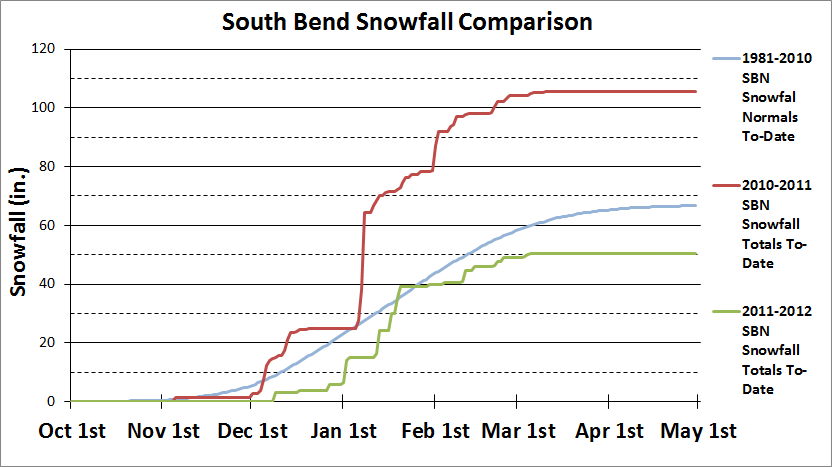
The 1981-2010 normal seasonal snowfall for South Bend is 66.6 inches. Last season, South Bend received 105.6 inches of snowfall, which is an incredible 39.0 inches above normal. This ranked as the 5th greatest season snowfall total on record. South Bend only received 51.2 inches this season, 15.4 inches below normal. During the climatological winter season (Dec 1-Feb 29), South Bend received 49.7 inches of snowfall, compared to 102.9 inches of snowfall last climatological winter season. The normal climatological winter season snowfall (1981-2010) is 52.9 inches. Looking at the graph above, the 2011-2012 season-to-date snowfall at South Bend was well below last year's snowfall totals. The snowfall was well below normal for much of the season as well, except for a brief period of at or above normal snowfall in mid to late January.
This season, there were only 23 days with measurable snowfall (at least 0.1") at South Bend. Last season, there were 52 days with measurable snowfall. During the previous 30 snowfall seasons (1981-1982 to 2010-2011), the average number of days with measurable snowfall in a season is 44.3, with 25 days with measurable snowfall in 1997-1998 being the fewest, and 66 days with measurable snowfall in 1981-1982 being the greatest. This season, 23 days of measurable snowfall is the fewest number of days with measurable snowfall since 1948-1949, when there was only 20 days with measurable snowfall.
|
|
||||||||||||||||||||||||||||||||||||||||||||
Like snowfall and number of days with measurable snowfall, the number of days with more than a trace of snow on the ground was below average. This season there were only 21 days with more than a trace of snow on the ground. During the previous 30 snowfall seasons (1981-1982 to 2010-2011), the average number of days with more than a trace of snow on the ground in a season is 55.2, with only 28 days with more than a trace of snow on the ground in 1982-1983 being the fewest, and 99 days with more than a trace of snow on the ground in 1981-1982 being the greatest. This season, 21 days with more than a trace of snow on the ground is the fewest number of days since reliable snowfall records began in 1948. The second lowest occured in the winter of 1948-1949 when there were only 24 days with more than a trace of snow on the ground.
|
|
||||||||||||||||||||||||||||||||||||||||||||
This season, the greatest daily snow depth at South Bend was 8 inches on January 3. The last season that the greatest daily snow depth was only 8 inches or less was 2005-2006. Last season, the greatest daily snow depth was 23 inches, which occured on January 8, 2011. The last time the daily snow depth was at least 23 inches at South Bend before last season was February 1985.
South Bend has received similar precipitation this season compared to last season. During the climatological winter season of 2010-2011, South Bend received 7.51 inches of precipitation. During this climatological winter season, South Bend received 7.89 inches of precipitation. The climatological winter season precipitation normal (1981-2010) value at South Bend is 6.85 inches.
| Top 10 Warmest Winters at South Bend | ||
| Rank | Average Temp | Winter |
| 1 | 33.8 | 1982-1983 |
| 2 | 33.6 | 2001-2002 |
| 3 | 32.9 | 1997-1998 |
| 4 | 32.0 | 2011-2012 |
| 5 | 31.6 | 1920-1921 |
| T-6 | 31.5 | 1991-1992, 1918-1919 |
| 8 | 30.8 | 1930-1931 |
| T-9 | 30.7 | 1952-1953, 1953-1954 |
During the climatological winter, there were only 19 days with a high temperature at or below 32 degrees F. This ranks as a tie for the second fewest number of days at or below freezing during a climatological winter season. The fewest number of at or below freezing days in a climatological winter season is 6, which occured in 1931-1932. Looking at the winter period of October 1-April 30, the 2011-2012 season ranks as the second fewest number of at or below freezing days.
|
|
||||||||||||||||||||||||||||
There have only been 7 winters in the climate history (1893-present) at South Bend without a low temperature at or below zero degrees F. The winter of 2011-2012 was only the 8th winter without a temperature at or below zero degrees F. The last winter season without a temperature at or below zero degrees F was 2001-2002.
This winter and last winter (2010-2011) have been characterized by separate La Nina events. La Nina refers to the periodic cooling of ocean surface temperatures in the central and east-central equatorial Pacific. Typically, La Nina events occur every 3 to 5 years or so, but on occasion can occur over successive years as was the case with the last two years. After a period of neutral conditions, another La Nina event developed during the fall of 2011and matured through the winter of 2011-2012 as below-average sea surface temperatures persisted across the equatorial Pacific Ocean.
Historically, for this part of the Midwest, winters tend to be wetter than normal when a La Nina event is occurring. After looking at research based on a regional scale, a local research study was completed to look at how past La Nina events affected the local area. In 14 documented La Nina events, on average, the winter was warmer than normal at both Fort Wayne and South Bend. Precipitation was above normal with below normal snowfall at both locations during the winter months. This was not seen to be true for last winter (2010-2011) which featured below normal temperatures, below normal precipitation, but above normal snowfall for both Fort Wayne and South Bend. In comparison, this winter through February 26, currently features above normal temperatures and above normal precipitation at both Fort Wayne and South Bend. Snowfall is above normal at Fort Wayne and below normal at South Bend. So what’s causing the difference in conditions between the last two winters?
Scientific research over the last several years has found correlations between conditions in the Arctic and North Atlantic Ocean areas and weather across the CONUS. These conditions have been termed the Arctic Oscillation (AO) and the North Atlantic Oscillation (NAO). The AO is a reference to changing atmospheric pressure patterns in the high latitudes of the Arctic region. During the negative phase, cold air generally plunges southward into the central and eastern United States. In the positive phase, very cold air is essential "bottled up" in the polar regions. The NAO is similar to the AO, but is a measure of the difference in atmospheric sea level pressure between the Icelandic low (also known as the polar low) and the Azores high (also known as the subtropical high). The positive phase is generally associated with above average temperatures in the eastern CONUS while the negative phase is associated with below average temperatures.
While the AO and NAO have been shown to have significant impacts on the weather across the CONUS, they can only be forecast with reasonable skill out to about two weeks. Therefore, while La Nina is a persistent, relatively long term pattern, the AO and NAO fluctuations are on a much smaller time scale and their effects can enhance or suppress conditions typically associated with a La Nina. When the AO and NAO are in their negative phases, they can provide cold air across the CONUS. If these phases coincide with a strong storm system generated in a La Nina pattern, a significant snow storm could be the result. However, if the AO and NAO are in a positive phase when a storm system develops, there could be less cold air and potentially more liquid precipitation. This has been the cause with the current winter with the cold air bottled up in northern Canada. Last winter the AO and NAO were in a negative phase which allowed the cold air to infiltrate the region and cause more snowfall instead of liquid precipitation. These complicated interactions are just a small part of what makes forecasting winter weather in the central and eastern United States so difficult. For more detailed information and graphics please see our La Nina webstory.
Greenawalt/Bentley/Obergfell
Page updated: 11/29/12

