January 7-9, 2011 Lake Effect Snow Event
A series of shortwave disturbances moved across the region on Thursday, January 6, 2011, bringing light snow to the IWX warning area. Synoptic snowfall ended overnight on Thursday and accumulations were generally light with 1 to 3 inches falling across the area. Another strong upper-level disturbance shifted through the Great Lakes region in the afternoon of Friday the 7th. Cold air flowing over the relatively warm waters of Lake Michigan generated several rounds of heavy lake effect snow bands beginning on Friday the 7th and ending by the morning of Sunday the 9th. The bands generated snowfall rates of up to 4" an hour with visibilities dropping to near zero under the heaviest bands. Areas in Berrien County, Michigan and La Porte and St. Joseph counties in Indiana were especially hard hit with many locations receiving 2 to 3 feet of snow by the time the event ended.
2 Day Snowfall Totals as of Sunday, January 9, 2011
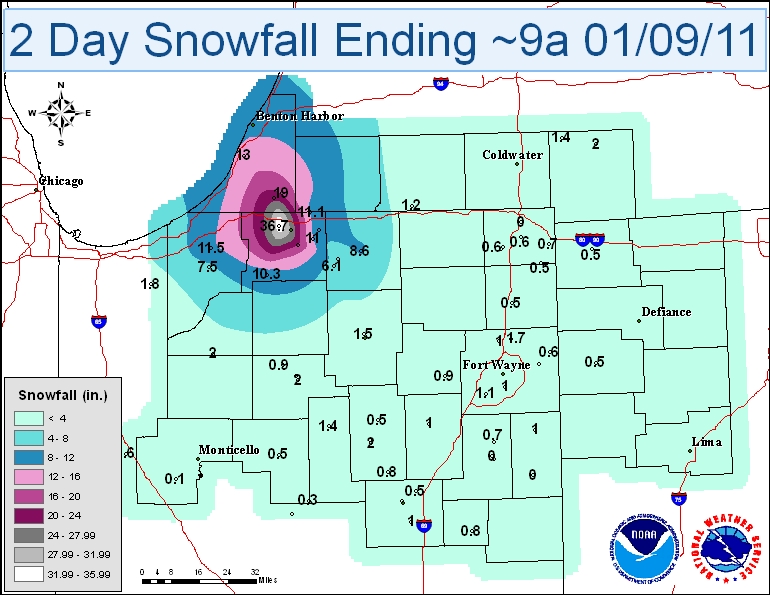
Below is a table highlighting some of the two day total snowfalls.
| LOCATION |
SNOW AMT |
| South Bend Airport |
36.7 |
| Mishawaka |
28.5 |
| South Bend 4 SE |
28.1 |
| Buchanan 1.4 ESE |
22.0 |
| Niles 2.7 W |
19.0 |
| Millburg |
17.0 |
| Stevensville 1.7 SSE |
13.0 |
| La Porte 1.2 E |
11.5 |
| Granger 1.6 N |
11.1 |
| Walkerton 5.7 ENE |
10.3 |
| Goshen 1.9 NW |
8.6 |
| Kingsbury WNW |
7.5 |
| Kingsbury 1 N |
7.5 |
| NWS Office - North Webster 2 N |
2.5 |
| Warsaw 1.1 NNW |
1.5 |
| Fort Wayne Airport |
1.1 |
| Gas City 1 SW |
1.0 |
24 Hour Totals Jan. 7: System Snow amounts
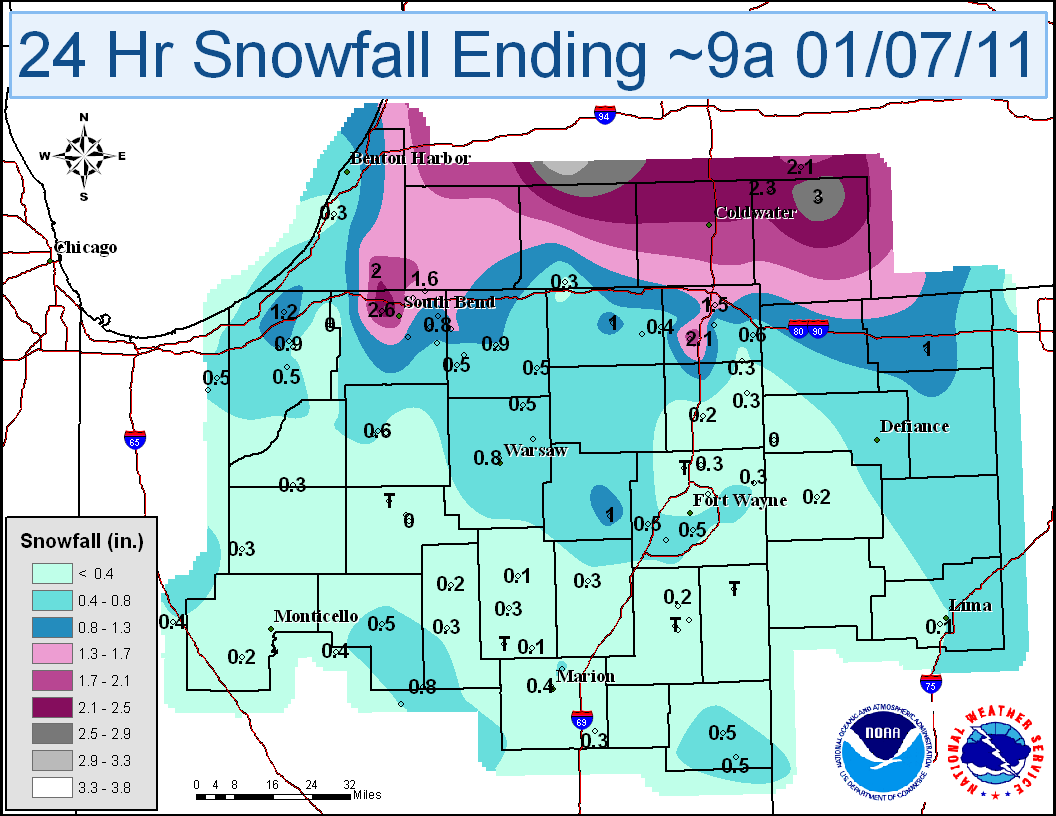
Click here for a table of daily snowfall amounts.
LOCATION                             VALUE
ATLANTA 4.1 ENE                        4.0
MUSKEGON ASOS                          3.8
KALAMAZOO 6.0 SW                       3.8
WAYLAND 2.0 W                          3.5
WALKER 3.2 W                           3.1
JONESVILLE 5.9 ENE                     3.0
BLOOMINGDALE                           3.0
SOUTH BEND ASOS                        2.6
JACKSON 1.2 ENE                        2.5
LITCHFIELD 0.3 ENE                     2.3
HANOVER 3.8 W                          2.1
HUDSON 4.6 N                           2.1
BELLEVUE 4.9 S                         2.0
HOLLAND 4.3 NNW                        2.0
BUCHANAN 1.4 ESE                       2.0
GRAND RAPIDS ASOS                      1.8
GRANGER 1.6 N                          1.6
WESTERVILLE 0.8 S                      1.5
PAW PAW 3.6 NNE                        1.5
ANGOLA 4.1 N                           1.5
VALPARAISO 2.8 WSW                     1.5
BROOKLYN 2 ENE                         1.5
NEW ALBANY 2.8 SSE                     1.4
ANN ARBOR 2.1 WNW                      1.4
GRANGER 2.9 W                          1.4
ELKHART 4.8 SW                         1.4
RIVES JUNCTION 4.0 NW                  1.2
LA PORTE 6.2 N                         1.2
MARION 4.2 SSE                         1.1
SOUTH BEND 4.6 SE                      1.1
MISHAWAKA 2.5 SE                       1.1
WAUSEON                                1.0
PIQUA 0.8 SSE                          1.0
WESTERVILLE 0.2 WNW                    1.0
ANN ARBOR 2.4 WNW                      1.0
ADRIAN 6.4 ENE                         1.0
ADRIAN 6.4 ENE                         1.0
JACKSON 3.2 W                          1.0
COLUMBIA CITY 6.6 SSE                  1.0
LAGRANGE 1.3 ENE                       1.0
VALPARAISO 4.6 NNE                     0.9
LA PORTE 1.6 SW                        0.9
LA PORTE 1.2 E                         0.9
GOSHEN 1.9 NW                          0.9
RENSSELAER                             0.8
DUBLIN 3.2 ENE                         0.8
MISHAWAKA 5.9 SE                       0.8
MISHAWAKA 3.9 ENE                      0.8
VALPARAISO 0.9 NNW                     0.8
WARSAW 1.1 NNW                         0.8
GALVESTON 1.3 ESE                      0.8
ANNA 3.1 NNW                           0.7
PORT CLINTON 2.5 W                     0.7
VALPARAISO 1.4 ENE                     0.7
VALPARAISO 5.1 WSW                     0.7
GOSHEN 1.2 WNW                         0.7
DETROIT INT AIRPORT                    0.7
PLYMOUTH                               0.6
LIMA 2.7 NE                            0.6
LANSING ASOS                           0.6
ANGOLA 8.7 ESE                         0.6
VALPARAISO 1.8 N                       0.6
LEESBURG 6.7 ESE                       0.6
WOODBURN 2.8 WSW                       0.6
FORT WAYNE ASOS                        0.6
ANGOLA                                 0.6
PORTLAND 1 SW                          0.5
PERRYSBURG 6.0 SE                      0.5
MARBLE CLIFF 1.1 WNW                   0.5
NEWPORT 3.1 SE                         0.5
KINGSBURY 1 N                          0.5
ATLANTA 4.4 W                          0.5
VALPARAISO 2.0 ESE                     0.5
VALPARAISO 0.6 SE                      0.5
VALPARAISO 1.8 NW                      0.5
VALPARAISO 3.9 ENE                     0.5
PLYMOUTH 2.5 WSW                       0.5
KINGSBURY 0.3 WNW                      0.5
LAGRANGE 7.2 ESE                       0.5
SYRACUSE 0.9 SW                        0.5
PORTLAND 6.3 SSE                       0.5
KOKOMO 4.6 ESE                         0.5
KOKOMO 7.2 WNW                         0.5
MARION 5.4 NNE                         0.5
WAKARUSA 2.4 NNE                       0.5
MILLERSBURG 0.5 SW                     0.5
WAKARUSA 0.3 WSW                       0.5
LOGANSPORT 1.7 ENE                     0.5
FORT WAYNE 7.1 WSW                     0.5
FORT WAYNE 4.0 SE                      0.5
NORTHWOOD 2.8 ENE                      0.4
MARION 2 N                             0.4
ANN ARBOR 3.1 SE                       0.4
VALPARAISO 5.7 WSW                     0.4
ORLAND 6.6 SSW                         0.4
DE MOTTE 4.1 SW                        0.4
REMINGTON 0.3 N                        0.4
DE MOTTE 5.9 S                         0.4
CAMDEN 4.9 NNE                         0.4
WOODBURN 3 N                           0.3
PERU                                   0.3
BRADFORD 2.3 NW                        0.3
WHITE PIGEON 3.4 ESE                   0.3
STEVENSVILLE 1.7 SSE                   0.3
WABASH 0.3 NNW                         0.3
NORTH JUDSON 5.7 ESE                   0.3
HAMILTON 1.7 E                         0.3
PORTAGE 0.9 ESE                        0.3
LA PORTE 2.3 ESE                       0.3
DE MOTTE 1.2 SSW                       0.3
WHEATFIELD 2.8 S                       0.3
KOKOMO 4.3 SW                          0.3
KOKOMO 6.8 W                           0.3
HUNTINGTON 0.3 W                       0.3
UPLAND 2.4 SSE                         0.3
MARION 5.6 NE                          0.3
BUTLER 0.5 NNE                         0.3
FORT WAYNE 7.0 NE                      0.3
LEO 2.2 NW                             0.3
FRANCESVILLE 2 SW                      0.3
PAULDING                               0.2
BLUFFTON 3.0 ENE                       0.2
BLUFFTON 4.1 N                         0.2
BLUFFTON 0.9 SE                        0.2
LAFAYETTE 2.2 NE                       0.2
WEST LAFAYETTE 5.1 WSW                 0.2
LAFAYETTE 2.2 S                        0.2
LAKES OF THE FOUR SEASONS 0.5 ESE      0.2
HEBRON 3.7 NE                          0.2
DENVER 1.3 NE                          0.2
PLYMOUTH 1.1 SSE                       0.2
AUBURN 0.8 NE                          0.2
INDIANAPOLIS                           0.2
CHALMERS 5 W                           0.2
SYLVANIA 1.4 WNW                       0.1
LIMA WWTP                              0.1
URBANA 0.3 ENE                         0.1
LA FONTAINE 1.1 NW                     0.1
PORTER 0.6 S                           0.1
VALPARAISO 5.5 SSW                     0.1
ATTICA 3.4 SSW                         0.1
ROCHESTER 2.4 NW                       0.1
WEST LAFAYETTE 6 NW                      T
PERRYSVILLE 4 WNW                        T
O'HARE INTERNATIONAL APT                 T
MILWAUKEE                                T
WABASH 7.3 S                             T
OTTERBEIN 2.3 SE                         T
KOUTS 2.8 N                              T
ROCHESTER 7.0 NW                         T
FRANKFORT 7.9 WSW                        T
HUNTERTOWN 2.6 ESE                       T
DECATUR 1 N                              T
BLUFFTON 1 N                             T
ROCHESTER                              0.0
NEW CARLISLE 3.3 SSW                   0.0
CROWN POINT 7.3 E                      0.0
HICKSVILLE                             0.0
24 Hour Totals Jan. 8: Lake Effect Snow amounts
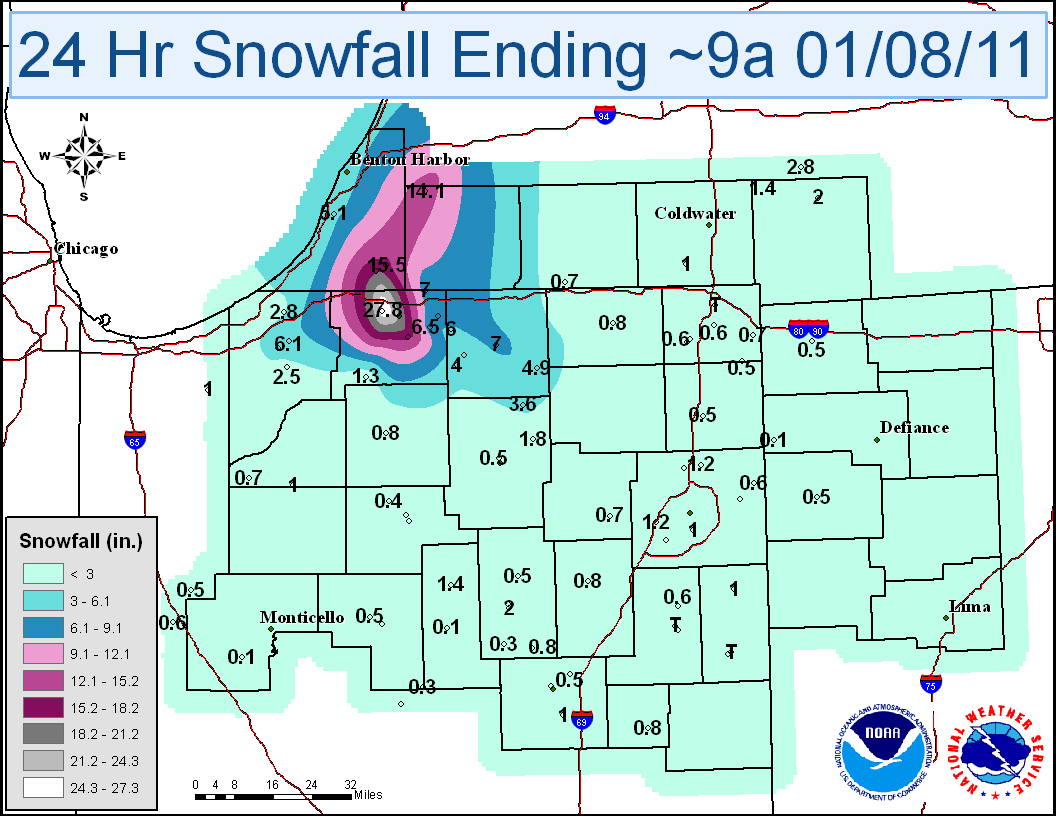
Click here for a table of daily snowfall amounts.
LOCATION                             VALUE
SOUTH BEND ASOS                       21.6
BUCHANAN 1.4 ESE                      17.5
SOUTH BEND 4.6 SE                     16.7
NILES 2.7 W                           15.5
DOWAGIAC 5.3 NNW                      14.1
GRANGER 1.6 N                          7.0
GOSHEN 1.9 NW                          7.0
MISHAWAKA 3.9 ENE                      6.5
MISHAWAKA 2.5 SE                       6.5
LA PORTE 1.2 E                         6.1
ELKHART 4.8 SW                         6.0
STEVENSVILLE 1.7 SSE                   5.1
MILLERSBURG 0.5 SW                     4.9
LA PORTE 1.6 SW                        4.2
MUSKEGON ASOS                          4.1
WAKARUSA 0.3 WSW                       4.0
WAKARUSA 2.4 NNE                       3.7
SYRACUSE 0.9 SW                        3.6
PAW PAW 3.6 NNE                        3.3
WAYLAND 2.0 W                          3.2
KALAMAZOO 6.0 SW                       3.0
HANOVER 3.8 W                          2.8
LA PORTE 6.2 N                         2.8
KINGSBURY 1 N                          2.5
KINGSBURY 0.3 WNW                      2.5
WALKER 3.2 W                           2.1
VALPARAISO 1.8 N                       2.1
ALLENDALE 1.3 SSW                      2.0
HOLLAND 4.3 NNW                        2.0
JONESVILLE 5.9 ENE                     2.0
WABASH 0.3 NNW                         2.0
KOUTS 2.8 N                            2.0
DE MOTTE 4.1 SW                        2.0
SYLVANIA 1.4 WNW                       1.8
LEESBURG 6.7 ESE                       1.8
DETROIT INT AIRPORT                    1.8
VALPARAISO 0.9 NNW                     1.7
INDIANAPOLIS                           1.7
VALPARAISO 1.8 NW                      1.6
DUBLIN 3.2 ENE                         1.5
ATLANTA 4.1 ENE                        1.5
ATLANTA 4.4 W                          1.5
VALPARAISO 5.1 WSW                     1.5
BROOKLYN 2 ENE                         1.5
PIQUA 0.8 SSE                          1.4
NEW ALBANY 2.8 SSE                     1.4
ANN ARBOR 2.1 WNW                      1.4
LITCHFIELD 0.3 ENE                     1.4
DENVER 1.3 NE                          1.4
WALKERTON 5.7 ENE                      1.3
VALPARAISO 4.6 NNE                     1.3
PORTER 0.6 S                           1.2
FORT WAYNE 5.4 WSW                     1.2
LEO 2.2 NW                             1.2
WOODBURN 2.8 WSW                       1.2
HUDSON 4.1 NNW                         1.1
WESTERVILLE 0.2 WNW                    1.0
ANN ARBOR 2.4 WNW                      1.0
BRONSON 5.9 SE                         1.0
LAFAYETTE 2.2 S                        1.0
NORTH JUDSON 5.7 ESE                   1.0
VALPARAISO 2.0 ESE                     1.0
VALPARAISO 1.4 WNW                     1.0
VALPARAISO 5.7 WSW                     1.0
GAS CITY 0.9 SW                        1.0
FORT WAYNE 4.0 SE                      1.0
BERNE 0.8 WSW                          1.0
DECATUR 1 N                            1.0
MARION 4.2 SSE                         0.9
GRAND RAPIDS ASOS                      0.9
FORT WAYNE ASOS                        0.9
OREGON 2.8 SSW                         0.8
MARBLE CLIFF 1.1 WNW                   0.8
MARION 2 N                             0.8
ANN ARBOR 3.1 SE                       0.8
BLUFFTON 0.9 SE                        0.8
LA FONTAINE 1.1 NW                     0.8
VALPARAISO 0.6 SE                      0.8
PLYMOUTH 1.1 SSE                       0.8
LAGRANGE 1.3 ENE                       0.8
HUNTINGTON 0.3 W                       0.8
HARTFORD CITY 4 ESE                    0.8
NORTH JUDSON 4 W                       0.7
WHITE PIGEON 3.4 ESE                   0.7
LANSING ASOS                           0.7
COLUMBIA CITY 6.6 SSE                  0.7
WABASH 1.2 NNW                         0.7
LAFAYETTE 2.2 NE                       0.7
ANGOLA 8.7 ESE                         0.7
HEBRON 3.7 NE                          0.7
HUNTERTOWN 2.6 ESE                     0.7
WOODBURN 3 N                           0.6
O'HARE INTERNATIONAL APT               0.6
ANNA 3.1 NNW                           0.6
MILWAUKEE                              0.6
LOWELL                                 0.6
BLUFFTON 4.1 N                         0.6
HUDSON 4.6 N                           0.6
PORTAGE 0.9 ESE                        0.6
CROWN POINT 7.8 E                      0.6
REMINGTON 0.3 N                        0.6
ANGOLA                                 0.6
RENSSELAER                             0.5
ROCHESTER                              0.5
PAULDING                               0.5
NORTHWOOD 2.8 ENE                      0.5
PORT CLINTON 2.5 W                     0.5
MONTPELIER 0.6 NW                      0.5
MONROE 3.1 SW                          0.5
URBANA 0.3 ENE                         0.5
WEST LAFAYETTE 5.1 WSW                 0.5
HAMILTON 1.7 E                         0.5
VALPARAISO 5.5 SSW                     0.5
WARSAW 1.1 NNW                         0.5
RENSSELAER 6.2 SE                      0.5
KOKOMO 4.3 SW                          0.5
KOKOMO 7.2 WNW                         0.5
KOKOMO 6.8 W                           0.5
MARION 5.6 NE                          0.5
ATTICA 3.4 SSW                         0.5
AUBURN 0.8 NE                          0.5
LOGANSPORT 1.7 ENE                     0.5
LOGANSPORT 2.2 NNW                     0.5
JACKSON 1.2 ENE                        0.4
RIVES JUNCTION 4.0 NW                  0.4
ROCHESTER 7.0 NW                       0.4
BOWLING GREEN 1.7 NW                   0.3
NEWPORT 3.1 SE                         0.3
WABASH 7.3 S                           0.3
DE MOTTE 1.2 SSW                       0.3
WHEATFIELD 2.8 S                       0.3
GALVESTON 1.3 ESE                      0.3
ROCHESTER 2.4 NW                       0.2
PERU                                   0.1
HICKSVILLE                             0.1
CHALMERS 5 W                           0.1
WEST LAFAYETTE 6 NW                      T
BELLEVUE 4.9 S                           T
ANGOLA 4.1 N                             T
BLUFFTON 1 N                             T
BERNE                                    T
24 Hour Totals Jan 9: Lake Effect Snow amounts
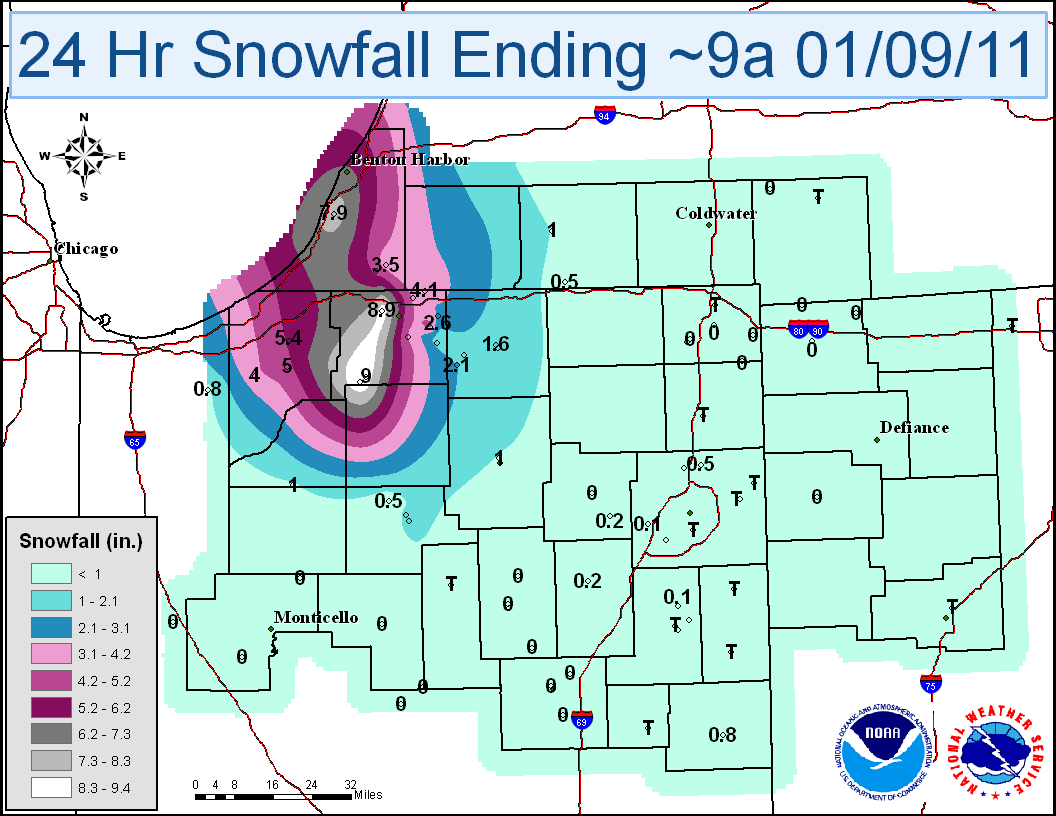
Click here for a table of daily snowfall amounts.
LOCATION                             VALUE
WALKERTON 4.1 ENE                      9.5
WALKERTON 5.7 ENE                      9.0
SOUTH BEND ASOS                        8.9
STEVENSVILLE 1.7 SSE                   7.9
LA PORTE 1.2 E                         5.4
KINGSBURY 1 N                          5.0
KINGSBURY 0.3 WNW                      5.0
BUCHANAN 1.4 ESE                       4.5
MISHAWAKA 2.5 SE                       4.5
GRANGER 1.6 N                          4.1
WESTVILLE 4.7 ESE                      4.0
SOUTH BEND 4.6 SE                      3.9
GRANGER 2.9 W                          3.8
NILES 2.7 W                            3.5
MISHAWAKA 3.9 ENE                      2.6
VALPARAISO 1.8 N                       2.2
WAKARUSA 0.3 WSW                       2.1
GOSHEN 1.2 WNW                         2.1
PORTER 0.6 S                           1.9
WAKARUSA 2.4 NNE                       1.8
GOSHEN 1.9 NW                          1.6
ROCHESTER                              1.5
VALPARAISO 1.8 NW                      1.4
VALPARAISO 1.4 ENE                     1.3
VALPARAISO 0.9 NNW                     1.2
ROCHESTER 2.4 NW                       1.2
MISHAWAKA 5.9 SE                       1.1
THREE RIVERS                           1.0
PAW PAW 3.6 NNE                        1.0
NORTH JUDSON 5.7 ESE                   1.0
WARSAW 1.1 NNW                         1.0
VALPARAISO 0.6 WSW                     0.9
VALPARAISO 2.0 ESE                     0.8
VALPARAISO 1.4 WNW                     0.8
PORTLAND 1.7 SSW                       0.8
ANNA 3.1 NNW                           0.5
WESTERVILLE 0.2 WNW                    0.5
WHITE PIGEON 3.4 ESE                   0.5
ROCHESTER 7.0 NW                       0.5
LEO 2.2 NW                             0.5
PORTAGE 0.9 ESE                        0.4
HUNTERTOWN 2.6 ESE                     0.3
MARION 4.2 SSE                         0.2
COLUMBIA CITY 6.6 SSE                  0.2
VALPARAISO 0.6 SE                      0.2
VALPARAISO 5.1 WSW                     0.2
HUNTINGTON 0.3 W                       0.2
FORT WAYNE ASOS                        0.2
BLUFFTON 3.0 ENE                       0.1
BLUFFTON 4.1 N                         0.1
BLUFFTON 0.9 SE                        0.1
VALPARAISO 5.5 SSW                     0.1
FORT WAYNE 7.1 WSW                     0.1
WOODBURN 3 N                             T
TOLEDO AIRPORT                           T
PIQUA 0.8 SSE                            T
SYLVANIA 1.4 WNW                         T
LIMA 2.7 NE                              T
MUSKEGON ASOS                            T
ANN ARBOR 2.1 WNW                        T
RIVES JUNCTION 4.0 NW                    T
JONESVILLE 5.9 ENE                       T
LANSING ASOS                             T
WABASH 0.3 NNW                           T
ANGOLA 4.1 N                             T
HEBRON 3.7 NE                            T
DENVER 1.3 NE                            T
WHEATFIELD 2.8 S                         T
AUBURN 0.8 NE                            T
INDIANAPOLIS                             T
FORT WAYNE 4.0 SE                        T
WOODBURN 2.8 WSW                         T
HARTFORD CITY 4 ESE                      T
DECATUR 1 N                              T
BLUFFTON 1 N                             T
BERNE                                    T
RENSSELAER                             0.0
PAULDING                               0.0
O'HARE INTERNATIONAL APT               0.0
ALVORDTON 0.5 E                        0.0
PIONEER 4.6 WNW                        0.0
NORTHWOOD 2.8 ENE                      0.0
PERRYSBURG 6.0 SE                      0.0
BELLEVUE 4.9 S                         0.0
MARBLE CLIFF 1.1 WNW                   0.0
MARION 2 N                             0.0
MONTPELIER 0.6 NW                      0.0
MILWAUKEE                              0.0
ANN ARBOR 3.1 SE                       0.0
ANN ARBOR 2.4 WNW                      0.0
WALKER 3.2 W                           0.0
HOLLAND 4.3 NNW                        0.0
MONROE 3.1 SW                          0.0
NEWPORT 3.1 SE                         0.0
KALAMAZOO 6.0 SW                       0.0
JACKSON 1.2 ENE                        0.0
LITCHFIELD 0.3 ENE                     0.0
WAYLAND 2.0 W                          0.0
BURNETTSVILLE 9.9 NNW                  0.0
URBANA 0.3 ENE                         0.0
WABASH 1.2 NNW                         0.0
LA FONTAINE 1.1 NW                     0.0
OTTERBEIN 2.3 SE                       0.0
LAFAYETTE 2.2 S                        0.0
ATLANTA 4.1 ENE                        0.0
ATLANTA 4.4 W                          0.0
ANGOLA 8.7 ESE                         0.0
HAMILTON 1.7 E                         0.0
HUDSON 4.6 N                           0.0
HUDSON 4.1 NNW                         0.0
CROWN POINT 7.8 E                      0.0
DE MOTTE 4.1 SW                        0.0
REMINGTON 0.3 N                        0.0
DE MOTTE 1.2 SSW                       0.0
KOKOMO 7.2 WNW                         0.0
KOKOMO 6.8 W                           0.0
MARION 5.6 NE                          0.0
GAS CITY 0.9 SW                        0.0
ATTICA 3.4 SSW                         0.0
LOGANSPORT 1.7 ENE                     0.0
GALVESTON 1.3 ESE                      0.0
GRAND RAPIDS ASOS                      0.0
DETROIT INT AIRPORT                    0.0
COLUMBIA CITY                          0.0
CHALMERS 5 W                           0.0
BLOOMINGDALE                           0.0
BROOKLYN 2 ENE                         0.0
ANGOLA                                 0.0
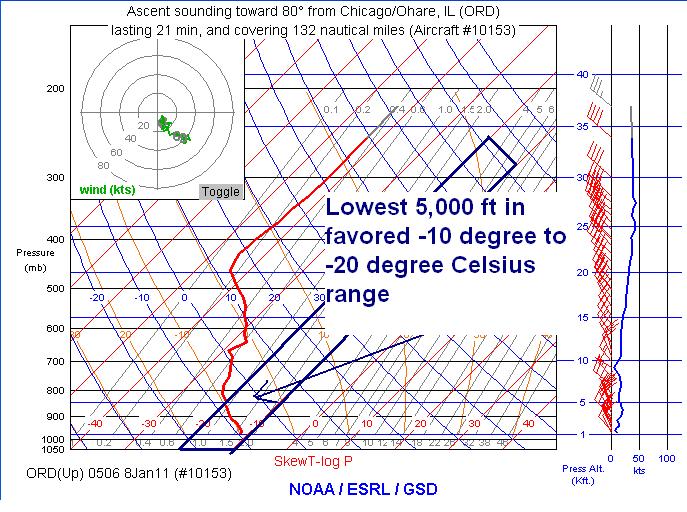
Below is a temperature soundings from regional aircraft data (AMDAR) late Friday night, just before the period of heaviest snowfall. In this sounding, note that in the lowest 5,000 feet above ground level, the sounding falls in the -10 to -20 degree Celsius range. The combination of strong saturated ascent associated with lake effect bands and temperatures in this range serve as a prime environment for dendritic snow crystal formation. Dendritic snow growth is generally the most efficient type of snow production when it comes to the heaviest snow accumulations within any given amount of cloud liquid water vapor and/or super cooled water droplets through snow crystal aggregation and riming especially within this temperature range.
This was readily apparent in model derived time-height cross sections (North American Model shown below). Relative humidity (shaded image, %), and overlayed with Omega (cyan, microbars/sec), winds (white, kts) and the -15°C isotherm (yellow, dashed line). Note the depth of the model implied saturated ascent both prior to and following the mesovort passage (white annotation).

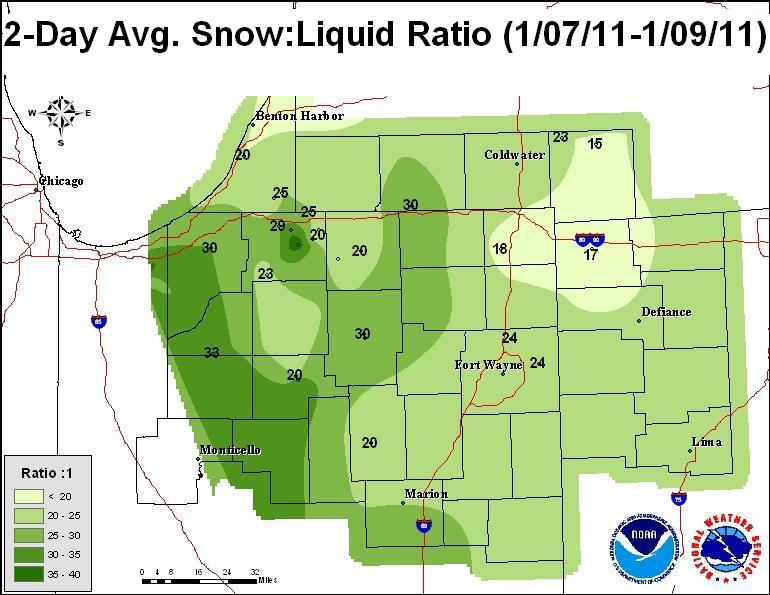
Conditions favorable for dendritic snow growth were experienced through much of the 2-day event resulting in very high snow to liquid ratios. Some of the highest observed snow to liquid ratios were noted around South Bend where 2-day average snow to liquid ratios of 35 to 40 to 1 one were noted, approximately two times the climatological snow to liquid ratios. These very high ratios played a large part in the extreme hourly snowfall rates observed during the event.
Given the intensity of the low level thermal troughing over Lake Michigan, convective cloud growth extended up to 15 kft as noted in radar echo tops and measured in cloud top temperatures in excess of -30°C. Over 16.2" inches of snow was received at the South Bend Airport between 1 and 7 am on Saturday, January 8 with snowfall rates in excess of 4 in/hr for a time. Below is a radar loop (3:40 - 7:00 am) showing the band of heavy snow that straddled the South Bend Airport. Notice the area of high radar returns (>35 dBZ) directly over the South Bend metro area where the highest snowfall rates were observed.
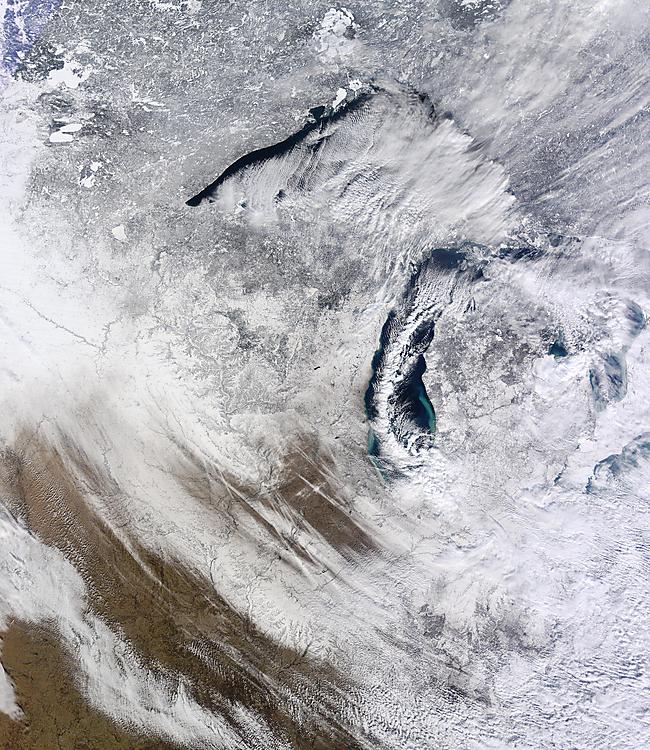
Below is a high-resolution MODIS visible satellite view of Lake Michigan on Saturday January 8th. The band of lake effect snow showers is clearly visible across the entire span of Lake Michigan.
Below is the evolution of the mesoscale vortex was evident on McIDAS images of 15-minute interval GOES-13 0.65 µm visible channel data (below; click image to play animation). Also note the numerous long, narrow streaks of snow on the ground across parts of northern Illinois into northern Indiana, left behind from previous events.

OBERGFELL/MARSILI/HOLSTEN

