Flood Outlook issued Feb 27, 2025
Key Points
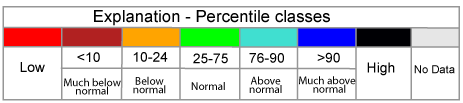
Seasonal Flood Outlook Probability Table for River Forecast Locations
Seasonal Flood Outlook Graphics (select site on map, select 'Full Gauge Page' on top of hydrograph, then scroll down)
Hydrographs with the Official Forecast River Forecast. The forecasts use 48 hours of precipitation April 1 to Sep 30 and 24 hours of precipitation from Oct 1 to March 31.
Feb 13, 2025 Slides
Feb. 27, 2025 Slides
Mar. 13, 2025
If you have any questions or comments about this spring flood outlook or the new river forecast website please contact:
Sarah Marquardt
Senior Service Hydrologist
National Weather Service Milwaukee
sarah.marquardt@noaa.gov
Flood Risk Factors
Current Conditions (some images auto update and conditions may differ from when the spring flood outlook was issued)
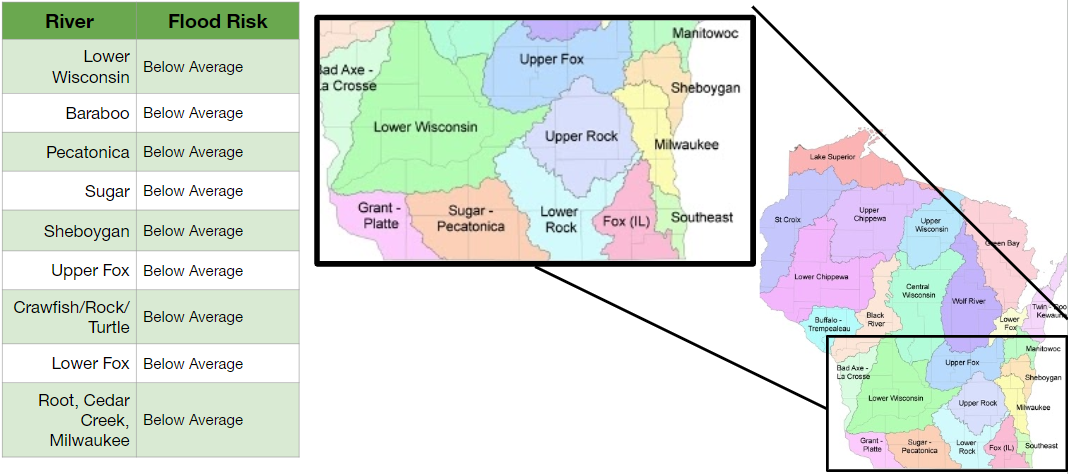
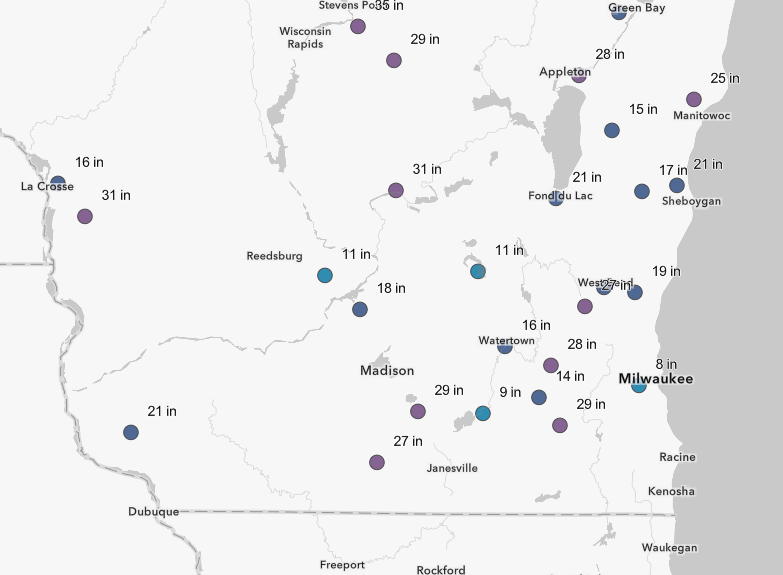
| Snow Water Equivalent (inches) | Ranked Snow Water Equivalent | Frost Depth (inches) 2/25/25 |
 |
 |
|
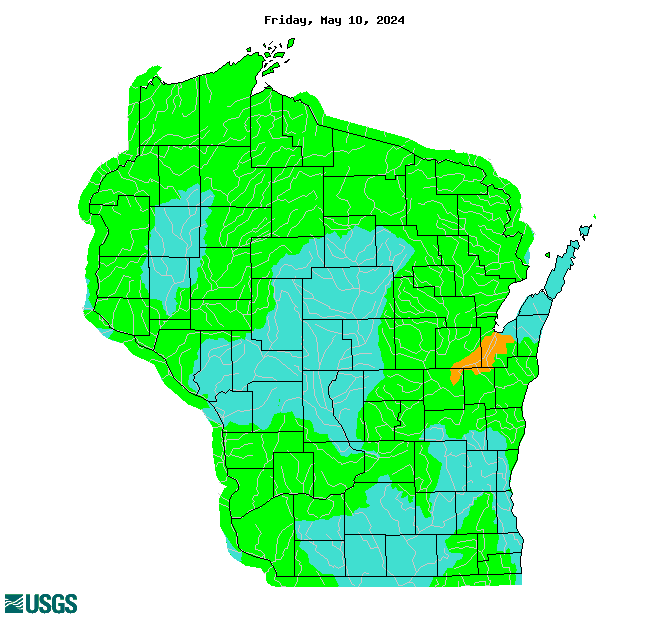
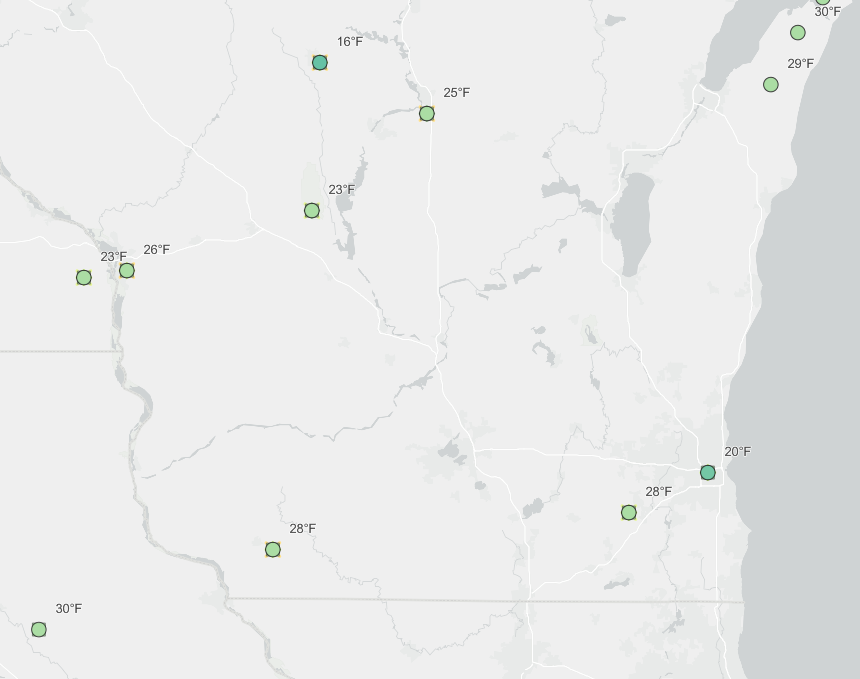
| Soil Temperature 2/11/25 | 14 Day Streamflow Percentile | Soil Moisture Percentile - Climate Prediction Center |
 |
|
|
| 30 Day Precipitation Departure From Normal | 4 Month Precipitation Departure from Normal | U.S. Drought Monitor |
 |
 |
 |
Flood Risk Factors (as of 2/25/25)
Snow Pack
There is little to no snow across southern Wisconsin. Typically there is 0.5 to 1 inch. The below average snowpack is a large factor in reducing the flood risk.
Frost Depth
There is 10 to 30 inches of frost in the ground at this time, which is deeper than usual. This helps to increase the flood risk somewhat because moisture will not easily infiltrate into the ground leading to more surface water runoff into area waterways.
Streamflow and River Levels
Precipitation since December 1 is 25-75% of normal across southern Wisconsin. Streamflow values are average to below average, with the lowest values in southeast Wisconsin. As a result, there is some room in rivers to hold additional rainfall.
Soil Moisture
Soil moisture is in the 10-30th percentile across southeast Wisconsin where the precipitation deficits since the fall are the greatest. It is in the 30-70th percentile, the near normal category, across the remainder of southern Wisconsin. The U.S. Drought Monitor indicates Moderate Drought in southeast Wisconsin. As a result, there is room for the ground to absorb water from melting snow and spring rain in southeast Wisconsin. This is another big factor in the reduced flood risk in that area.
Rivers and Ice
Rivers have accumulated more ice than usual, leading to a slightly elevated for break up jams when the flows increase on the rivers.

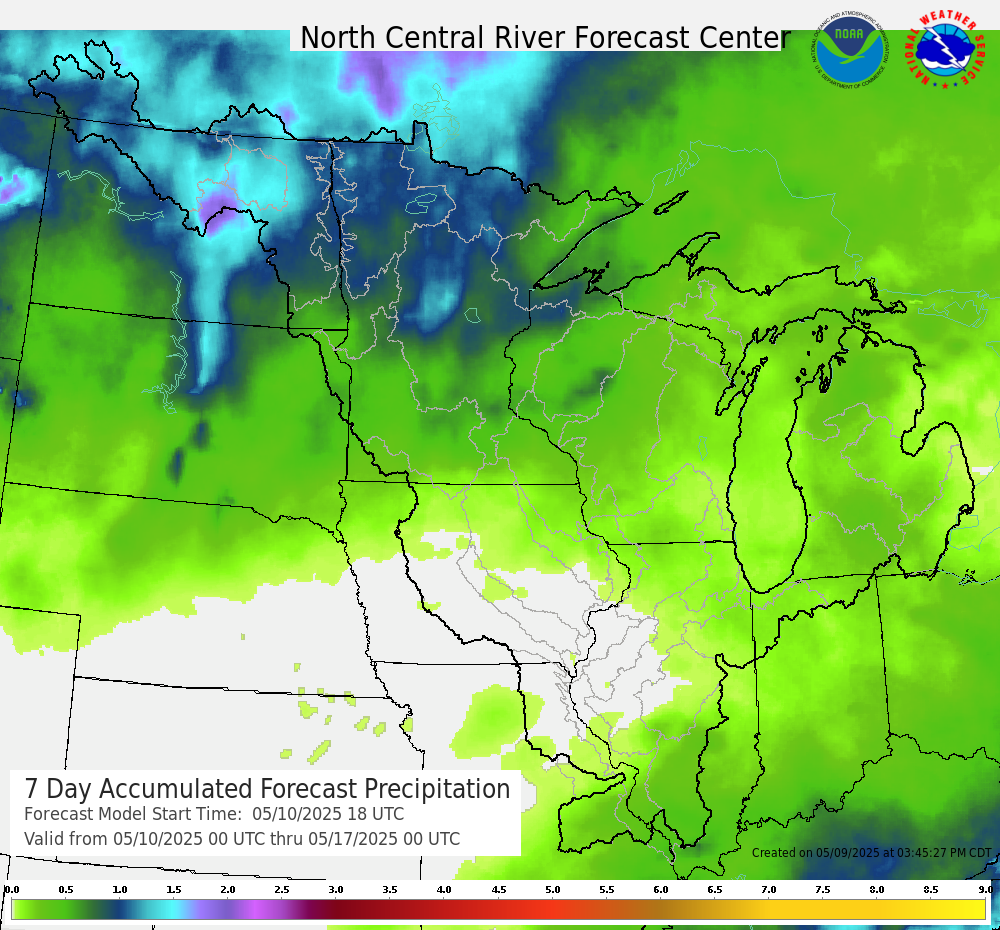
Looking Ahead (images auto update)
| 7 Day Precipitation Forecast |
 |
Extended outlooks from the Climate Prediction Center:
 |
 |
 |
 |
 |
 |
How To Prepare Safety
Preparedness/Early Actions:
How To Stay Safe During a Flood:
Flood Risk and River Outlooks
Long Range Outlooks
Weekly Probability of Exceeding Flood Stage by Location. More information is here.
 |
 |
 |
 |
 |
 |
 |
 |
 |
 |
 |
 |
 |
 |
 |
 |
 |
 |
 |
 |
 |
 |
 |
 |
 |
 |
 |
 |
 |
10 Day River Outlook
Includes 10 days of precipitation, snowmelt, and temperature. These are automated forecasts with no human forecaster intervention that update twice per day. More information is here.
 |
 |
 |
 |
 |
 |
 |
 |
 |
 |
 |
 |
 |
 |
 |
 |
 |
 |
 |
 |
 |
 |
 |
 |
 |
 |
 |
 |
 |
Media use of NWS Web News Stories is encouraged! Please acknowledge the NWS as the source of any news information accessed from this site. |
|