Overview
|
An area of low pressure tracked from southeastern Nebraska during the morning of April 2nd to western Wisconsin by evening, triggering two rounds of convection across central Illinois. Round 1 occurred during the morning, when a line of thunderstorms along the trailing cold front pushed into the Illinois River Valley. These storms were generally sub-severe, but one storm produced a downburst with estimated winds in excess of 70 mph across parts of Logan County, downing a few trees, tearing the roof off a business, and flipping 3 semis in and near Lincoln. Round 2 materialized by early afternoon as storms redeveloped along an outflow boundary from the morning convection along the I-55 corridor. These storms tapped into a moderately unstable and highly sheared environment and quickly became severe. Several tornadoes occuured, especially along the I-70 corridor. Numerous reports of wind damage and hail were also received as they congealed into a line and pushed eastward across I-57 by early evening. This page focuses on central and southeast Illinois. For nearby areas, visit the following web pages:
|
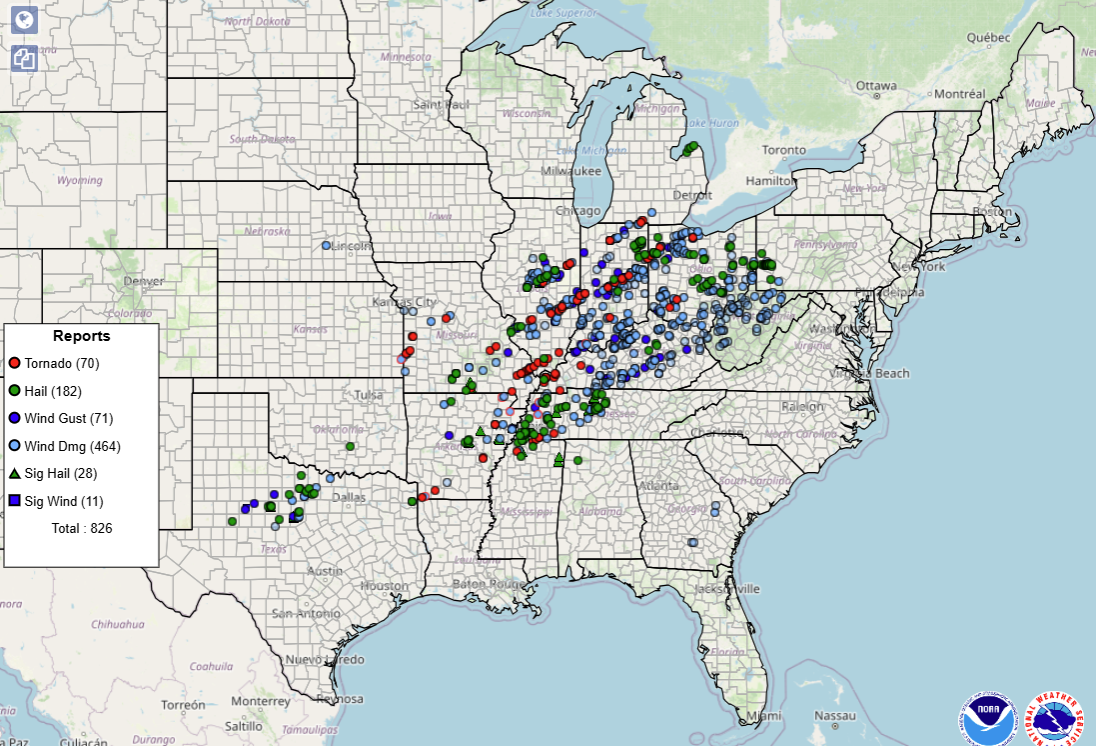 Map of severe weather reports across the nation on April 2, 2005. Image courtesy of the Storm Prediction Center. |
Tornadoes
Select a tornado from the table to zoom into the track and view more information. The default table view is limited to 8 tracks, but can be scrolled by a mouse wheel or dynamically expanded. Additionally, the table can fill the entire window by clicking the small circular expanding arrow icon at the very top right of the table and returned to its original size by clicking the button again. The side information panel that opens over the map can be closed using the "X" on the upper right corner of the pop-up. Zoom into the map and click damage points to see detailed information and pictures from the surveys.
|
NOTE: times shown below are local to your device's time zone. |

The Enhanced Fujita (EF) Scale classifies tornadoes into the following categories:
| EF0 Weak 65-85 mph |
EF1 Moderate 86-110 mph |
EF2 Significant 111-135 mph |
EF3 Severe 136-165 mph |
EF4 Extreme 166-200 mph |
EF5 Catastrophic 200+ mph |
 |
|||||
| Tornadoes that fail to impact any ratable structures on the EF-Scale are rated EF-Unknown (EF-U) | |||||
Photos & Video
Header
| Caption (source) |
Caption (source) |
Caption (source) |
Caption (source) |
Environment
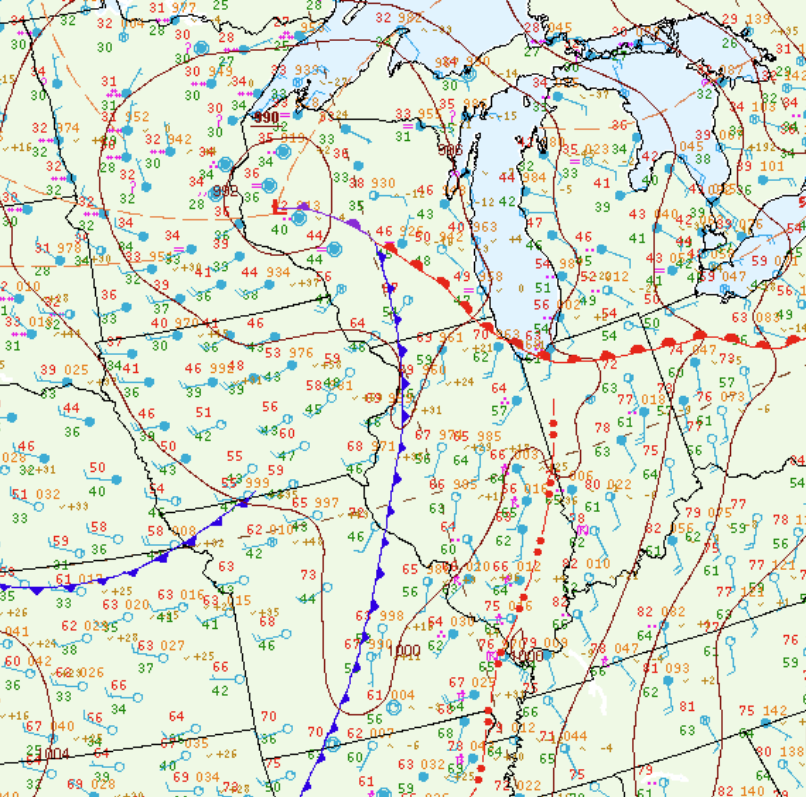
The surface analysis from 7 pm April 2nd showed a squall line (denoted by the red dashes and dots on the Figure 1 map below) from near Paris, Illinois southwestward into the bootheel of Missouri. A warm and humid airmass existed ahead of the line across the Ohio River Valley where temperatures were in the upper 70s and lower 80s and dewpoints were in the lower to middle 60s.
 |
||
| Figure 1: 7 pm surface map | Figure 2: Caption | Figure 3: Caption |
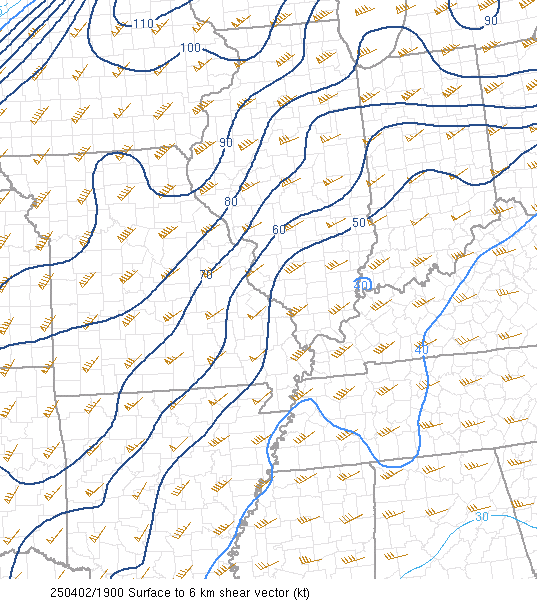
Given the warm and humid conditions, the atmosphere became moderately unstable during the afternoon. Mesoanalysis from 2 pm revealed Mixed Layer Convective Available Potential Energy (MLCAPE) values in excess of 1500J/kg along and south of a Springfield to Paris line (figure 4). A powerful jet streak contributed to high values of wind shear. 0-6 km bulk shear ranged from 50-70kt (figure 5) within the zone of greatest instability, while 0-1 km shear reached 30-40kt. Both values were highly supportive of supercell thunderstorm development. The Significant Tornado Parameter (STP), which combines a number of variables in order to provide an estimate of possible EF-2 or stronger tornadoes was analyzed at greater than 4 across a good portion of south-central Illinois during the early afternoon (figure 6). Values in excess of 1 indicate an increasing potential for significant tornadoes.
 |
 |
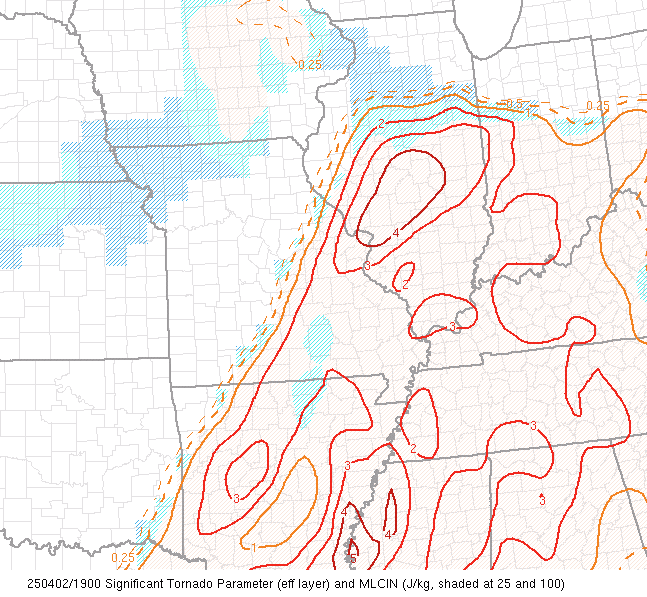 |
| Figure 4: Mixed layer CAPE at 2 pm | Figure 5: 0-6 km shear at 2 pm | Figure 6: Significant tornado parameter at 2 pm |
As the line of convection that formed along I-55 during the early afternoon pushed eastward, it encountered the favorable storm environment outlined above. While wind damage and hail reports were received along the entire line, the southern portion became dominant by late afternoon and early evening. This is likely due to the greater instability, richer deep-layer moisture, and lower Lifting Condensation Levels (LCLs) further south. Numerous kinks and notches developed along the leading edge of the line, particularly along and south of I-70. This helped enhance the severe weather threat, and several tornadoes occurred in that area.
Radar
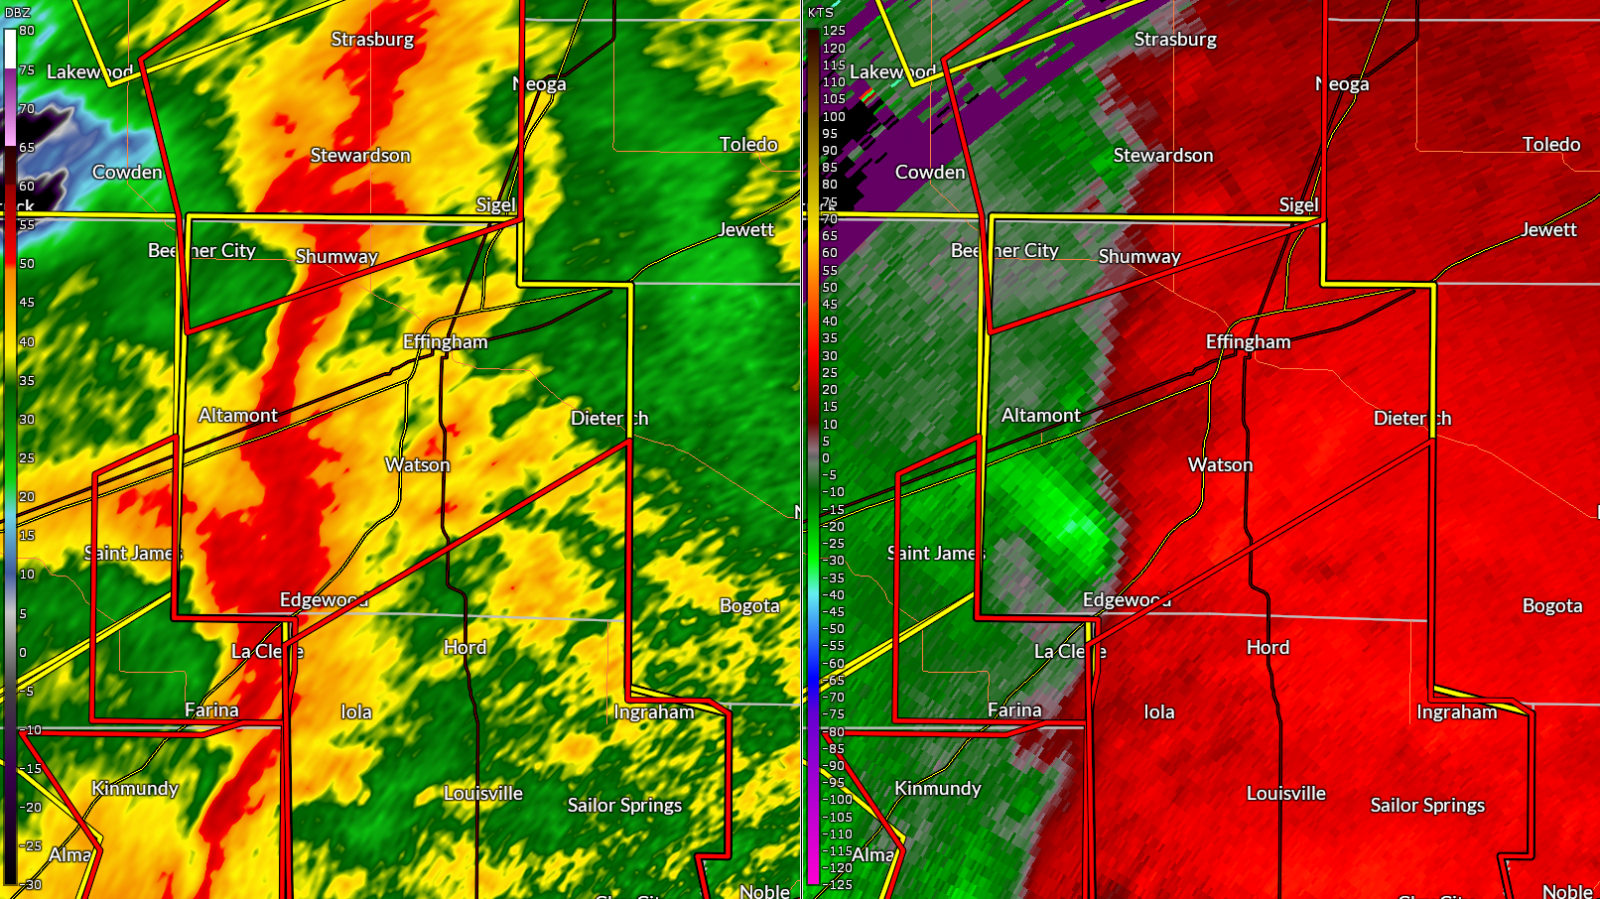
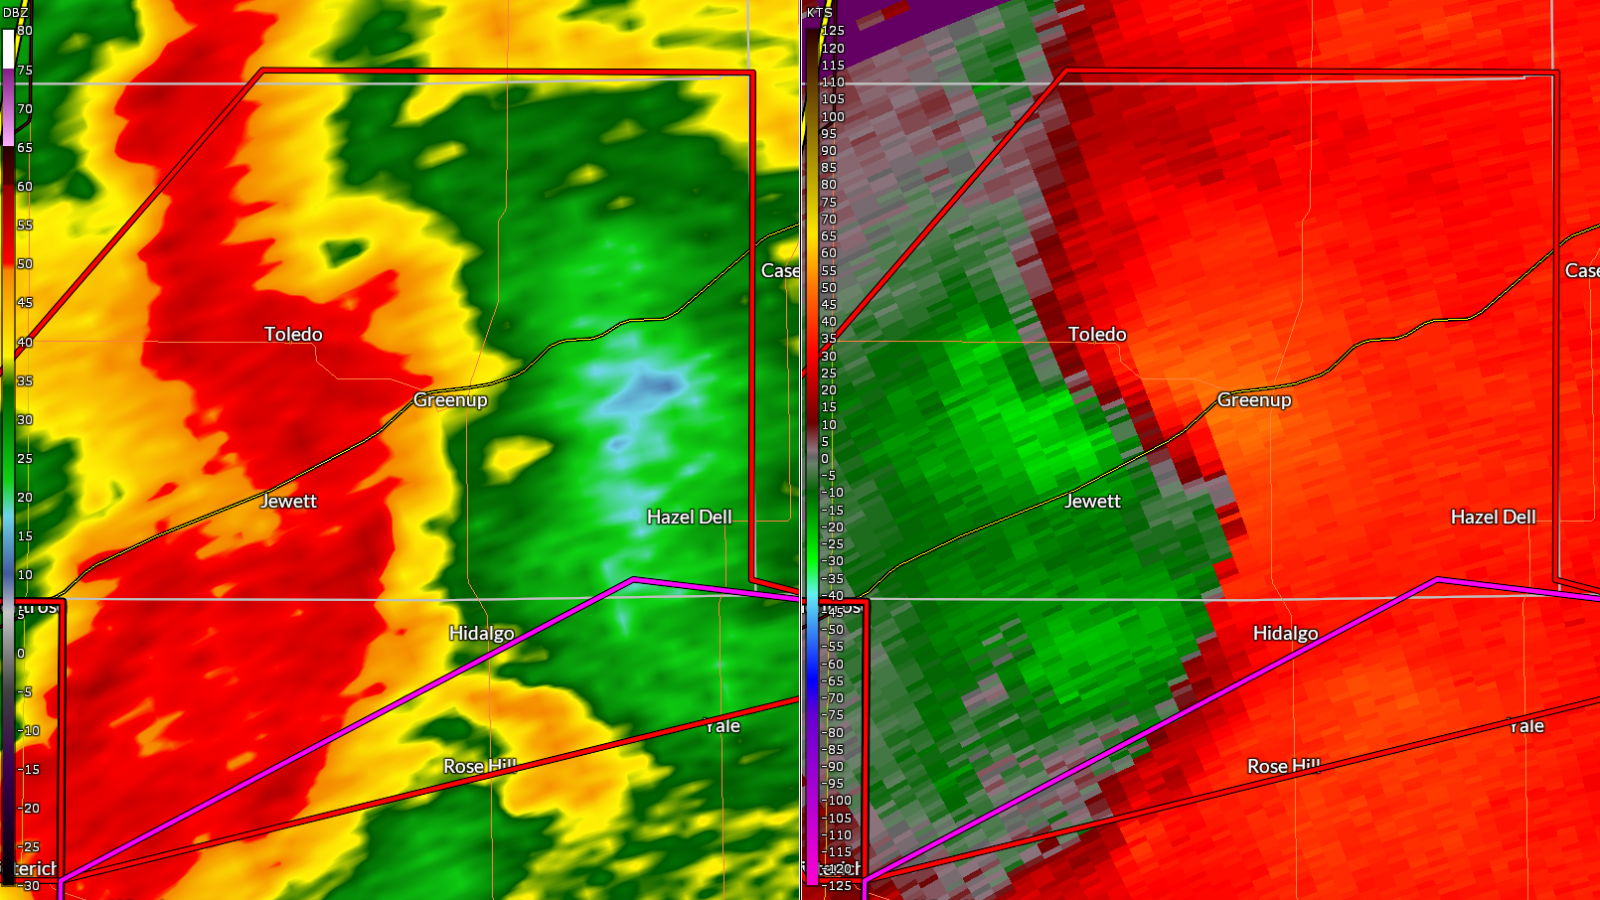
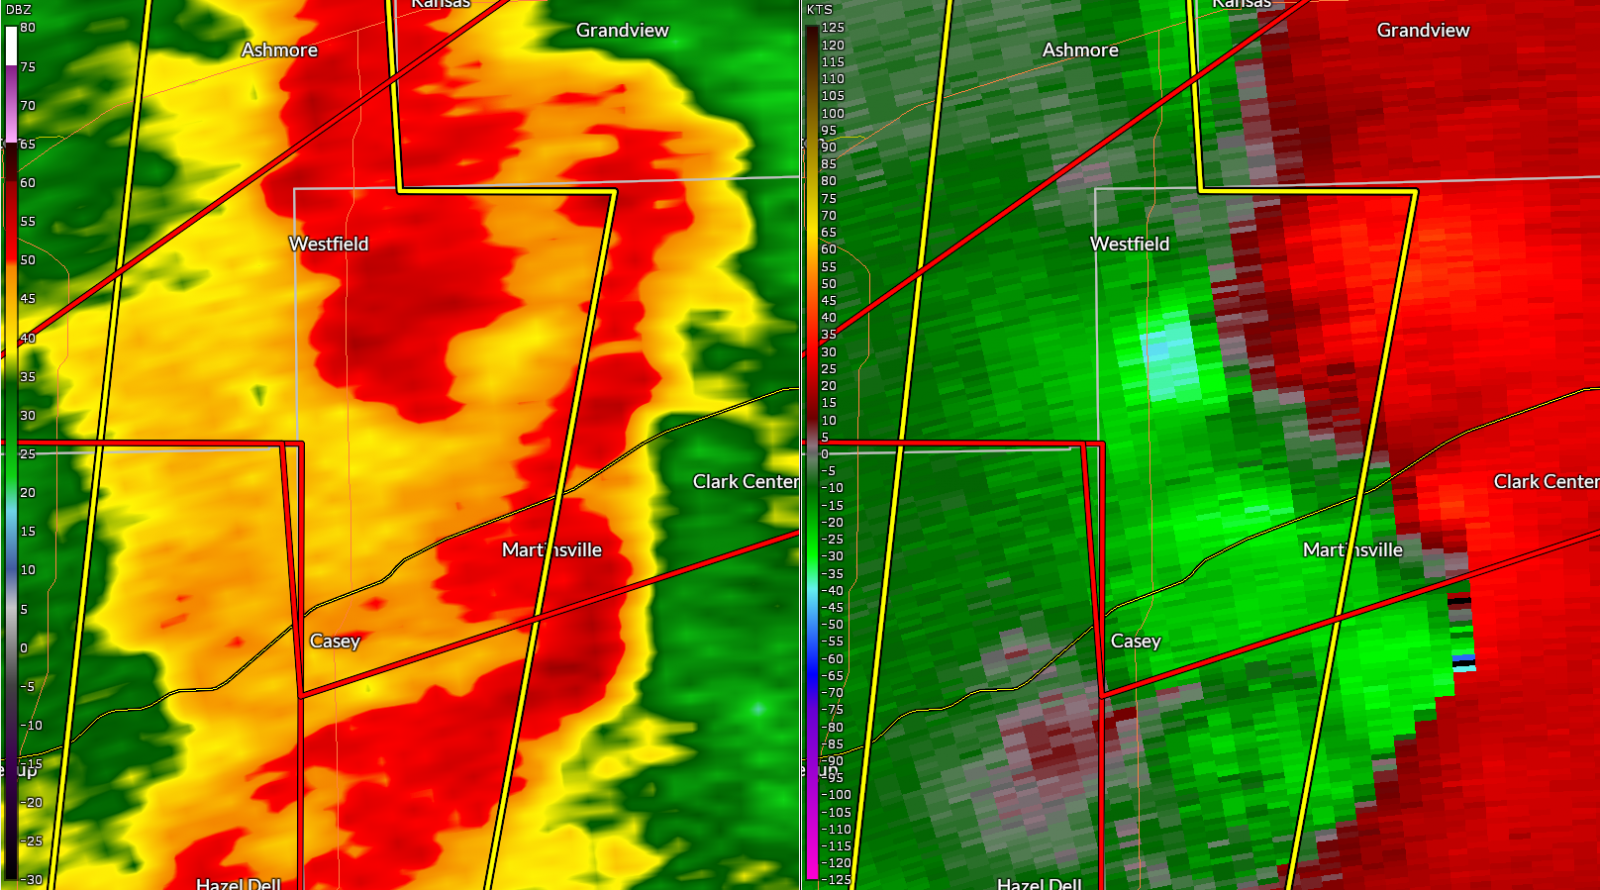
Local radar images from the Evansville, IN (KVWX) Doppler radar
 |
 |
 |
 |
| Regional radar loop from 2-8 pm (courtesy of the College of DuPage) |
6:11 pm, while the Altamont tornado was in progress | 6:34 pm, near the start of the long track tornado south of Toledo | 6:53 pm, as the tornado was in northwest Clark County |
Additional Information
Evolution of the severe weather outlooks:
 |
 |
 |
 |
| Issued March 28 | Issued March 29 | Issued March 30 | Issued March 31 |
 |
 |
 |
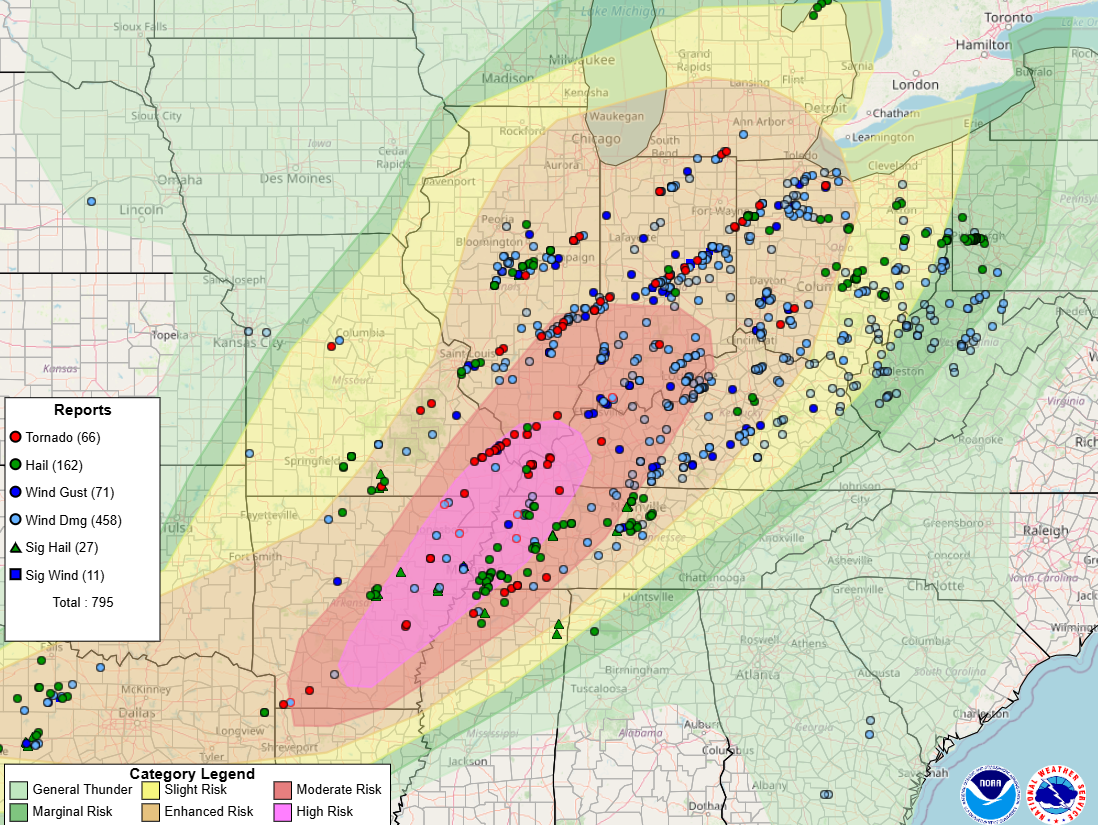 |
| Issued April 1 | Issued April 2 | Tornado Watch issued at 315 pm April 2 | April 2nd outlook with storm reports overlaid |
 |
Media use of NWS Web News Stories is encouraged! Please acknowledge the NWS as the source of any news information accessed from this site. |
|

