| Previous Month | Next Month |
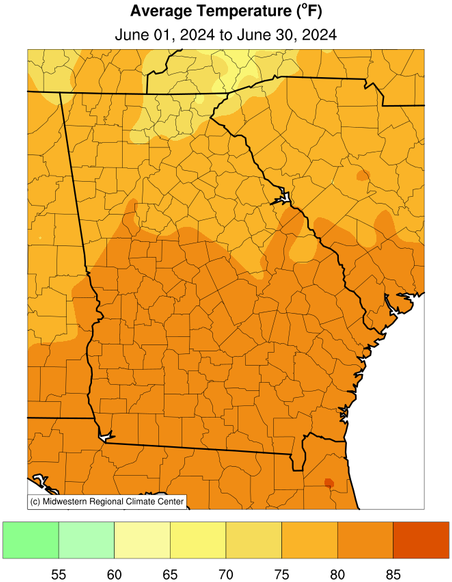
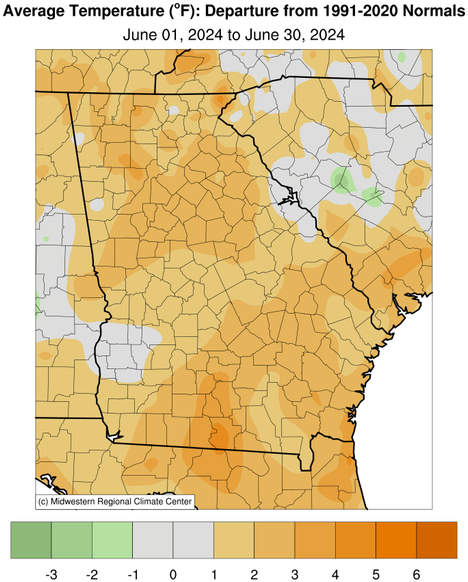
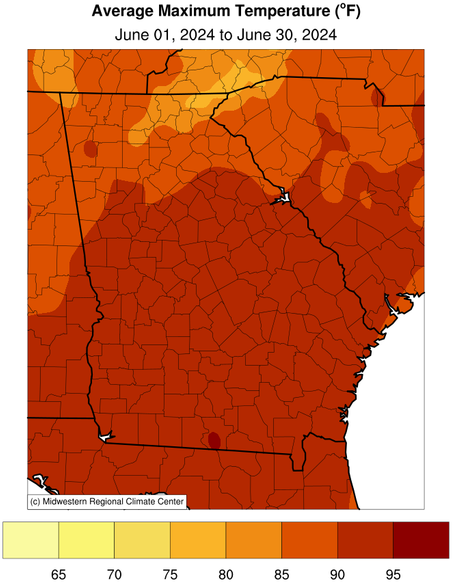
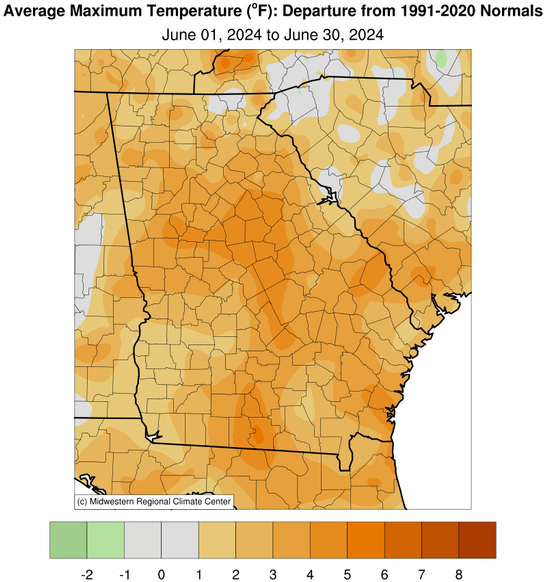
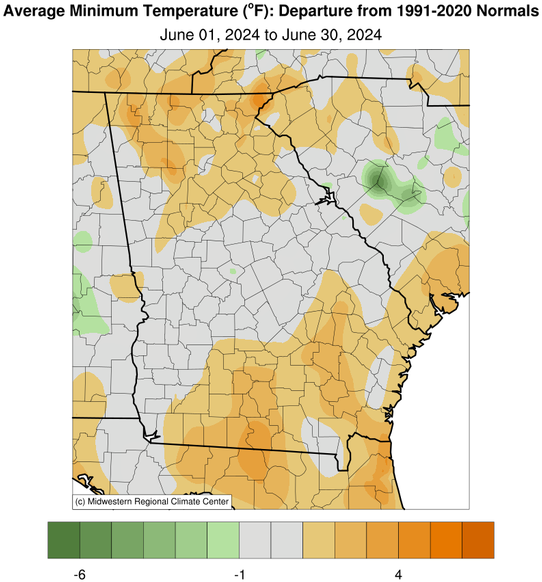
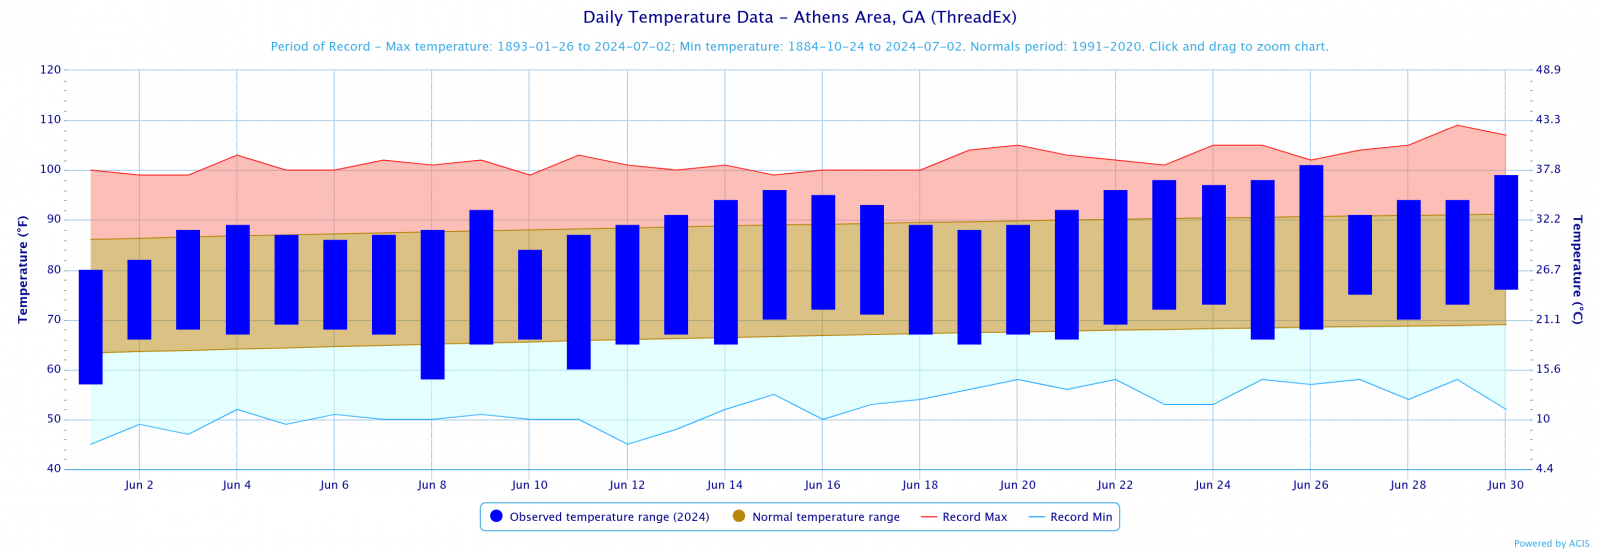
Temperatures through the month of June were around 2 degrees above normal. Precipitation through the month of May was around 3 inches below normal.
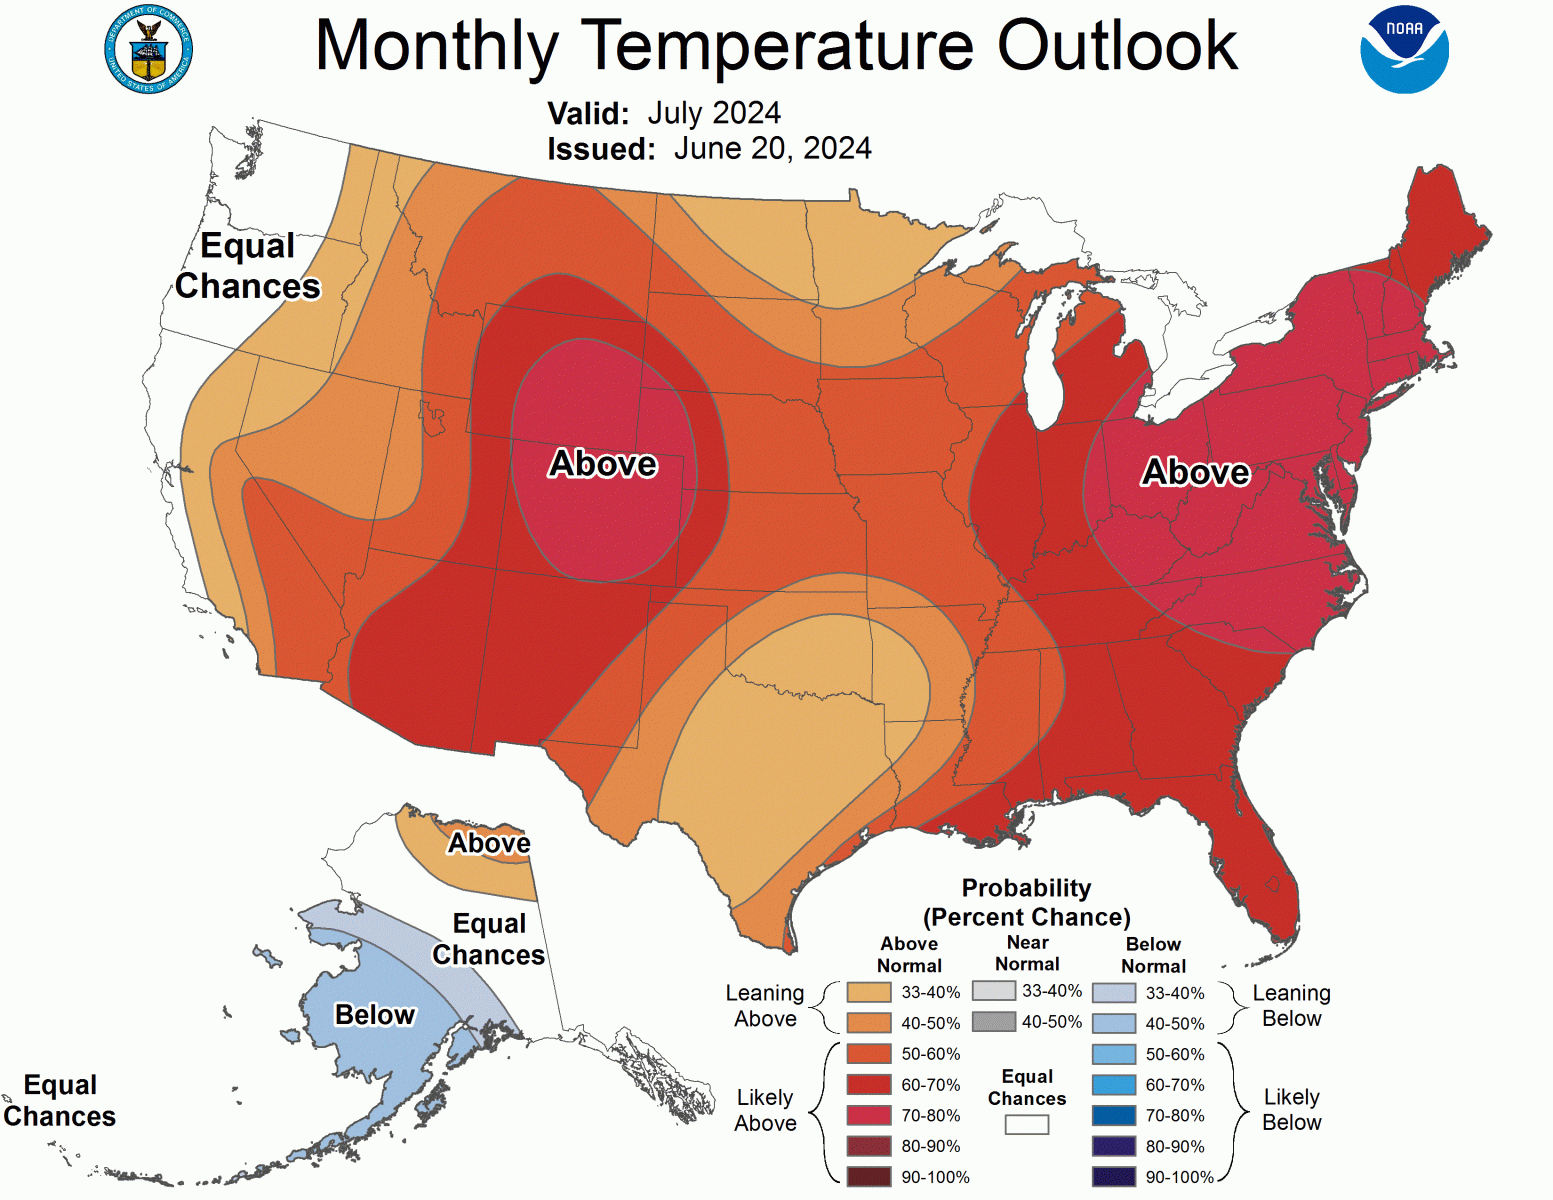
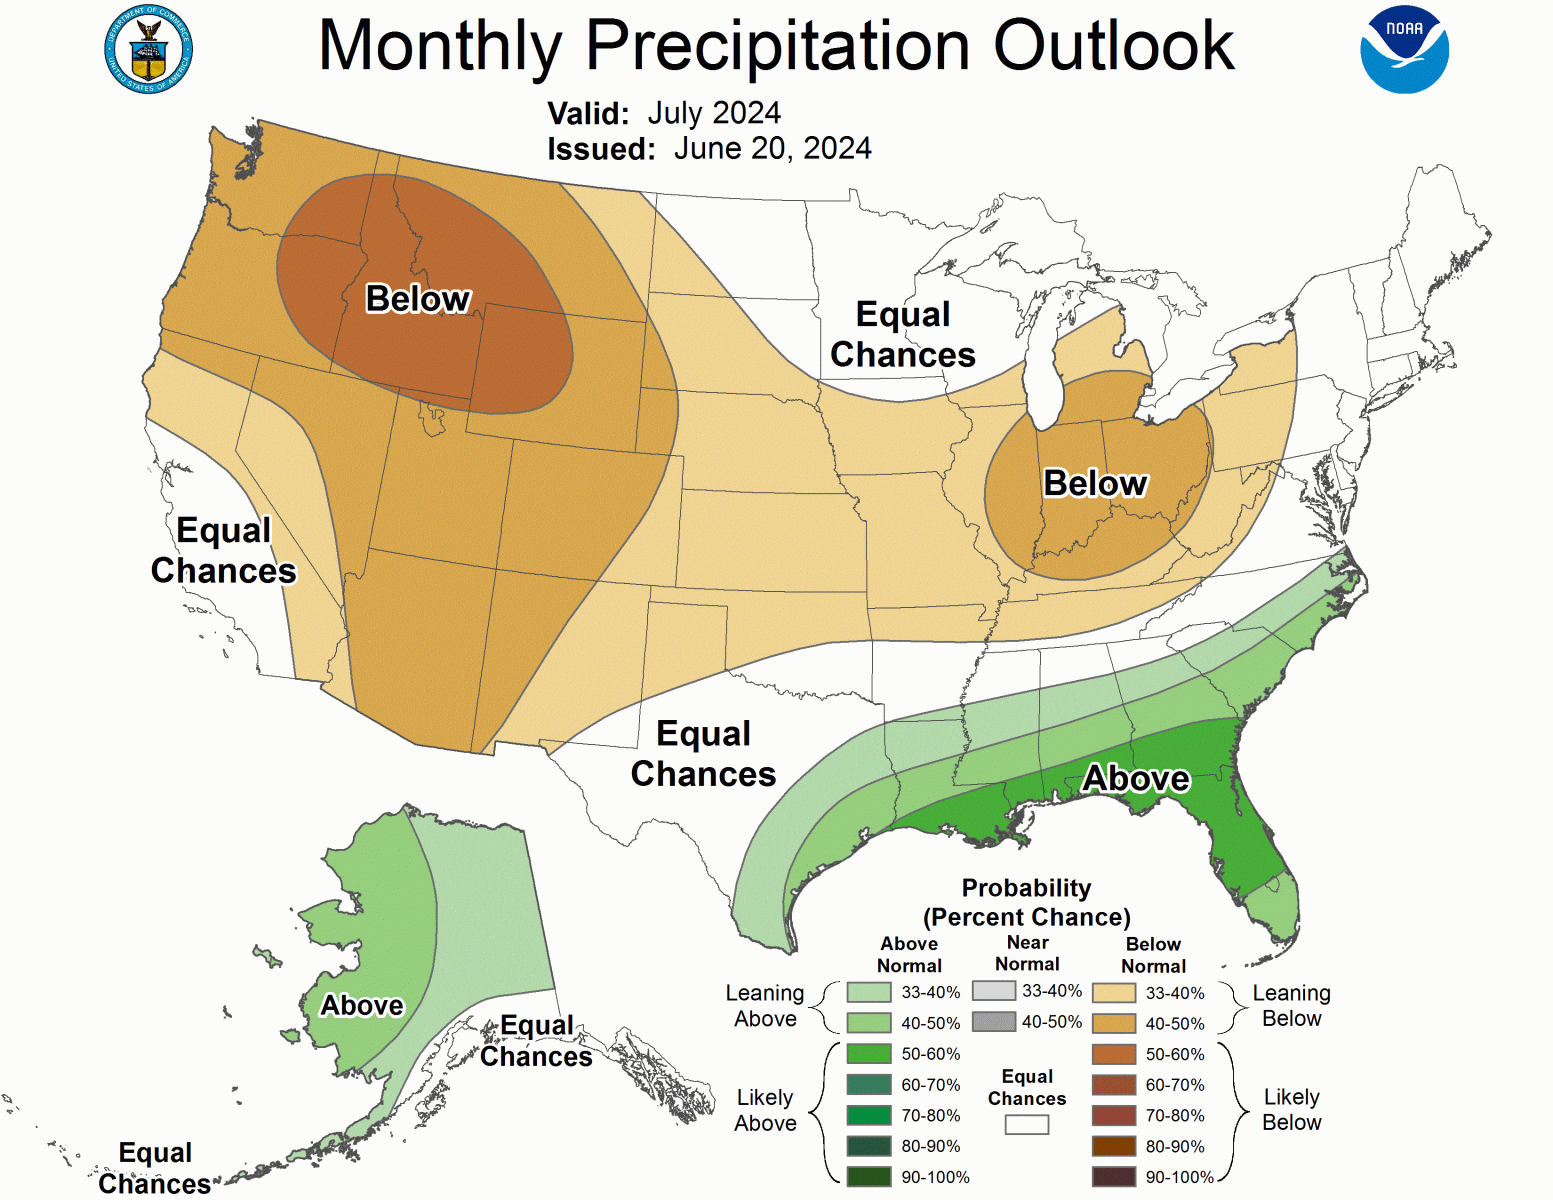
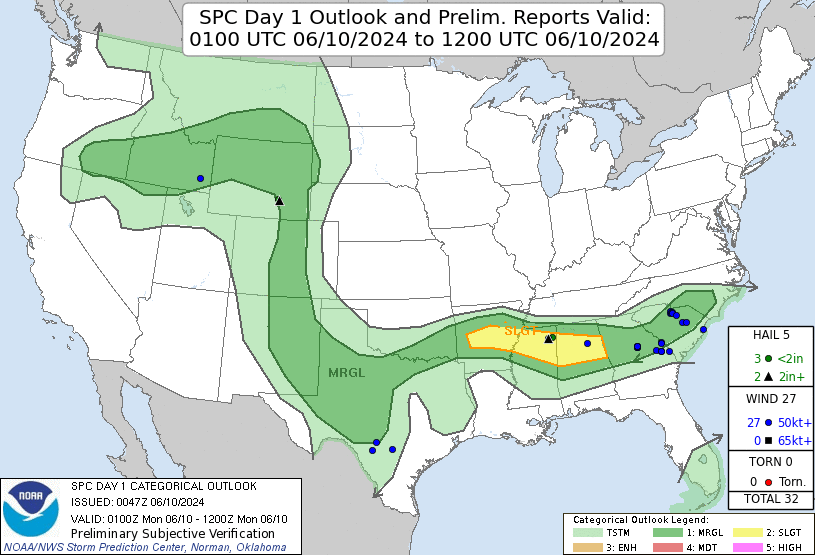
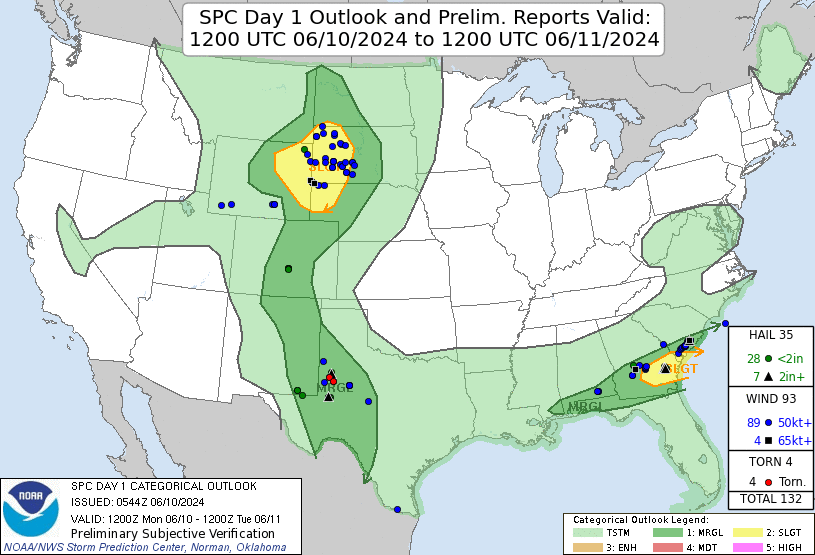
Climate Site Temperatures Precipitation Climate Site Maximum Temperature Max T Date *Indicates a daily record was set Climate Site Total Precipitation DFN (Departure Climate Site Maximum Daily Precip (in inches) Max P Date *Indicates a daily record was set Data prepared by NWS Peachtree City/Atlanta Severe Weather (June 9th and 10th, 2024) A stationary boundary parked over central Georgia was the catalyst for the severe weather March 9th into March 10th. Supercells formed alone this boundary into the evening on March 10th and lapse rates from 7.5-8 C/km aided in the hail probs for the area. Every storm quickly developed 1-1.25 inch hail and one storm that crossed into eastern Georgia had significant hail associated with it. Based on the Climate Prediction Center's outlook for July, north and central Georgia has a 60-70% chances of above normal temperatures. North and central Georgia has a 33% to 50% chance of above normal precipitation. Data prepared by NWS Peachtree City/Atlanta.
Overview
Climate Graphs
Records
Events
July Outlook
Below are the overview stats for June 2024 for our 10 climate sites.
June 2024 Monthly Rankings
Athens
24th Warmest
30th Driest
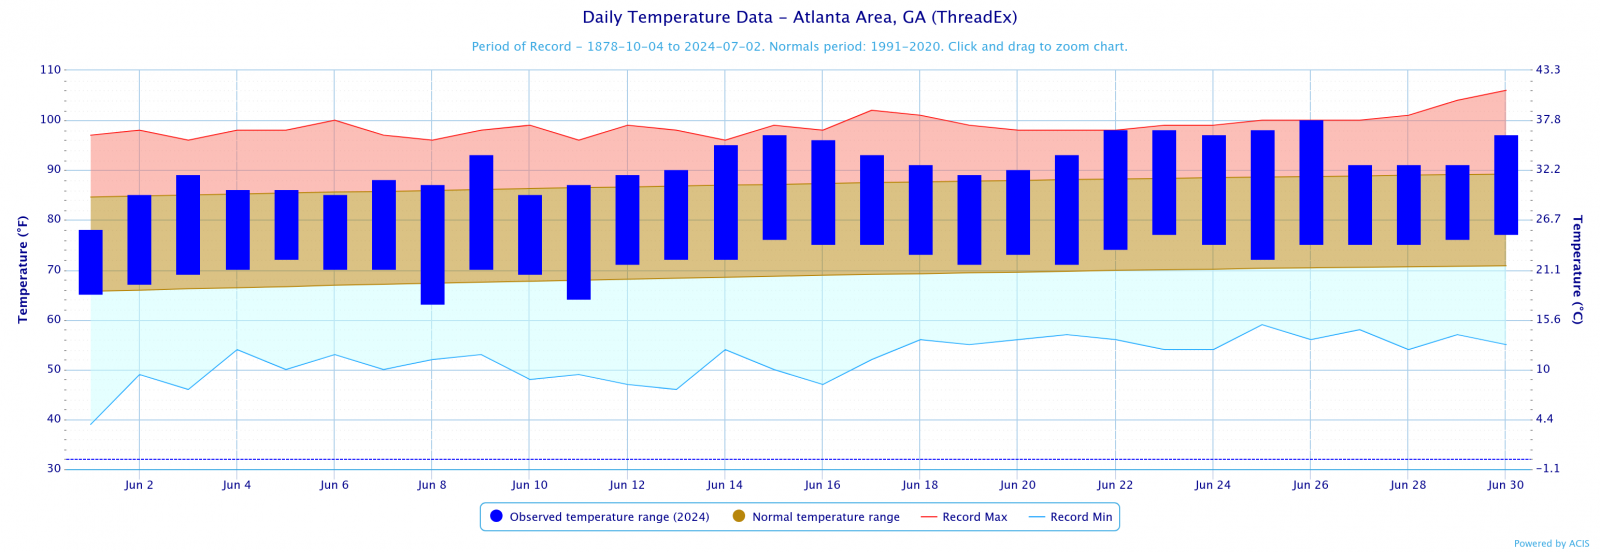
Atlanta
2nd Warmest
23rd Driest
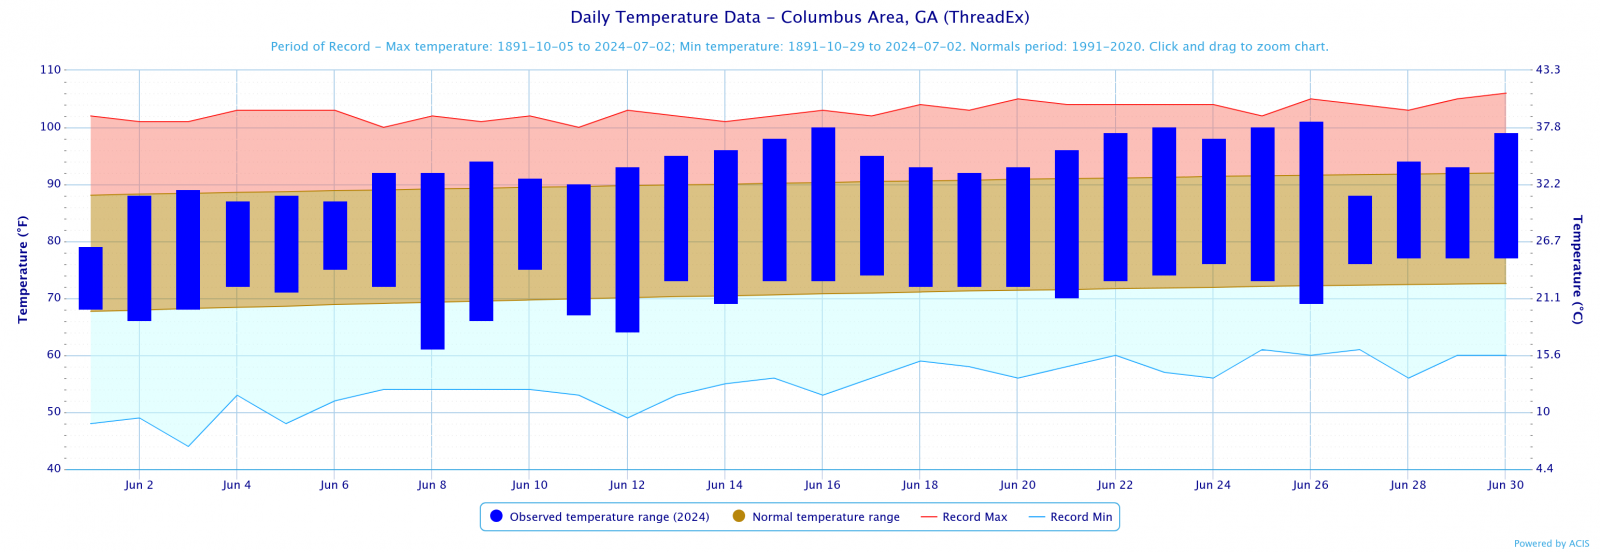
Columbus
18th Warmest
35th Driest
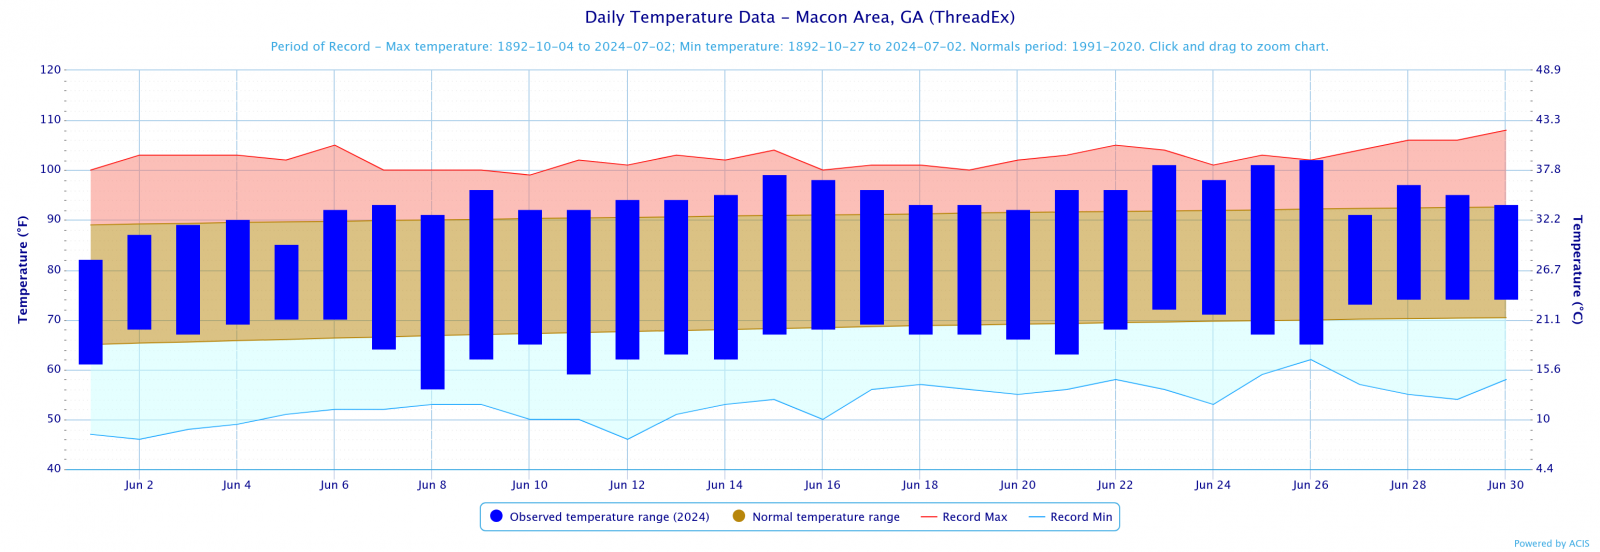
Macon
38th Warmest
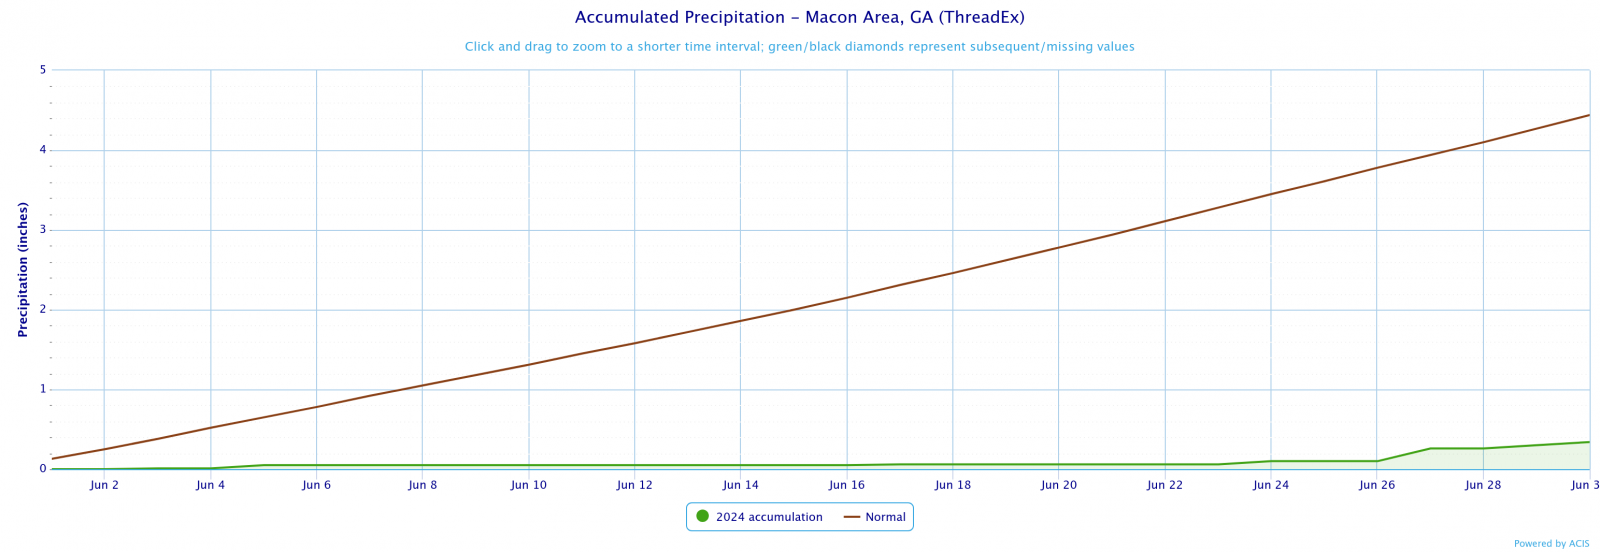
Driest on Record
June 2024 Climate Averages
Climate Site
Month Temp (°F)
Average Temp
Departure from normal
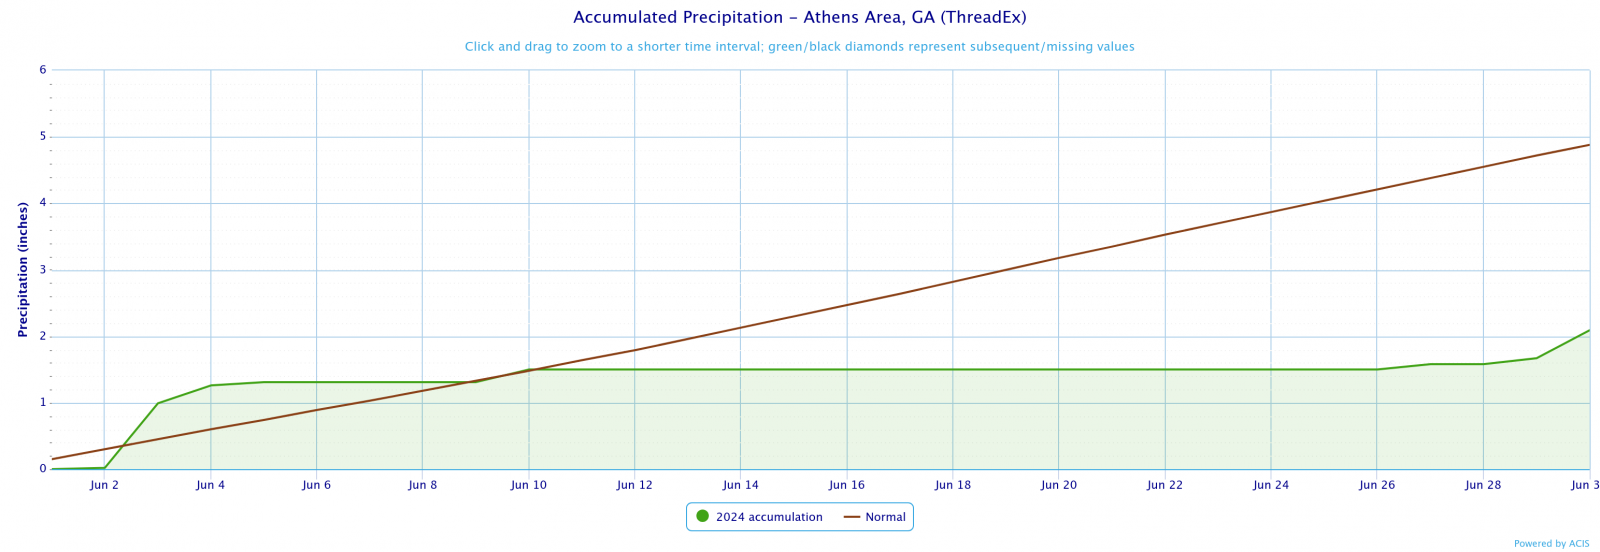
Athens
79.4
77.7
1.7
Atlanta
81.5
78
3.5
Columbus
82.4
80.4
2.0
Macon
80.3
79.5
0.8
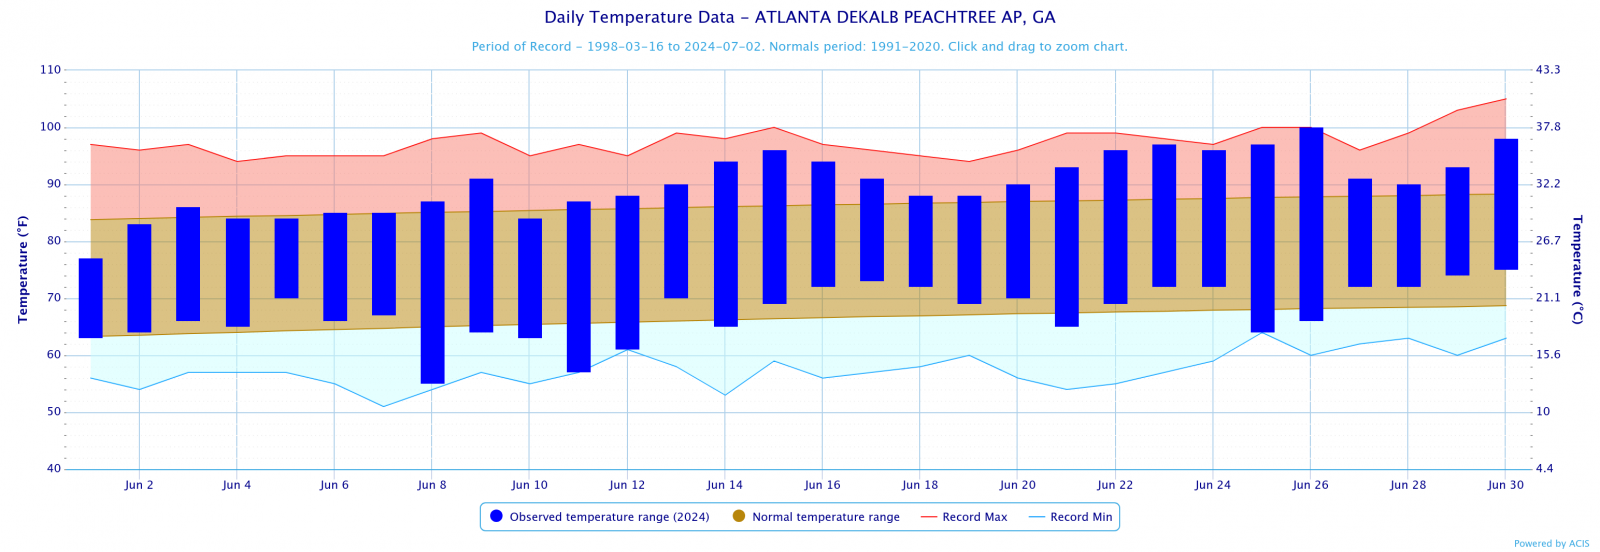
Dekalb Peachtree Arpt
78.8
76.2
2.6
Fulton Co Arpt
79.2
76.9
2.3
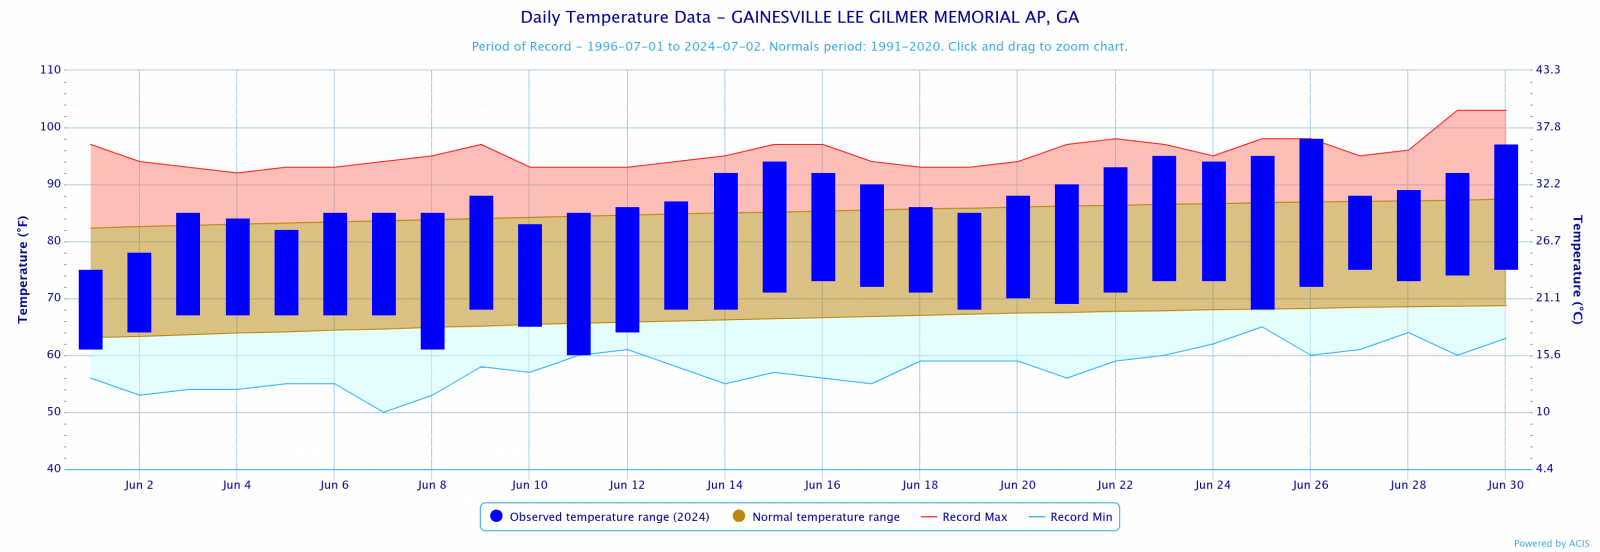
Gainesville
78.5
75.7
2.8
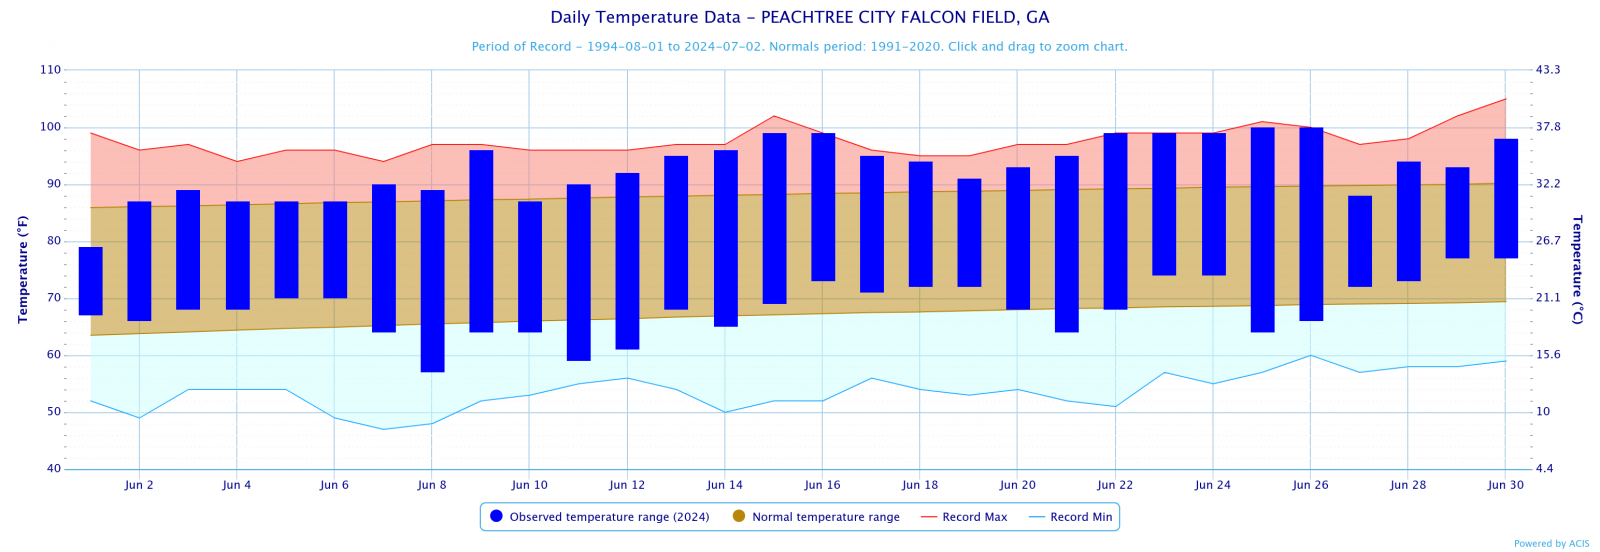
Peachtree City
80.5
77.5
3.0
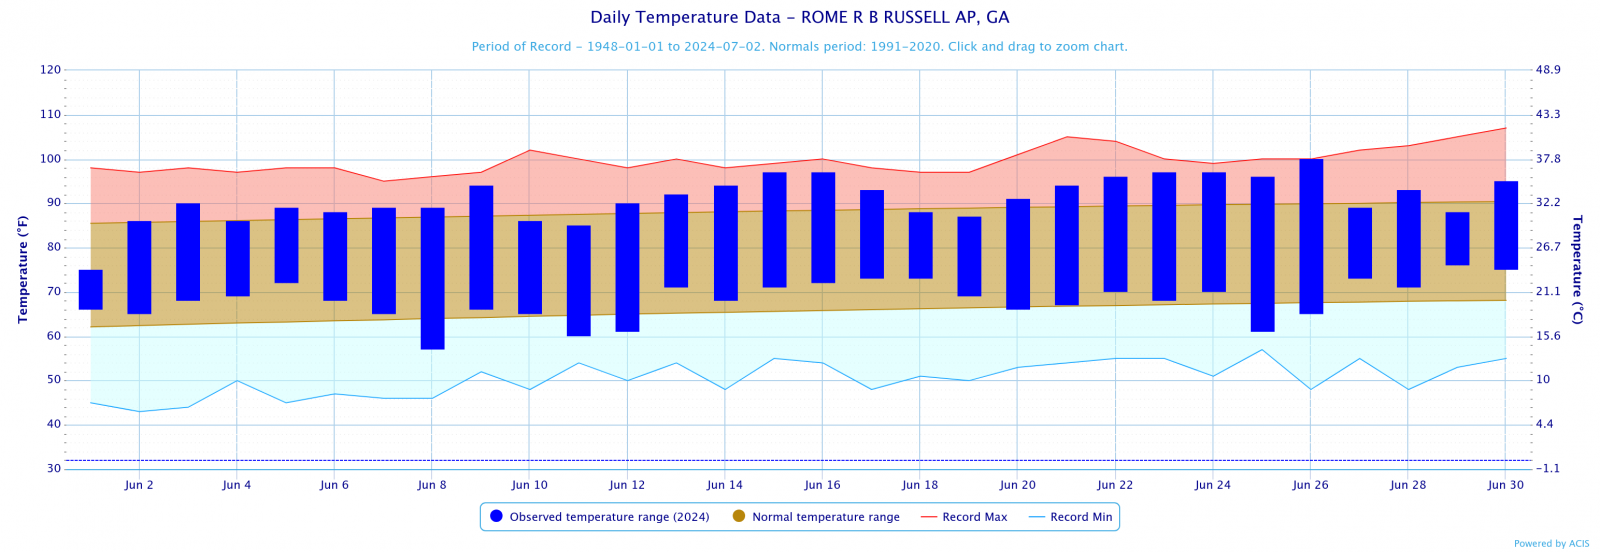
Rome
79.5
77.5
2.0
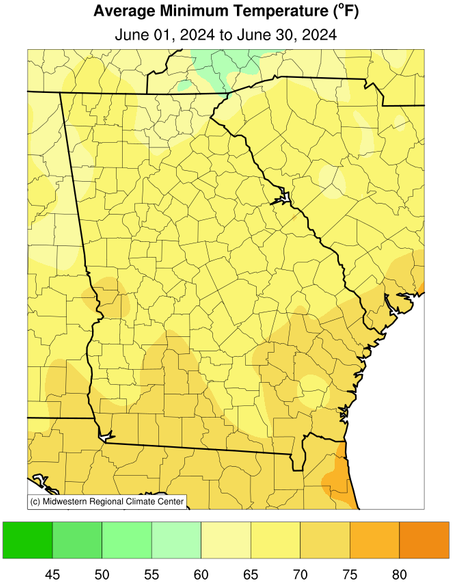
June 2024 Temperature Climate Statistics
Minimum Temperature
Min T Date
Athens
101
6/26
57
6/1
Atlanta
100*
6/26
63
6/8
Columbus
101
6/26
61
6/8
Macon
102*
6/26
56
6/8
Dekalb Peachtree Arpt
100
6/26
55
6/8
Fulton Co Arpt
99
6/26
55
6/8
Gainesville
98
6/26
60
6/11
Peachtree City
100
6/25,26
57
6/8
Rome
100
6/26
57
6/8
June 2024 Precipitation Climate Statistics
Average Precipitation
From Normal)
Athens
2.09
4.88
-2.79
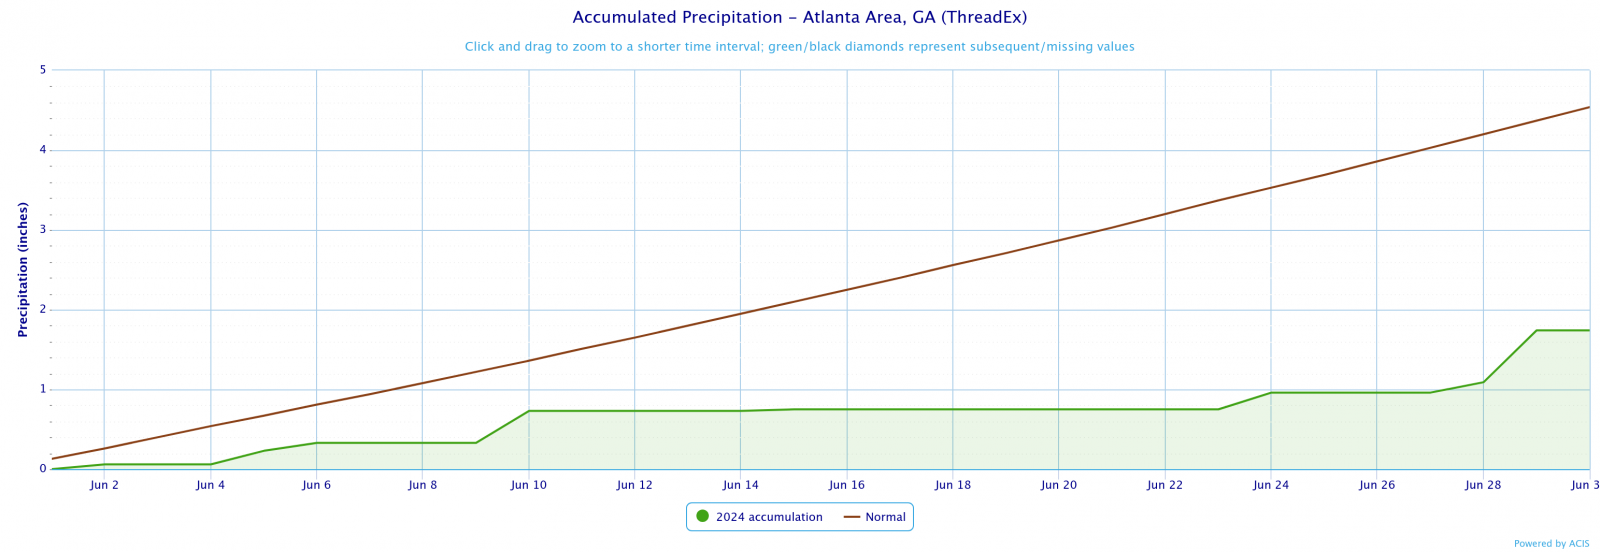
Atlanta
1.74
4.54
-2.80
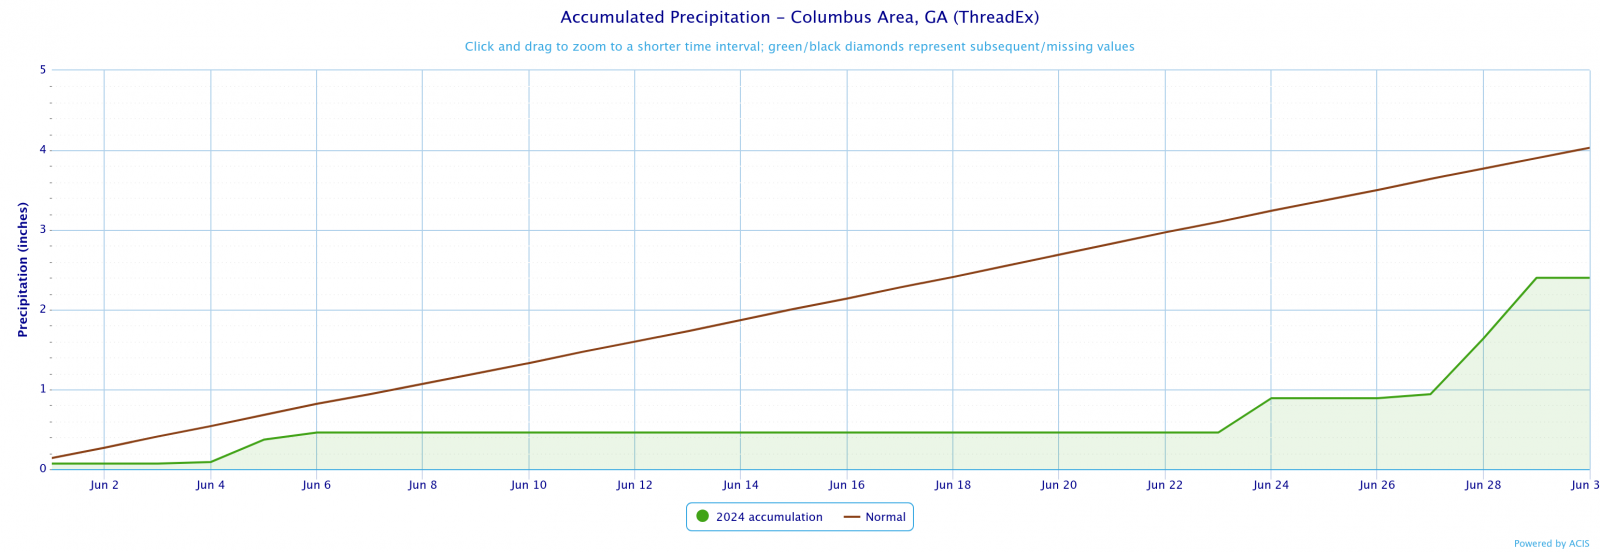
Columbus
2.40
4.03
-1.63
Macon
0.34
4.44
-4.10
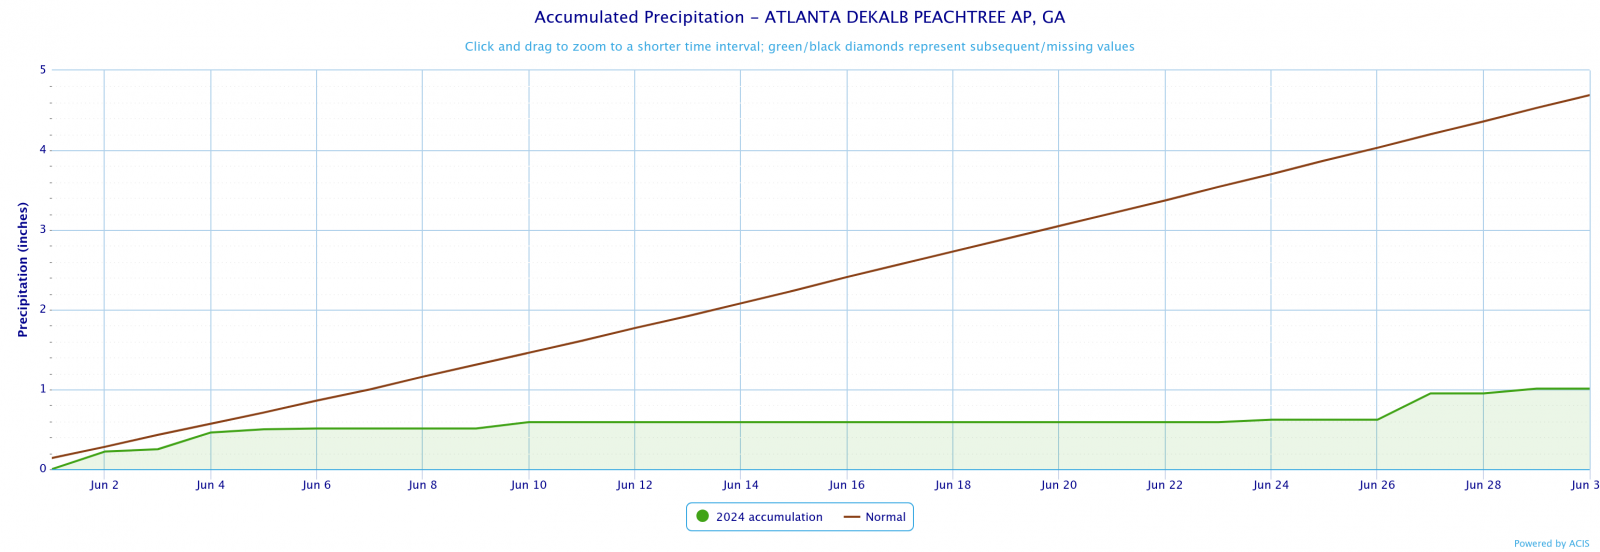
Dekalb Peachtree Arpt
1.01
4.69
-3.68
Fulton County Arpt
0.48
3.84
-3.36
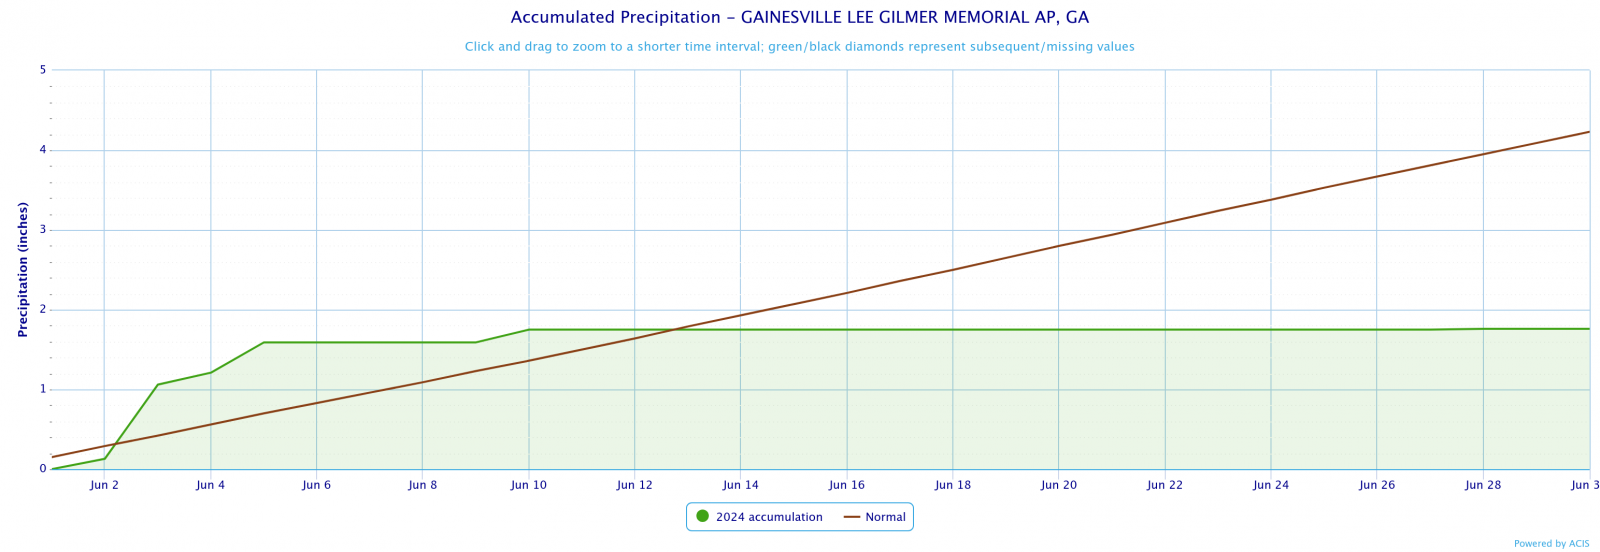
Gainesville
1.76
4.23
-2.47
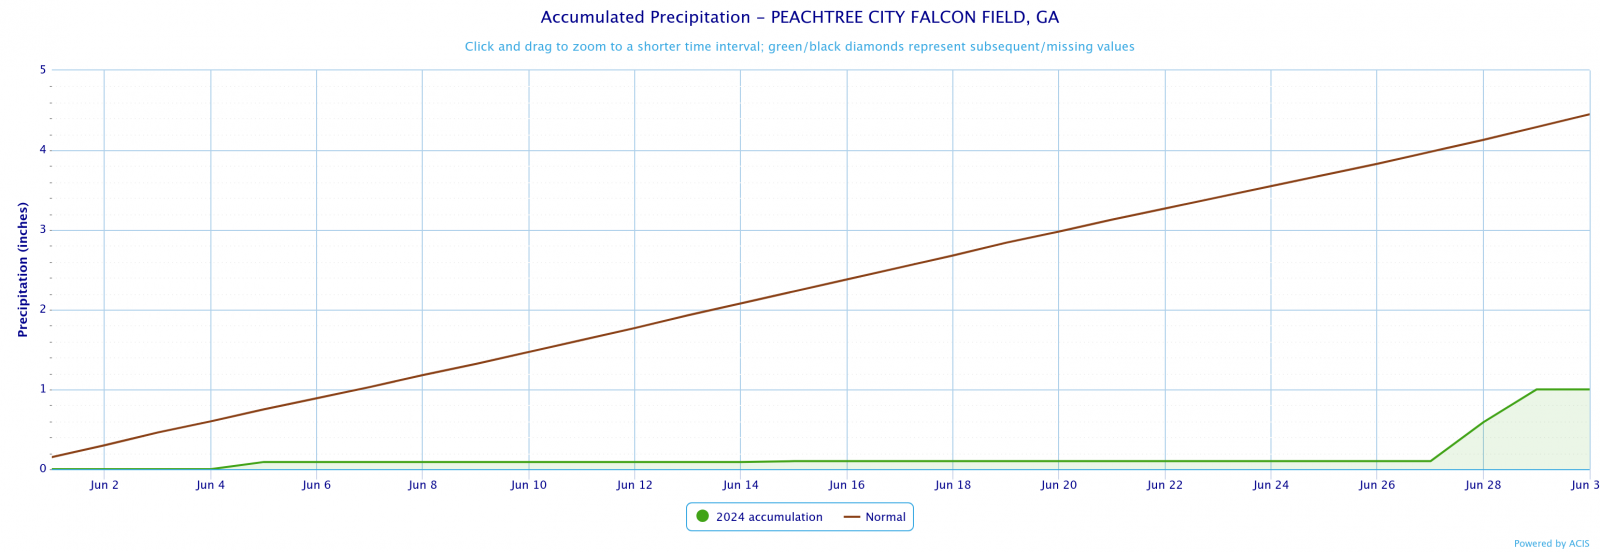
Peachtree City
1.00
4.45
-3.45
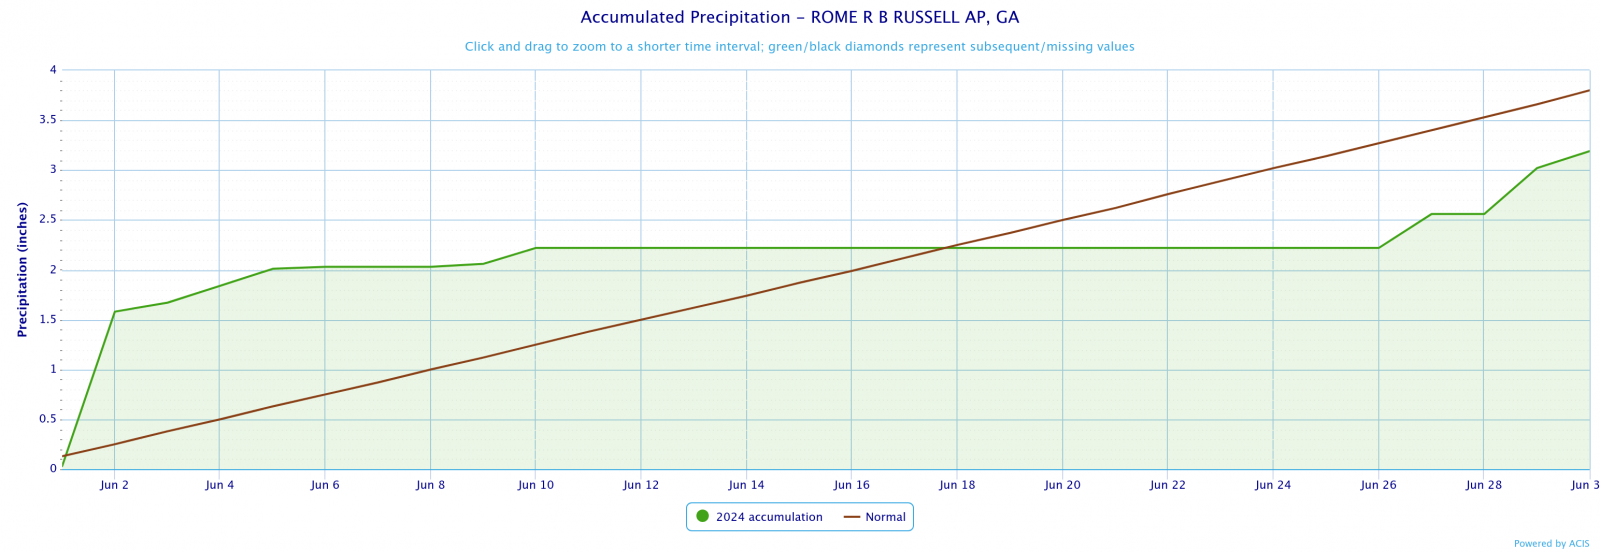
Rome
3.19
3.8
-0.61
June 2024 Precipitation Climate Statistics
Athens
0.97
6/3
Atlanta
0.78
6/28
Columbus
1.46
6/28
Macon
0.16
6/27
Dekalb Peachtree Arpt
0.33
6/27
Fulton Co Arpt
0.22
6/28
Gainesville
1.08
6/3
Peachtree City
0.90
6/28
Rome
1.55
6/2
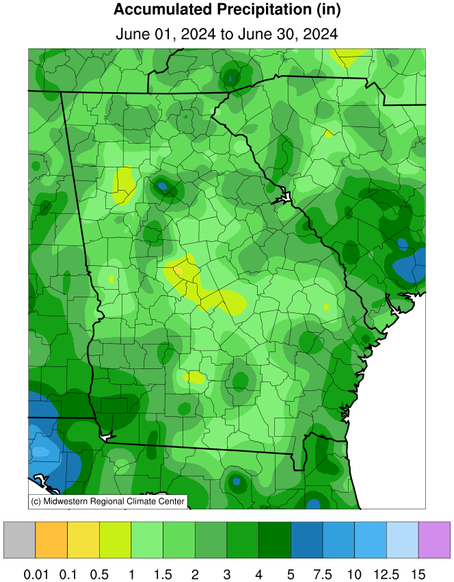
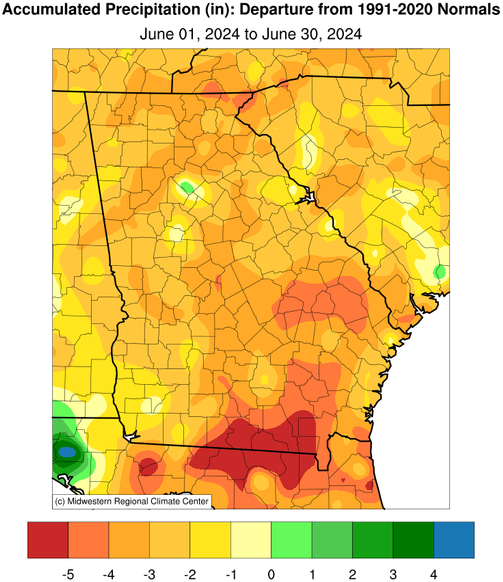
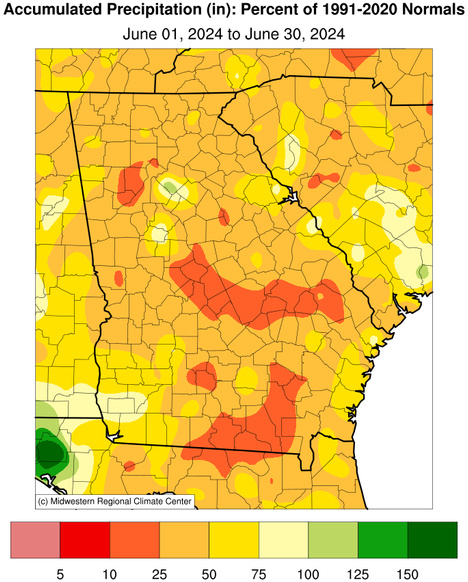
Click the links below to explore the temperature and precipitation data across north and central Georgia for the month of June 2024.
Temperature Maps
Precipitation Maps
Temperature Graphs
Precipitation Graphs
Temperature and precipitation records at our 4 main climate sites are located below.
June 2024 Climate Records
Date
Type
Location
Records set over a 24 hour period
6/26
Max Temp
Atlanta
A max temp of 100 occurred on 6/26 which tied the old record of 100 from 1914.
6/26
Max Temp
Macon
A max temp of 102 occurred on 6/26 which tied the old record of 102 from 1950.
Larger events that occurred across north and central Georgia this past June can be found here.
The July climate outlook is below.
July Outlook