| Previous Month | Next Month |
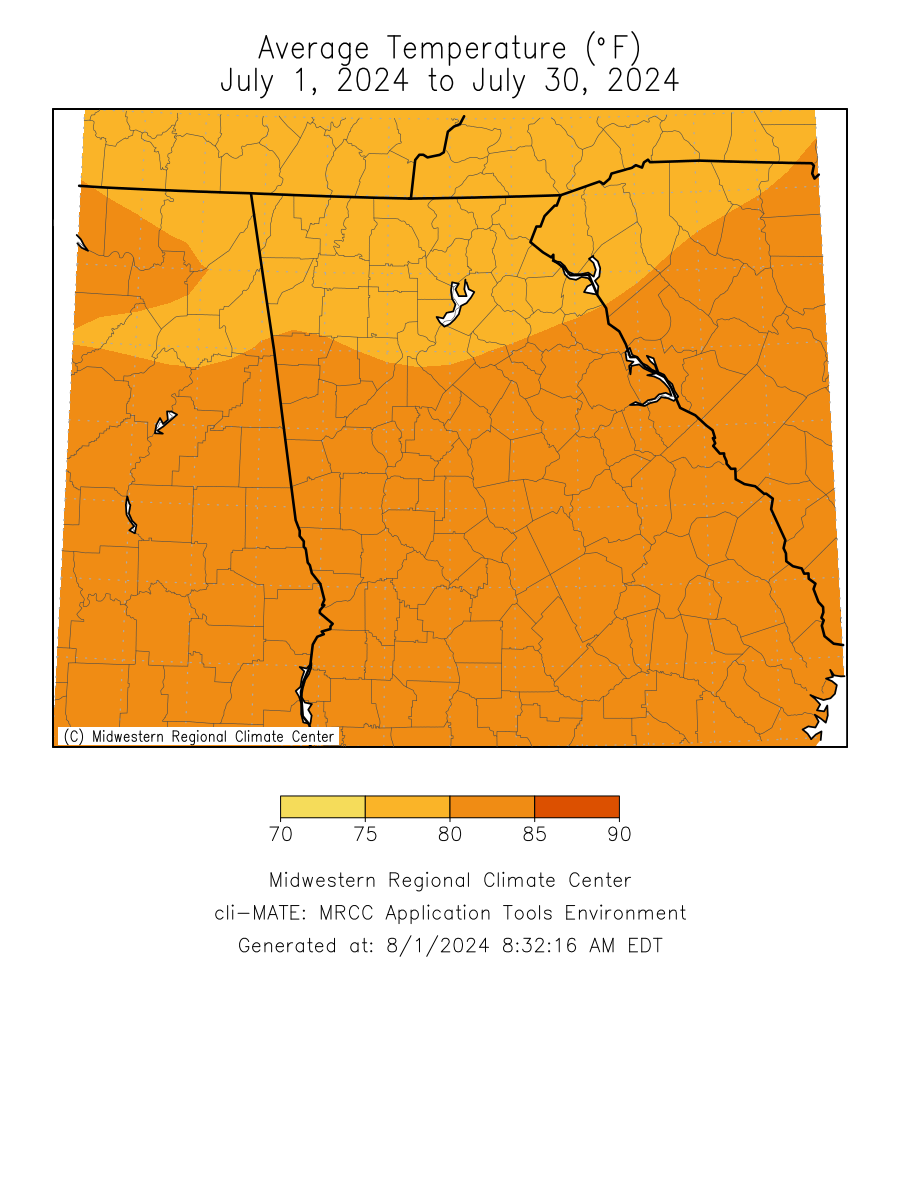
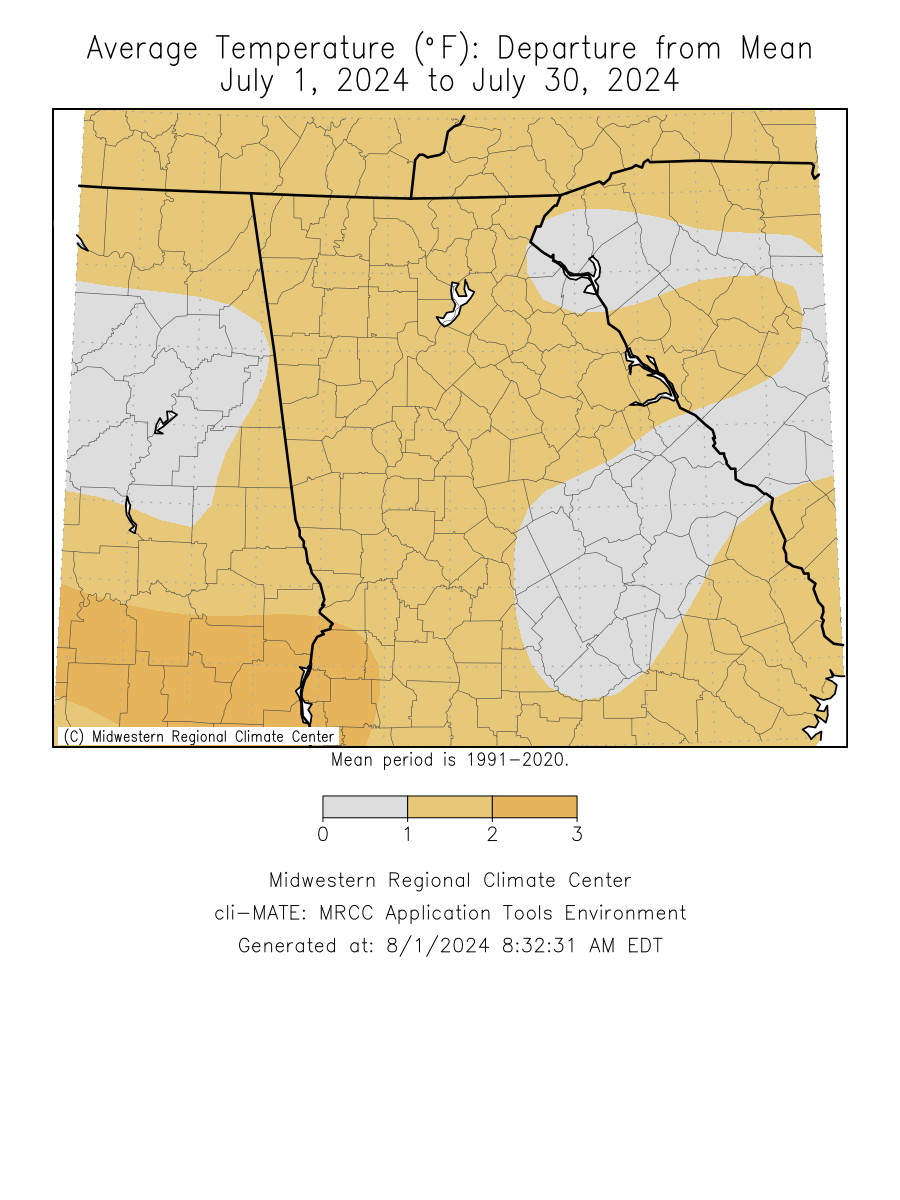
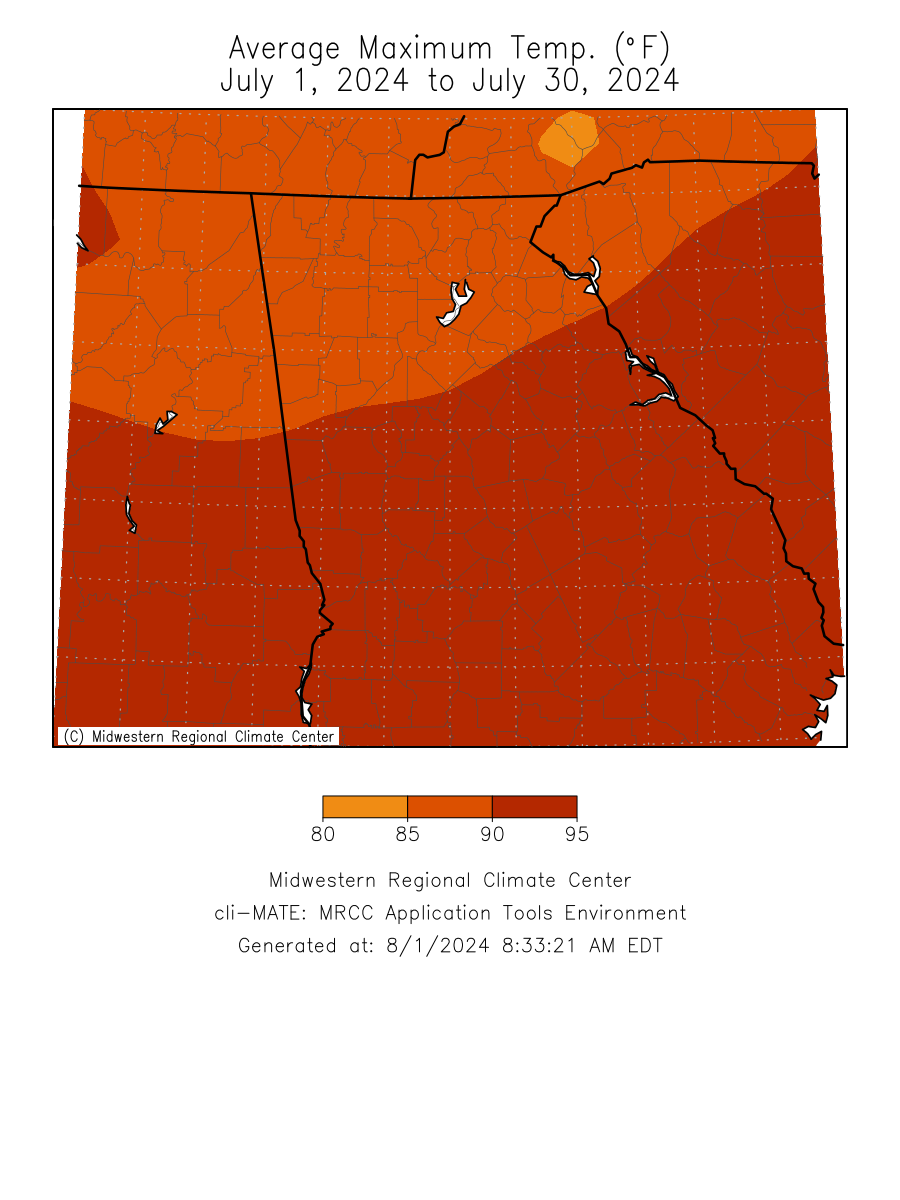
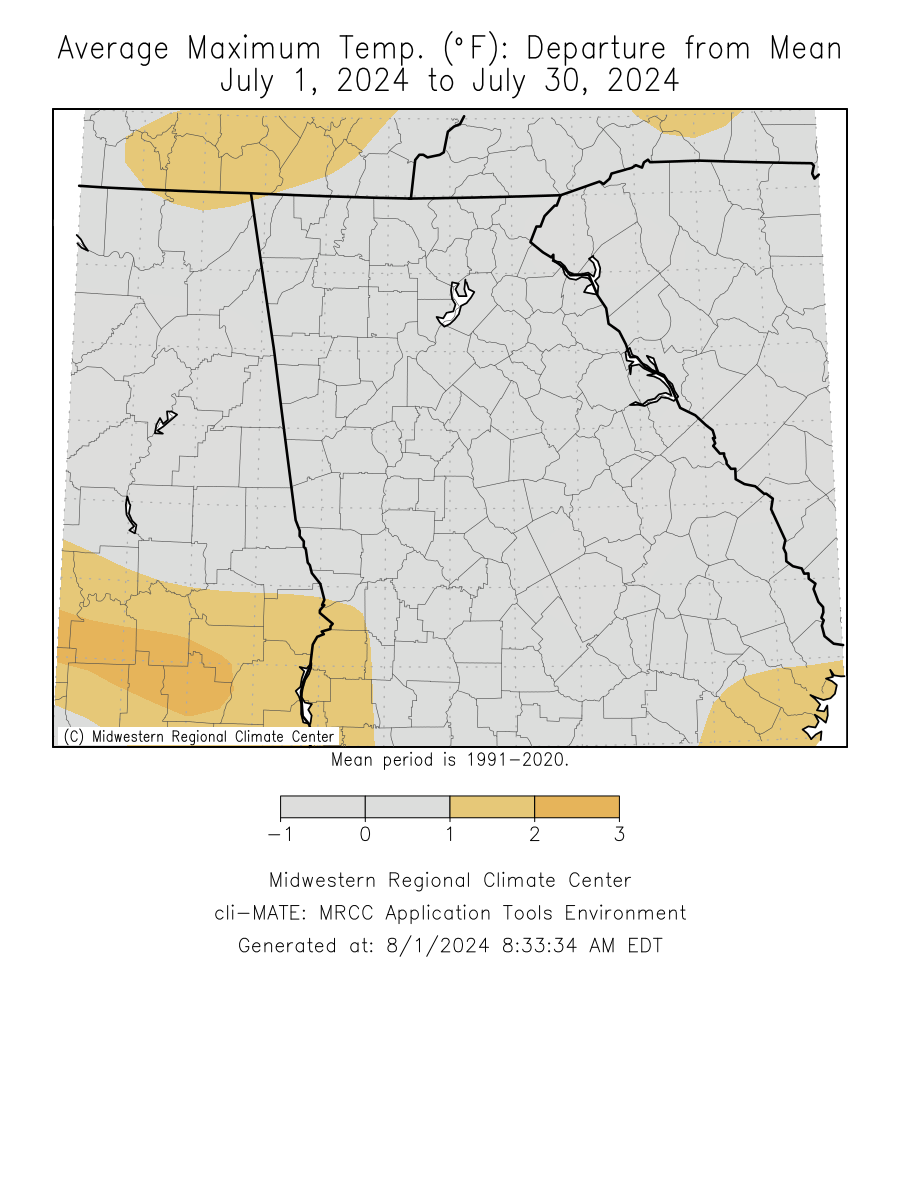
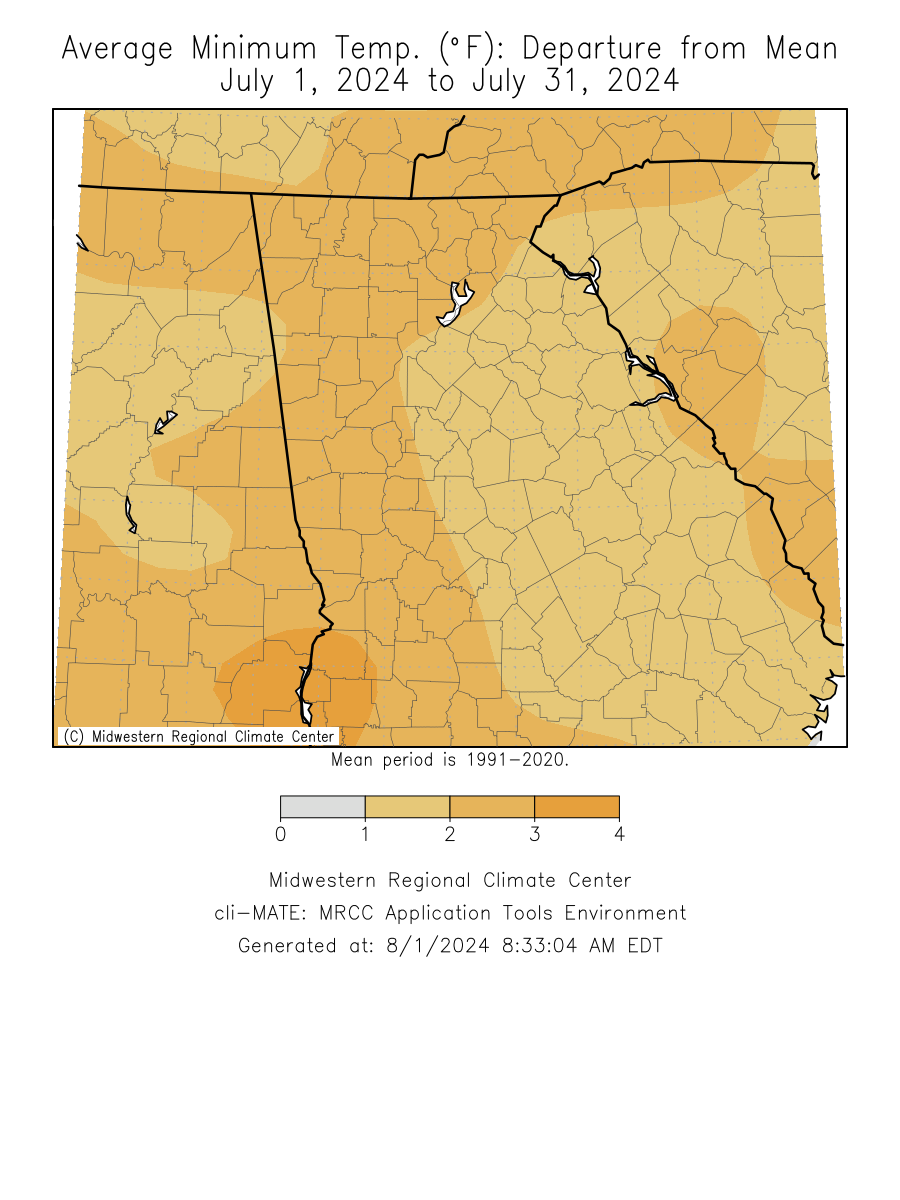
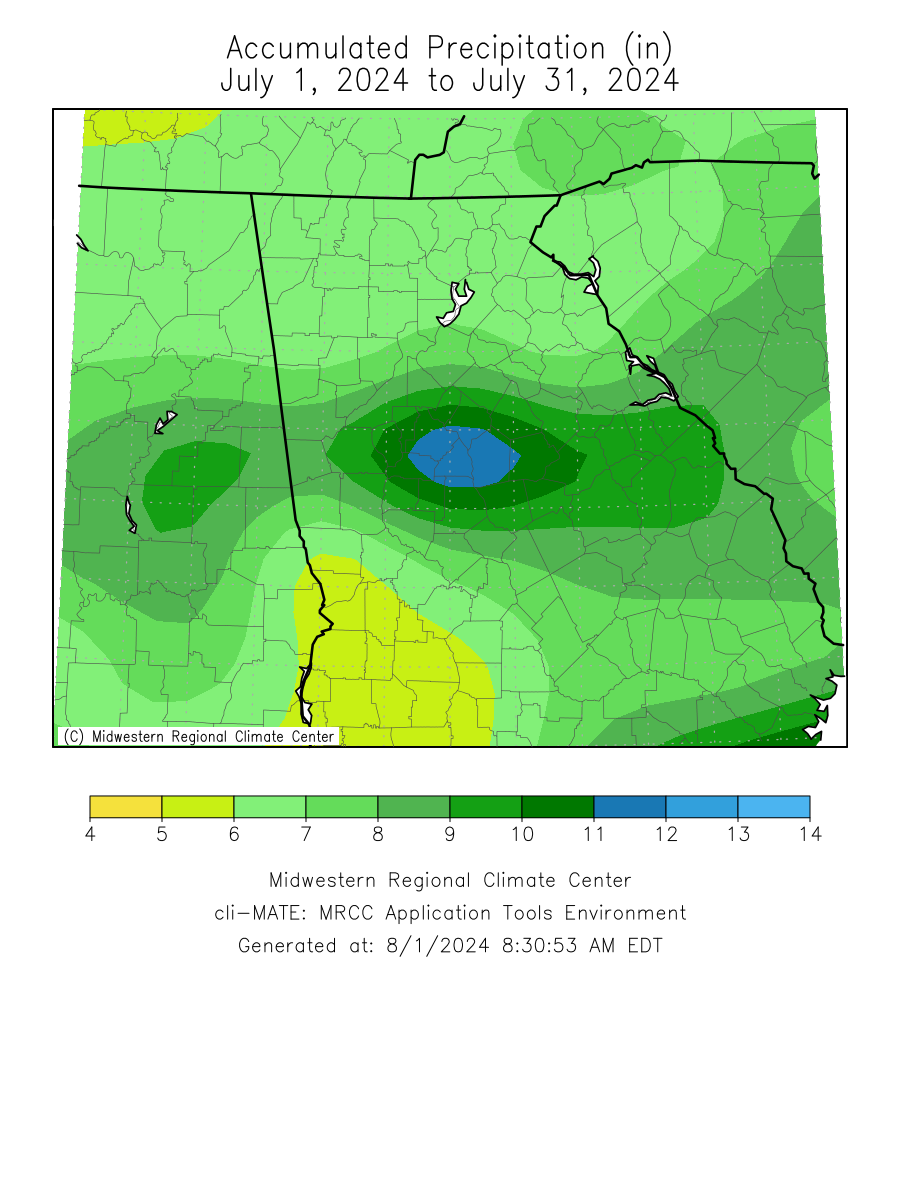
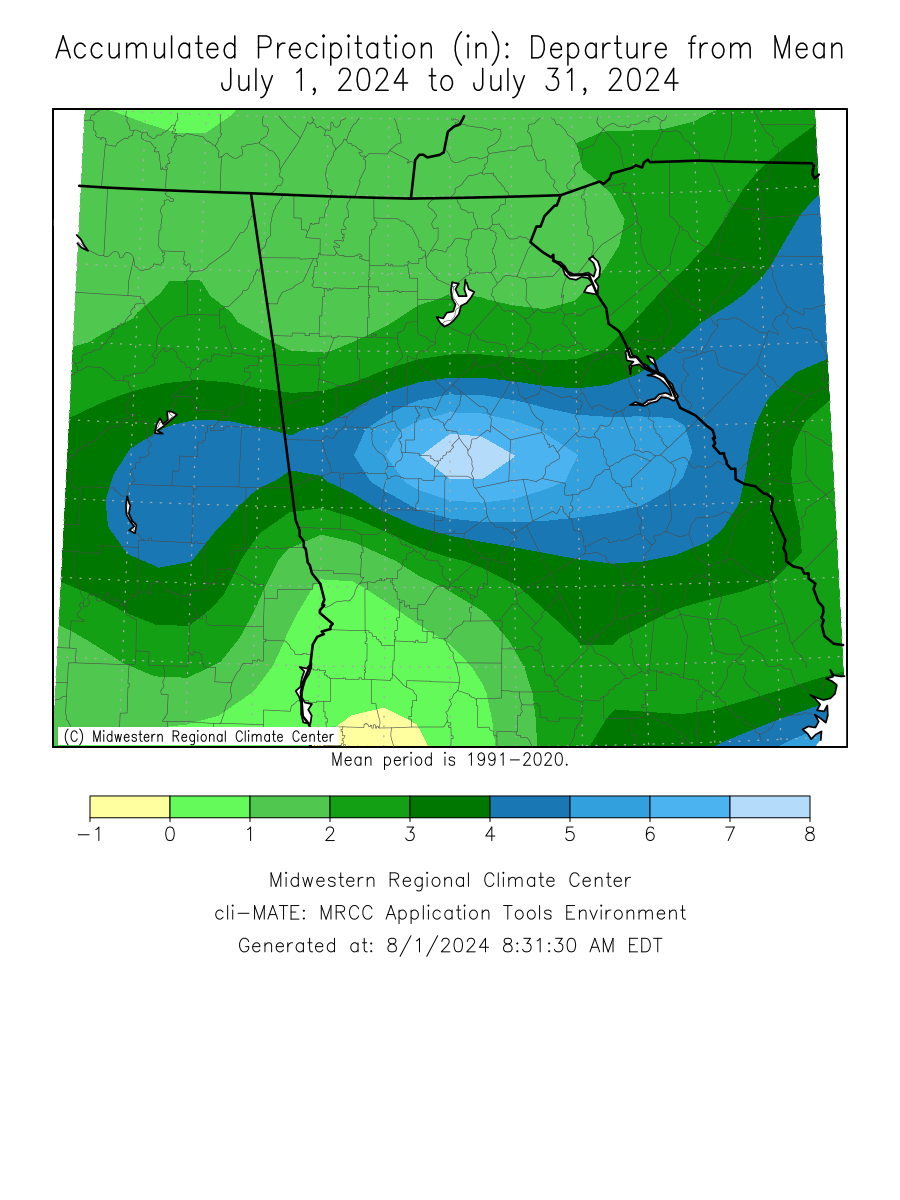
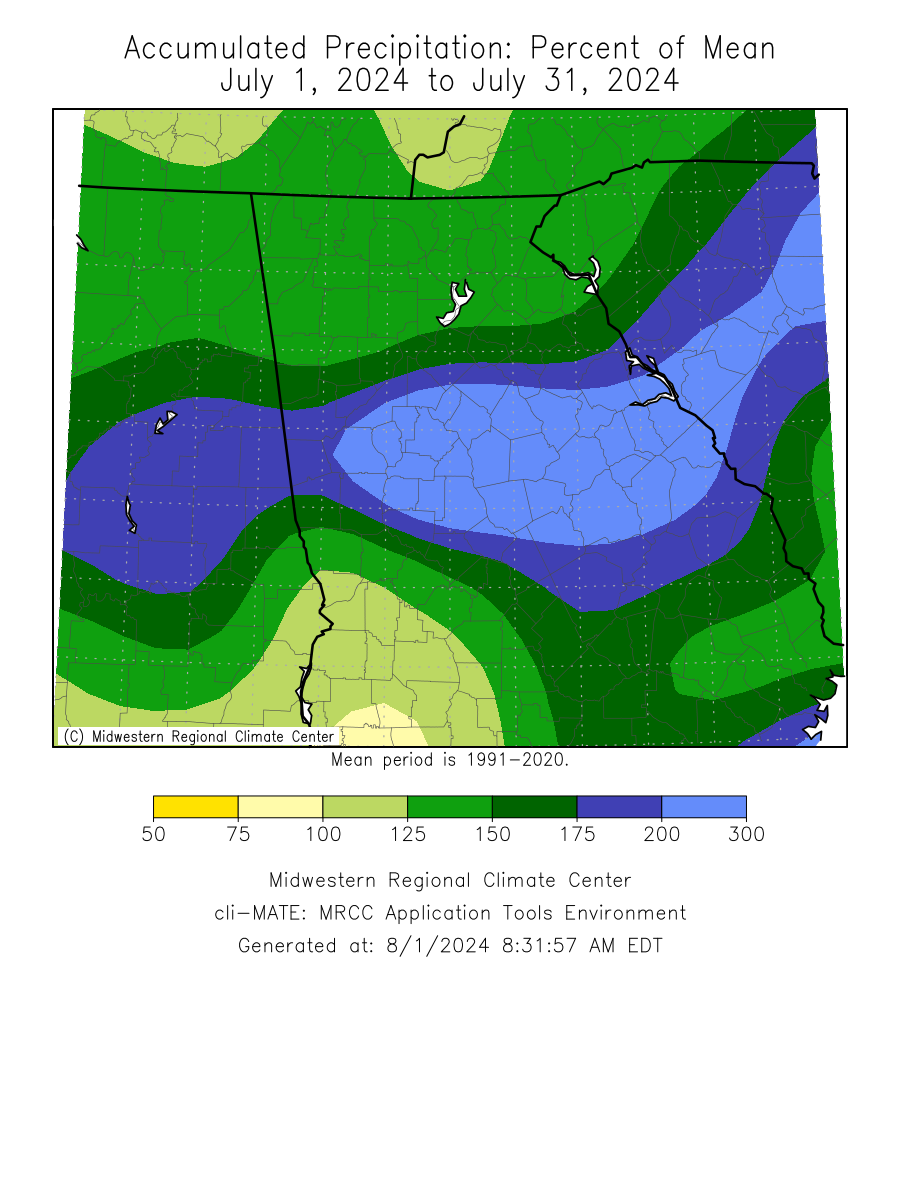
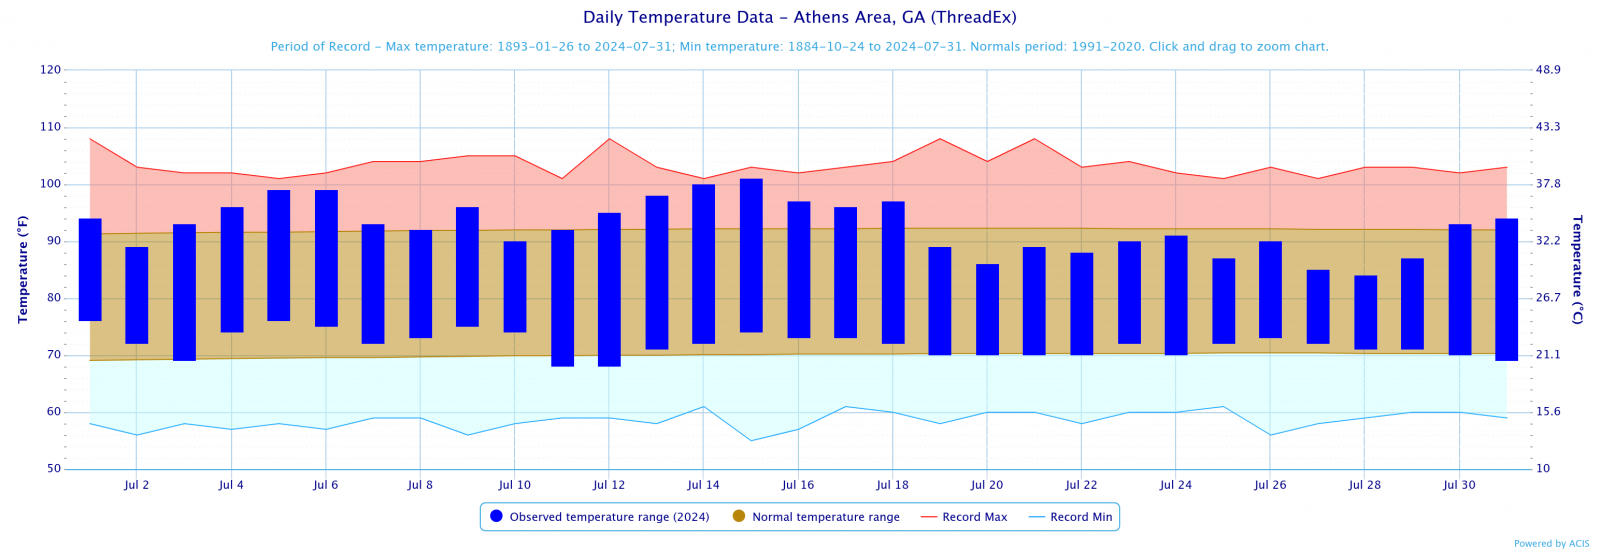
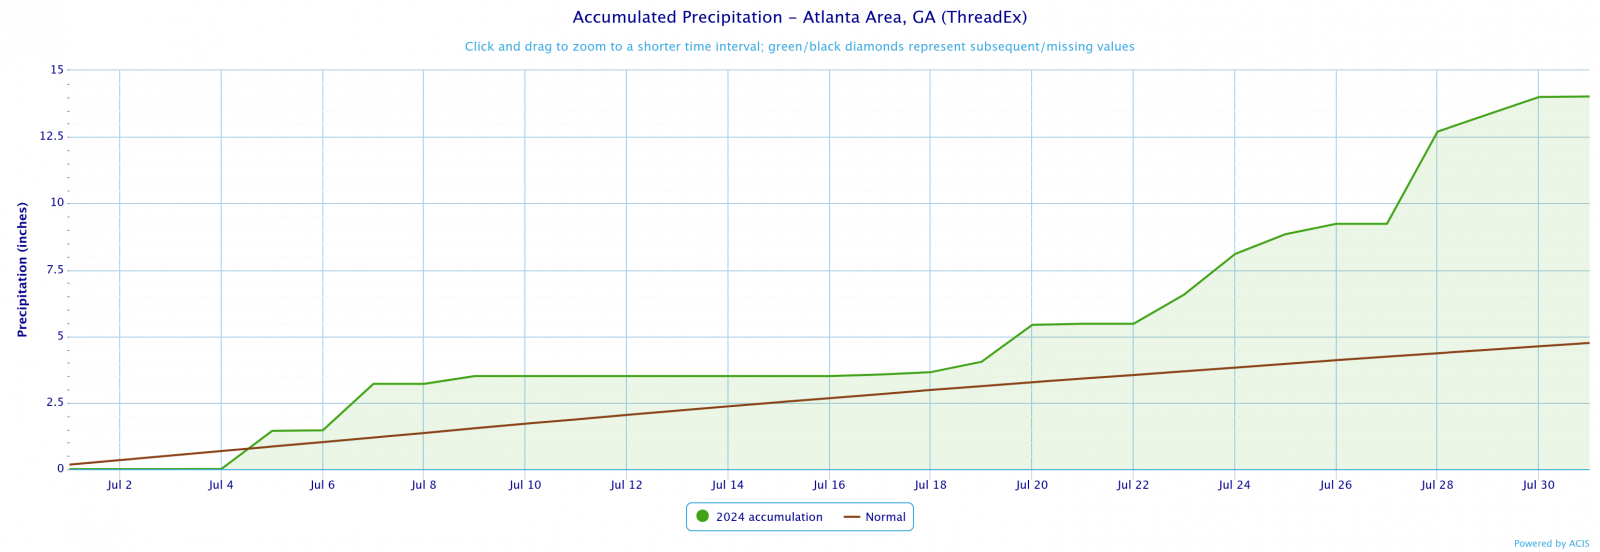
Temperatures through the month of July were around a degree above normal. Precipitation through the month of July was around three inches above normal.
Climate Site Temperatures Precipitation Climate Site Maximum Temperature Max T Date Climate Site Total Precipitation DFN (Departure Climate Site Maximum Daily Precip (in inches) Max P Date *Indicates a daily record was set Data prepared by NWS Peachtree City/Atlanta Severe Weather (July 18th): Thunderstorm activity gradually increased through the afternoon as the day's high temperature was reached. Precipitable Water values were over two inches and in the 9th percentile for the region. Wind shear values of 20kts allow for some development of convective updrafts and upon collapse, a few of these storms produced downburst that cause severe wind damage. While these storms never fully organized, a few clusters came together to form some bowing segments which resulted in clusters of reports or wind damage. Severe Weather Outbreak (July 30th-31st): Northwest flow and a long track thunderstorm cluster from the lower Great Lakes region caused widespread wind damage across areas of north and central Georgia. Primarily NW of the Atlanta metro area. The system was favored with 25-30kts of effective shear and an environment with 2000+ J/kg of SBCAPE which allowed for multiple gusts of 40+ kts. Thunderstorms continued into the overnight hours, although the line had mostly broken apart as it moved south of I-20. As the day heated up, the lingering boundary that the previous nights storm had ridden was the source of the axis of the afternoon's convection. Day time highs in the upper 90's and dewpoints in the 70's resulted in plenty of potential energy for scattered thunderstorms to work with. Isolated wind gusts exceeding 40 kts caused scattered wind damage across central Georgia. Based on the Climate Prediction Center's outlook for August, north and central Georgia has a 50-70% chances of above normal temperatures. South and central Georgia has a 33% to 50% chance of above normal precipitation. Data prepared by NWS Peachtree City/Atlanta.
Overview
Climate Graphics
Records
Events
August Outlook
Below are the overview stats for July 2024 for our 10 climate sites.
July 2024 Monthly Rankings
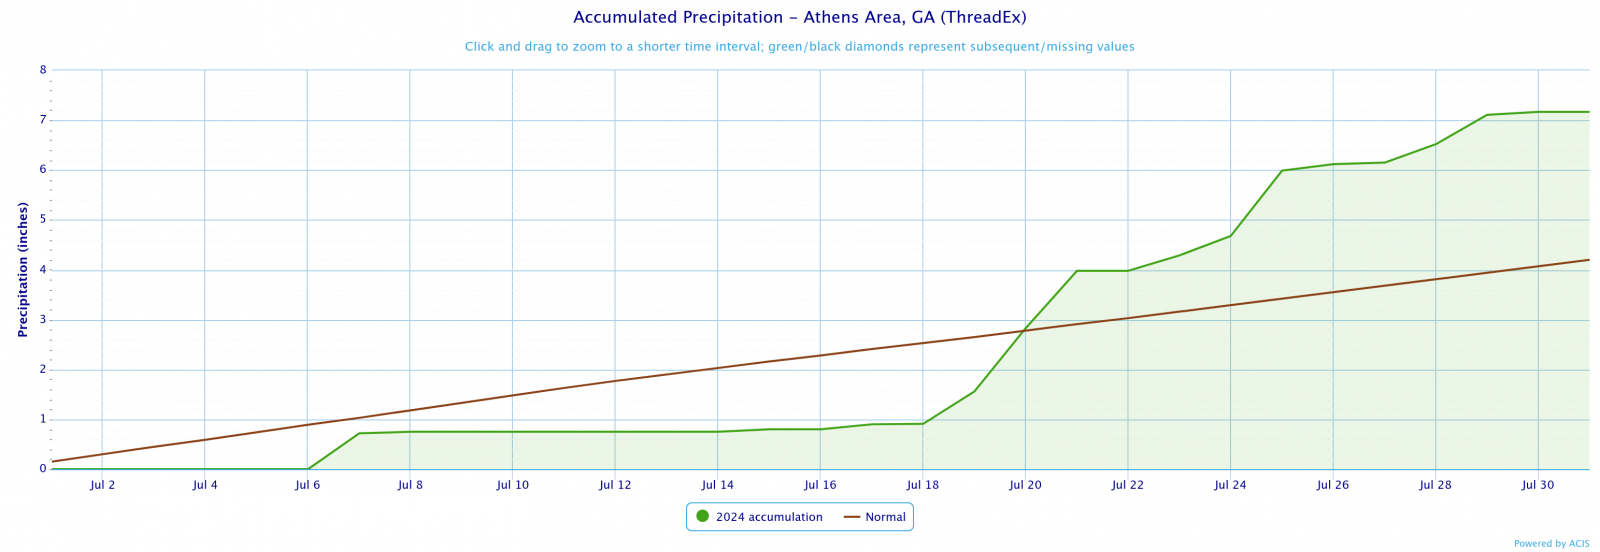
Athens
18thWarmest
27th Wettest
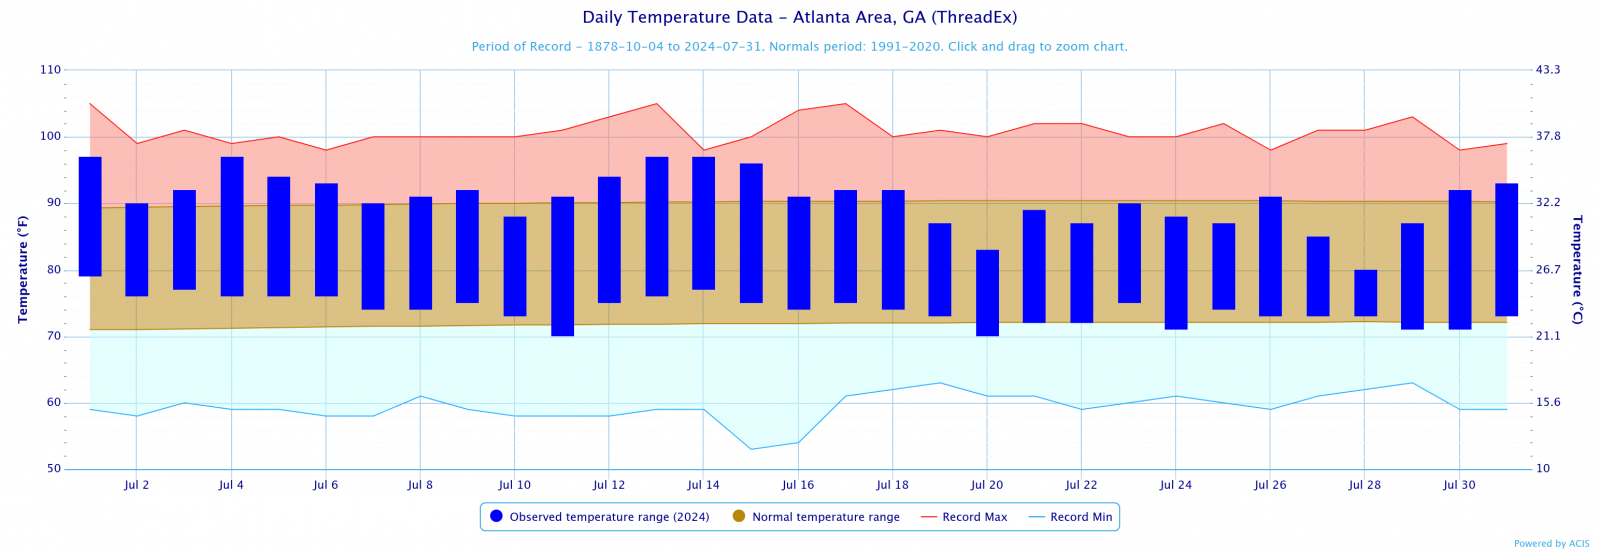
Atlanta
8th Warmest
4th Wettest
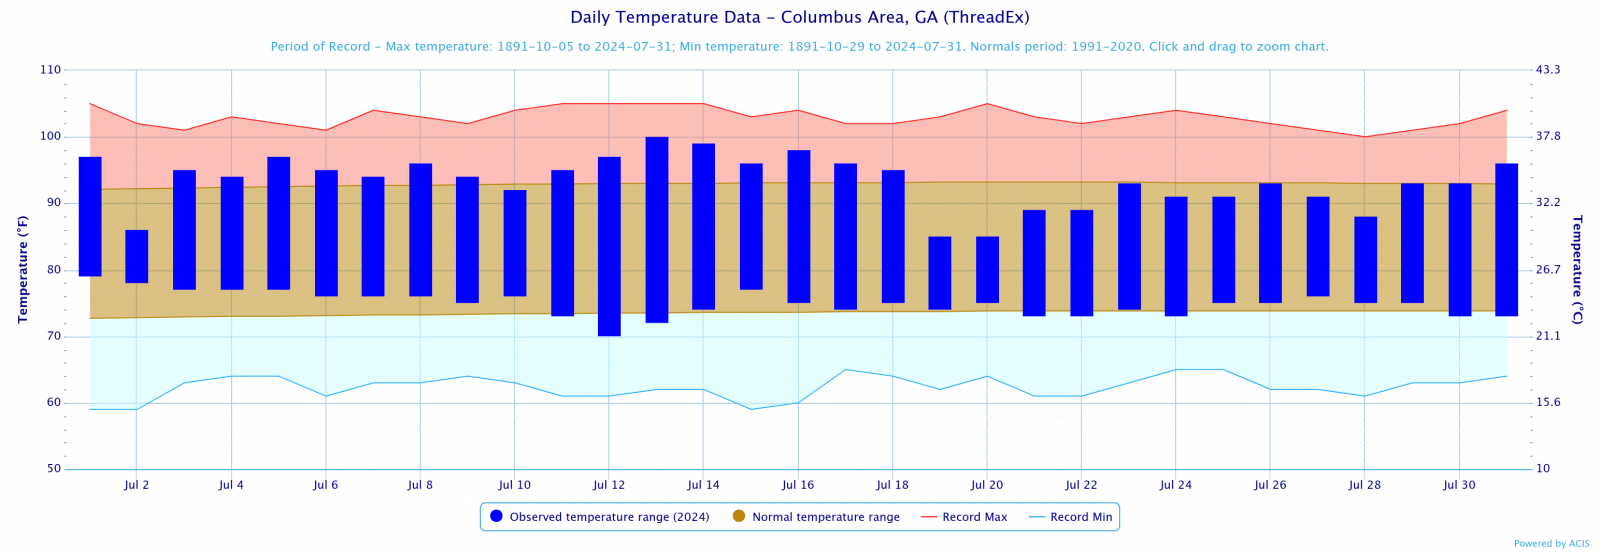
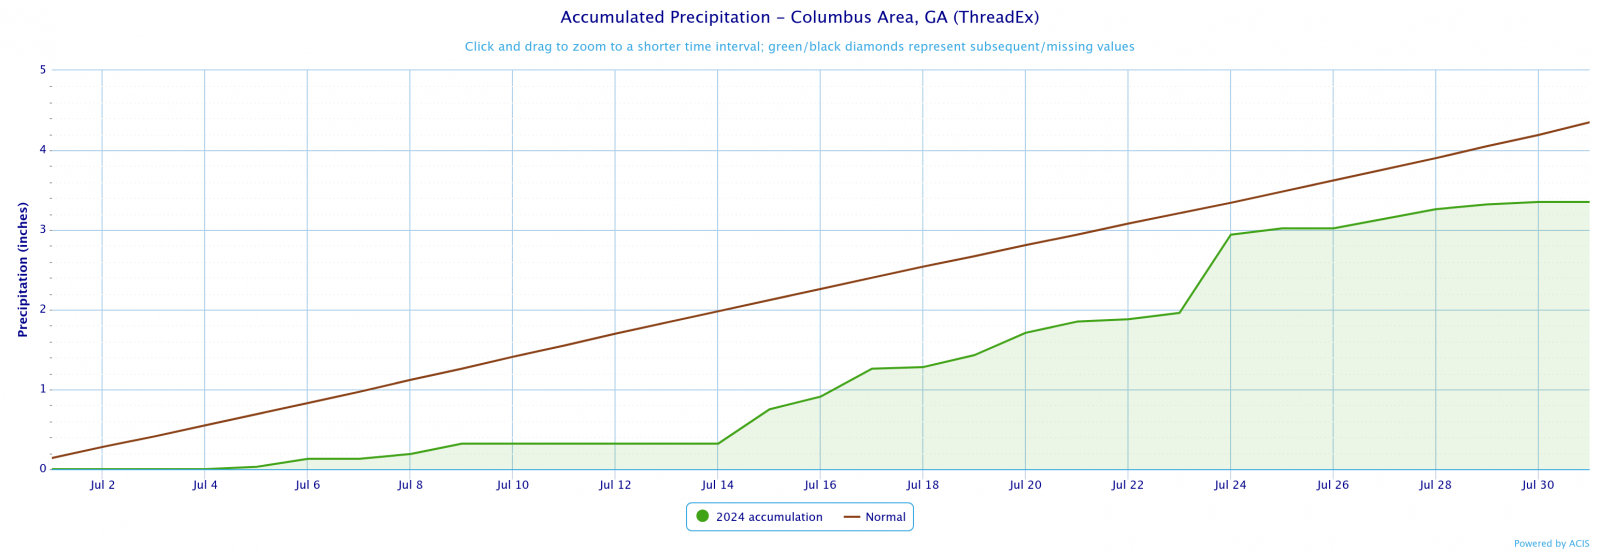
Columbus
16th Warmest
28th Driest
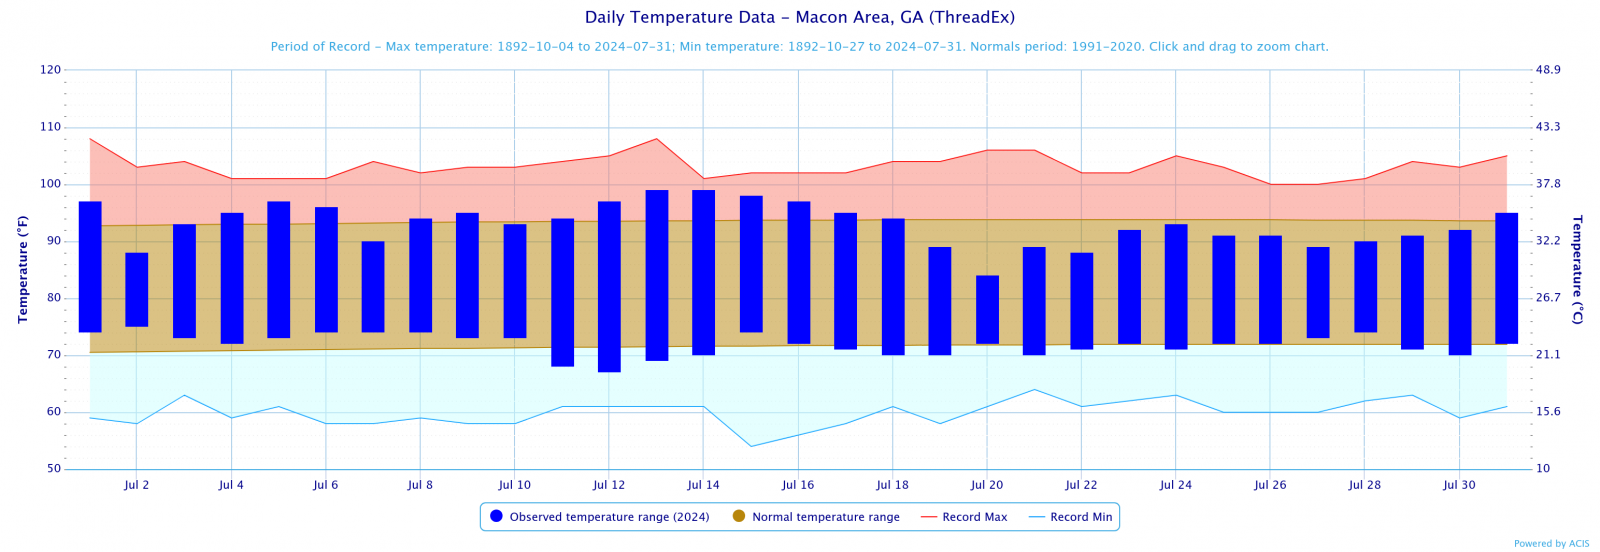
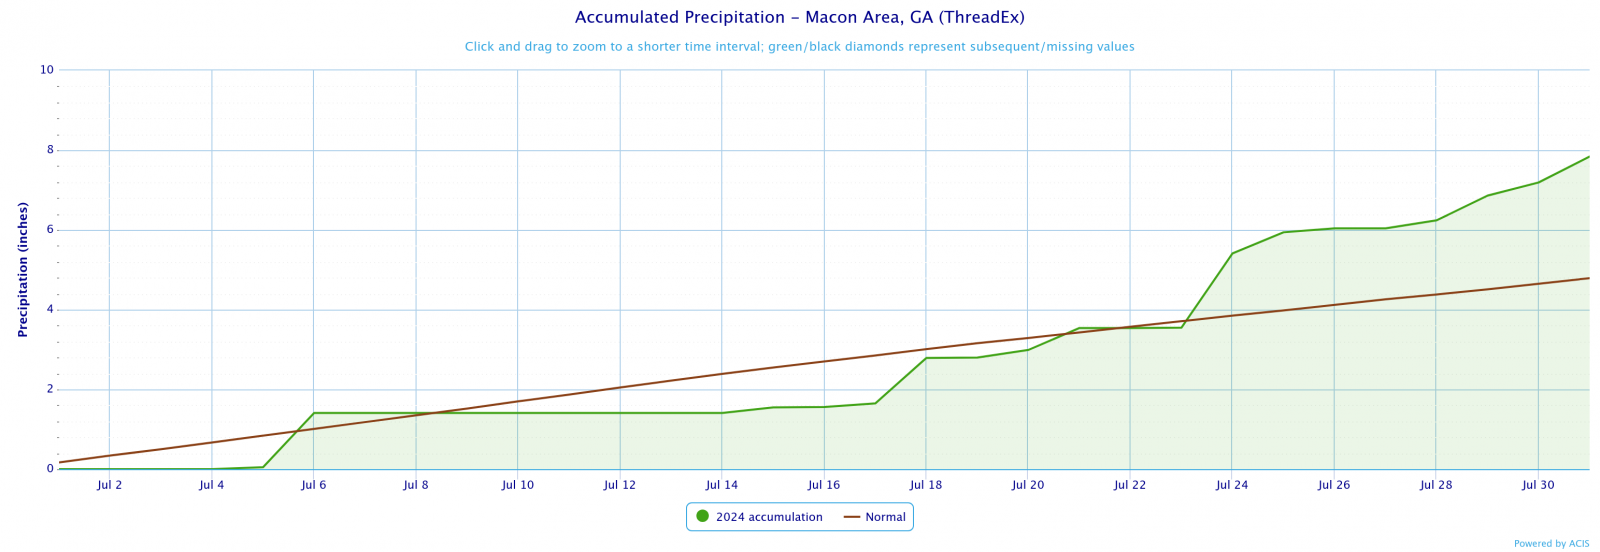
Macon
34th Warmest
13th Wettest
July 2024 Climate Averages
Climate Site
Month Temp (°F)
Average Temp
Departure from normal
Athens
82.2
81
1.1
Atlanta
82.4
80.9
1.5
Columbus
84.1
83.2
0.9
Macon
82.4
82.5
-0.1
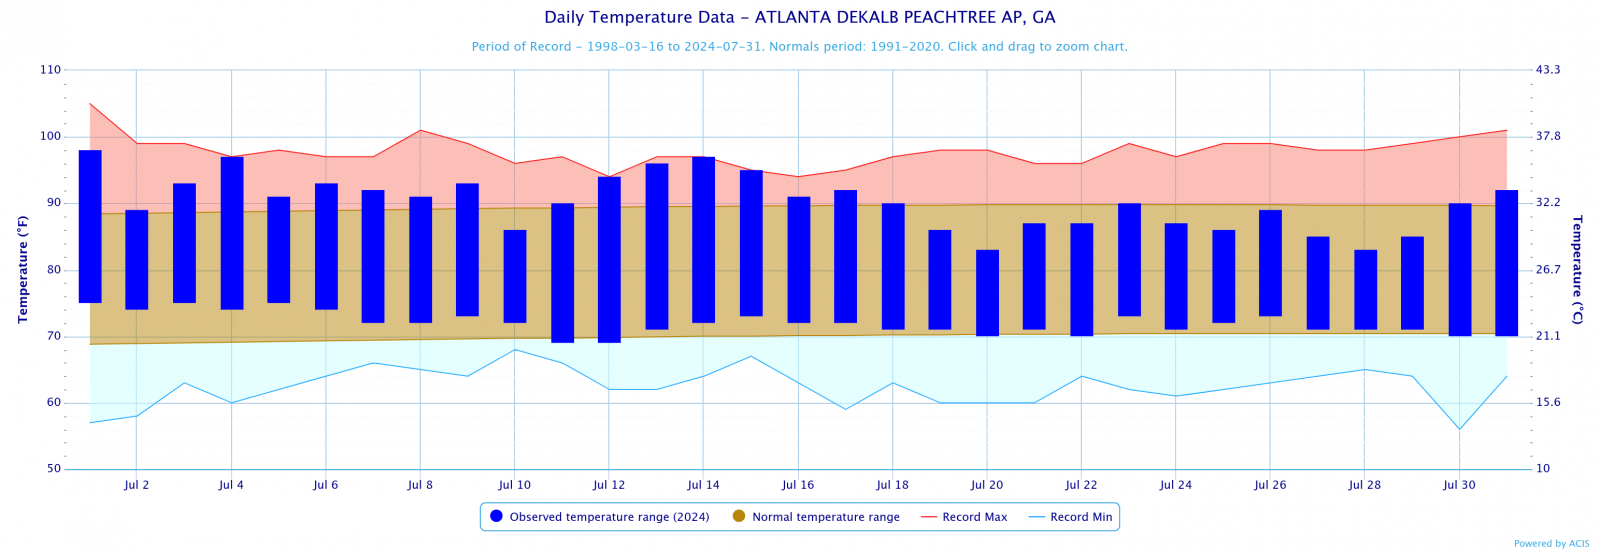
Dekalb Peachtree Arpt
81.1
79.6
1.5
Fulton Co Arpt
81.5
80.1
1.4
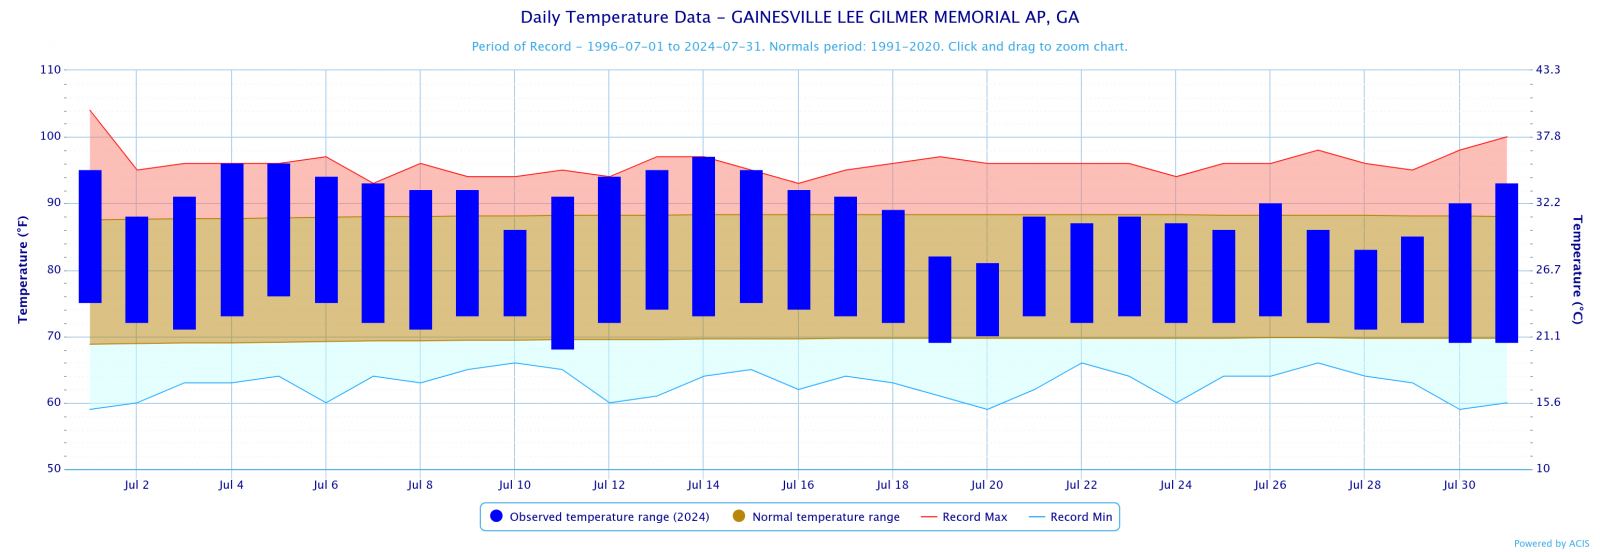
Gainesville
81.2
78.8
2.4
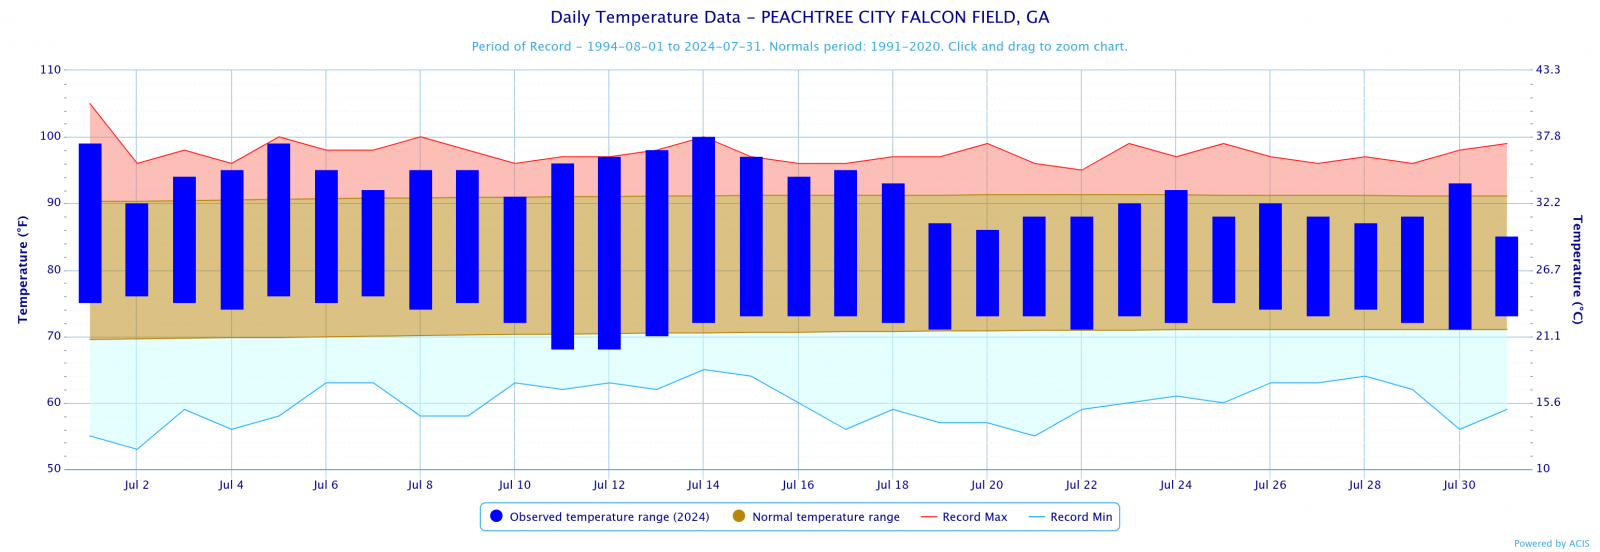
Peachtree City
82.7
80.8
1.9
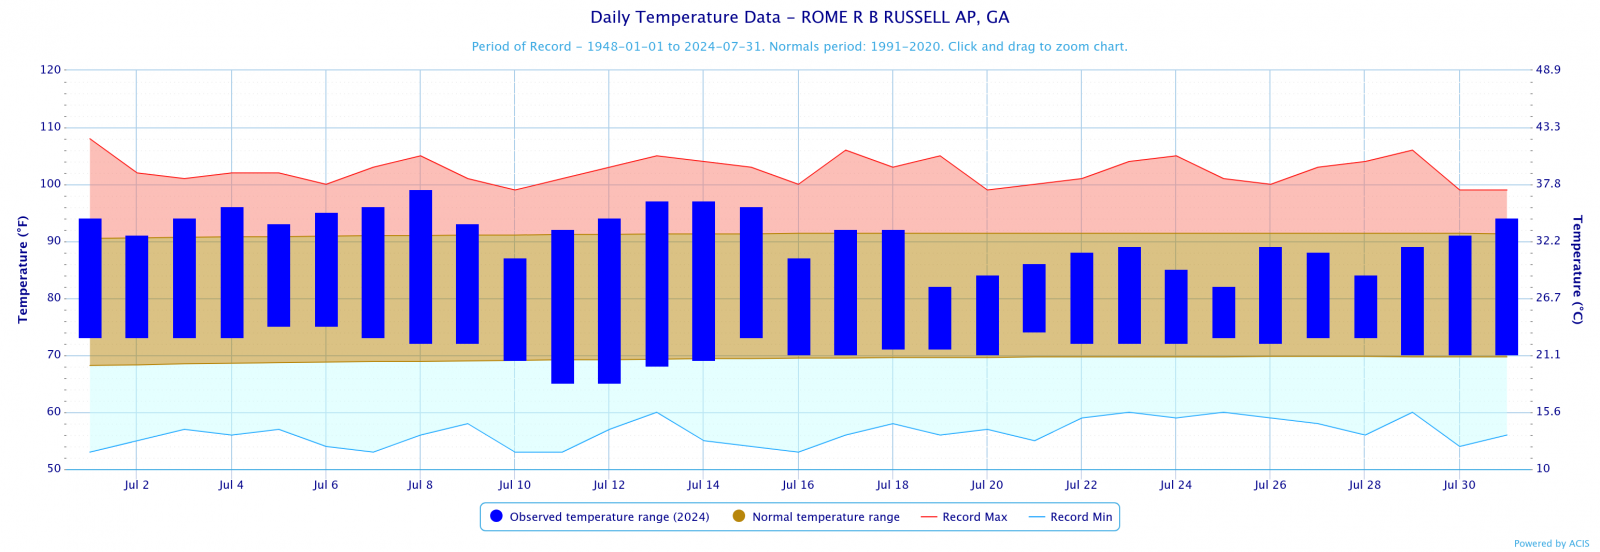
Rome
81.1
80.2
0.9
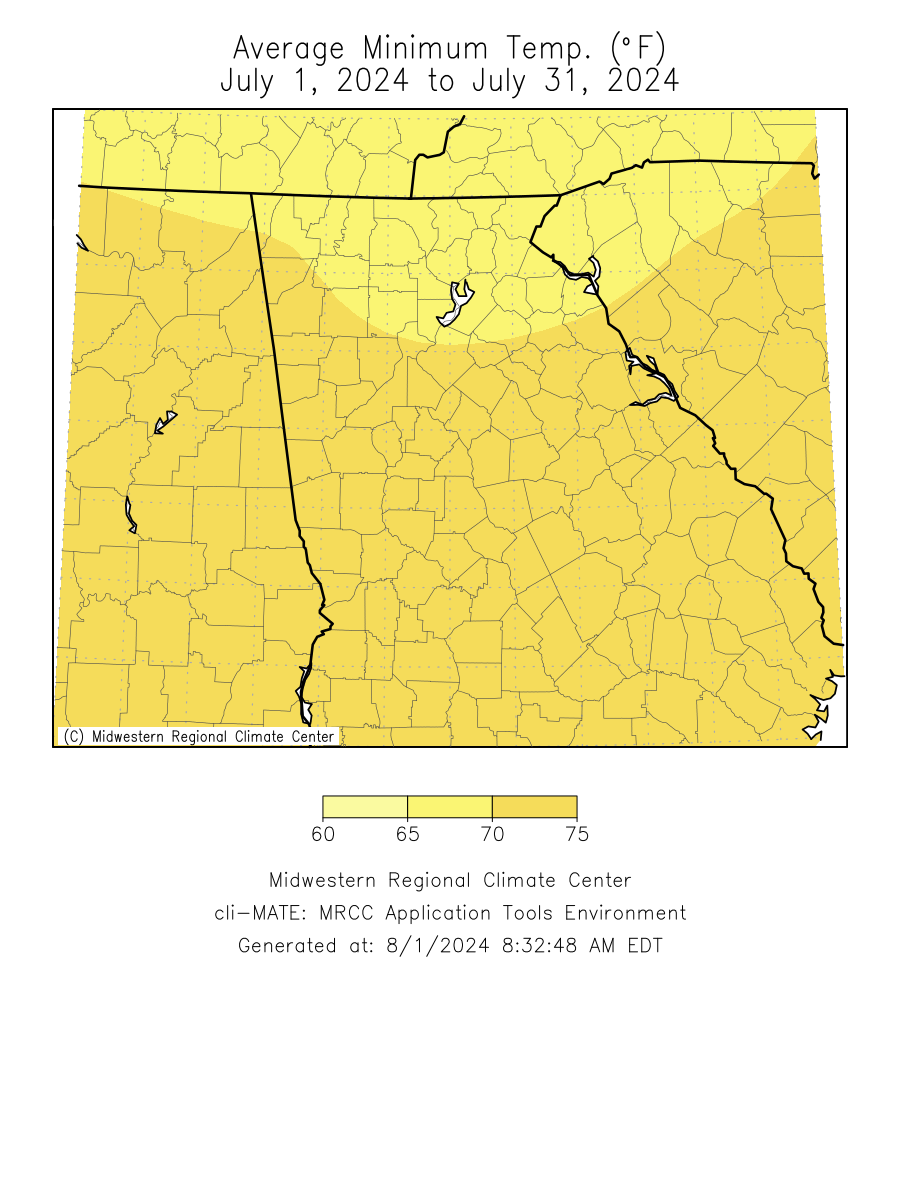
July 2024 Temperature Climate Statistics
Minimum Temperature
Min T Date
Athens
101
7/15
68
7/11, 12
Atlanta
97
7/13, 14
70
7/11, 20
Columbus
100
7/13
70
7/12
Macon
99
7/13, 14
67
7/12
Dekalb Peachtree Arpt
98
7/1
69
7/11, 12
Fulton Co Arpt
97
7/1, 14
68
7/12, 13
Gainesville
97
7/14
68
7/11
Peachtree City
100
7/14
68
7/11, 12
Rome
99
7/8
65
7/11, 12
July 2024 Precipitation Climate Statistics
Average Precipitation
From Normal)
Athens
7.17
4.2
2.97
Atlanta
14.02
4.75
9.27
Columbus
3.35
4.35
-1.00
Macon
7.84
4.79
3.05
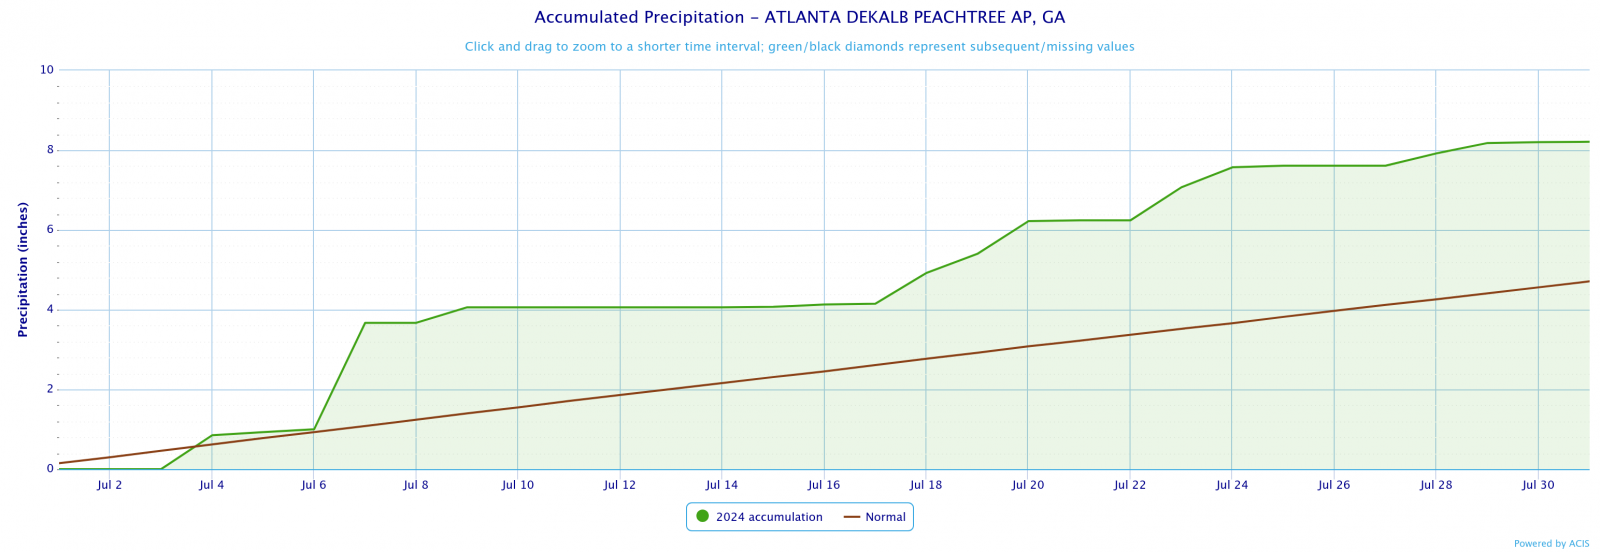
Dekalb Peachtree Arpt
8.21
4.71
3.50
Fulton County Arpt
6.08
5.01
1.07
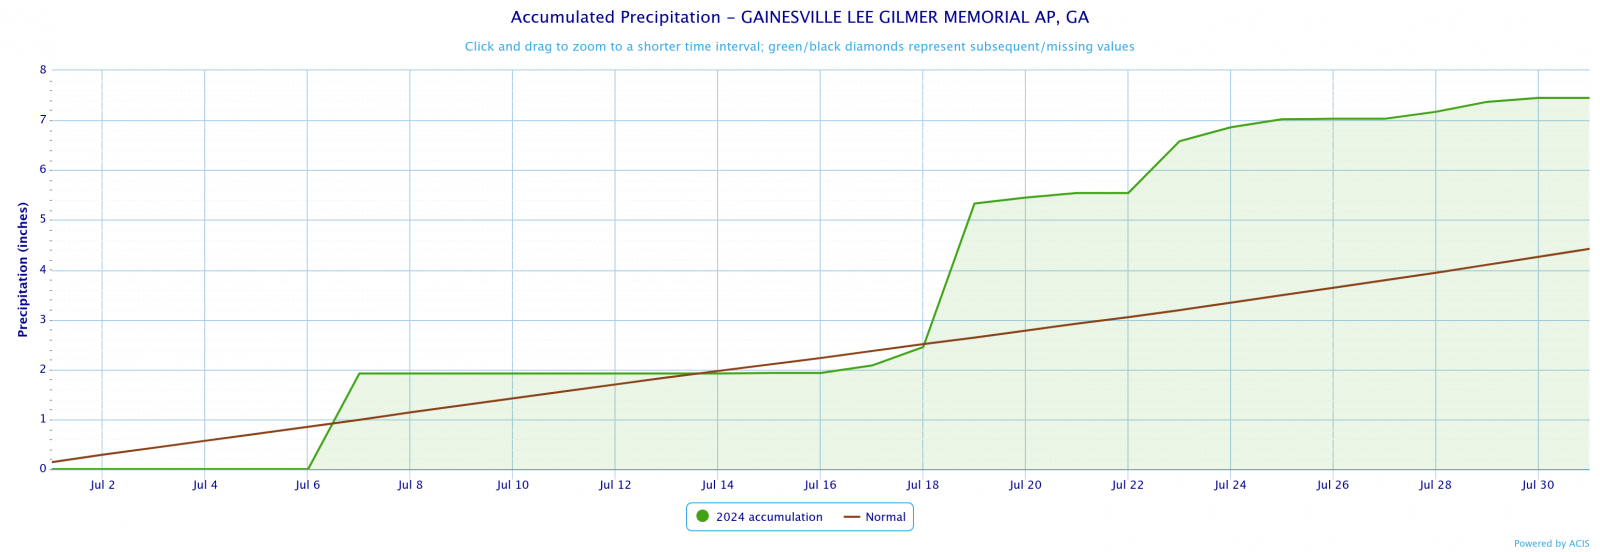
Gainesville
7.45
4.42
3.03
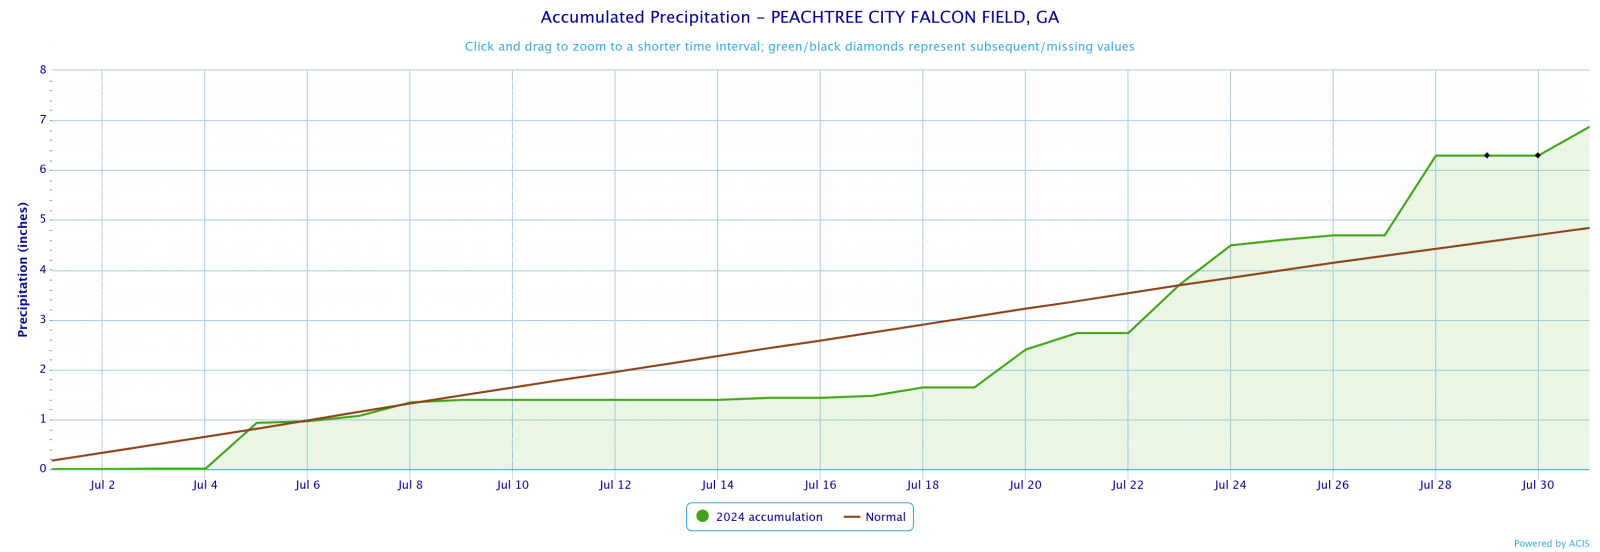
Peachtree City
6.87
4.42
2.03
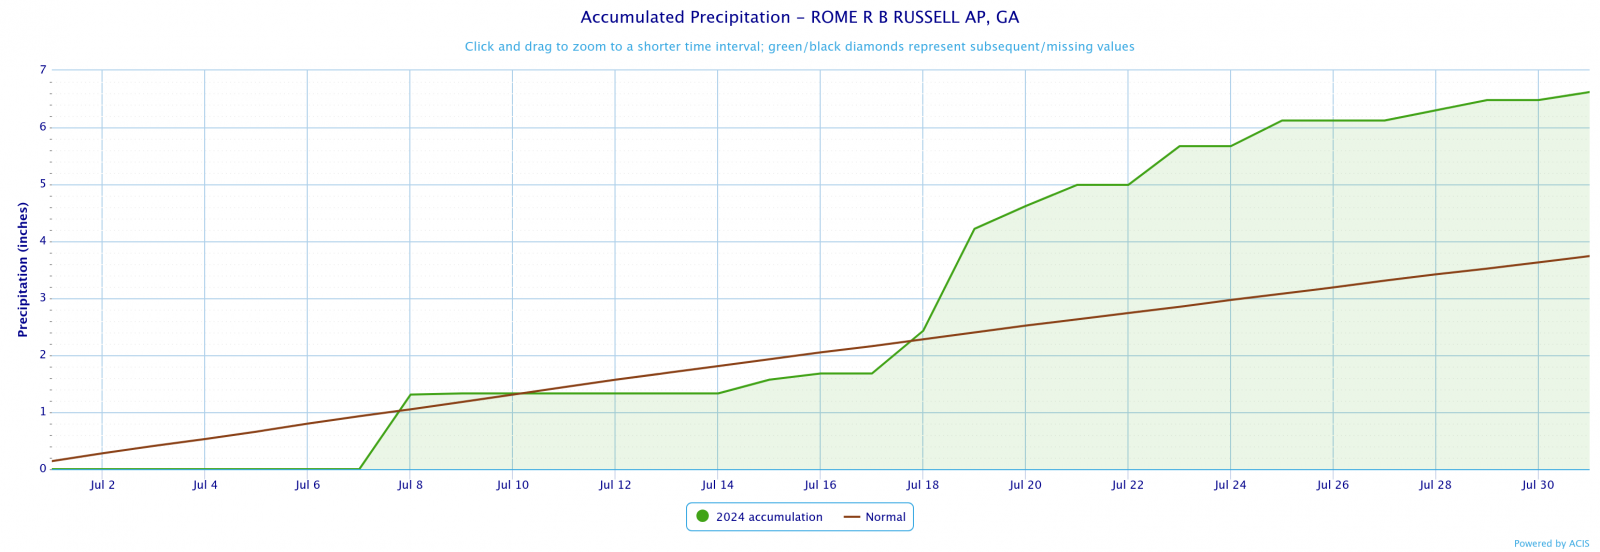
Rome
6.62
3.74
2.88
July 2024 Precipitation Climate Statistics
Athens
2.17
7/20
Atlanta
3.47*
7/28
Columbus
0.98
7/24
Macon
1.87
7/23
Dekalb Peachtree Arpt
2.67
7/7
Fulton Co Arpt
1.11
7/18
Gainesville
2.99
7/19
Peachtree City
1.87
7/30
Rome
2.33
7/19
Click the links below to explore the temperature and precipitation data across north and central Georgia for the month of July 2024.
Temperature Maps
Precipitation Maps
Temperature Graphs
Precipitation Graphs
Temperature and precipitation records at our 4 main climate sites are located below.
July 2024 Climate Records
Date
Type
Location
Records set over a 24 hour period
7/28
Daily Rainfall
Atlanta
3.47 inches of rain fell over 24 hours. This breaks the old record of 3.07 set in 1887
Larger events that occurred across north and central Georgia this past July can be found here.


The August climate outlook is below.
August Outlook