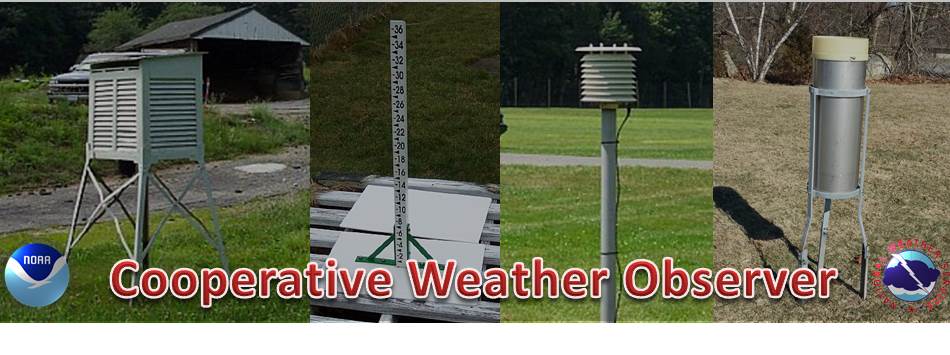
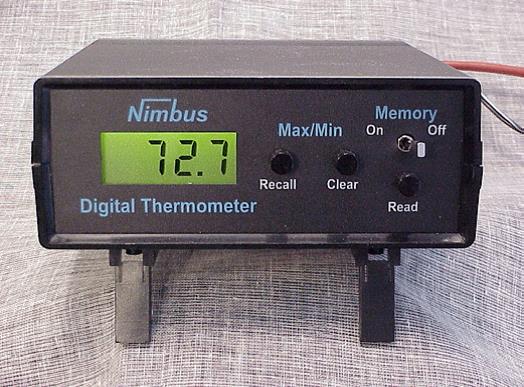
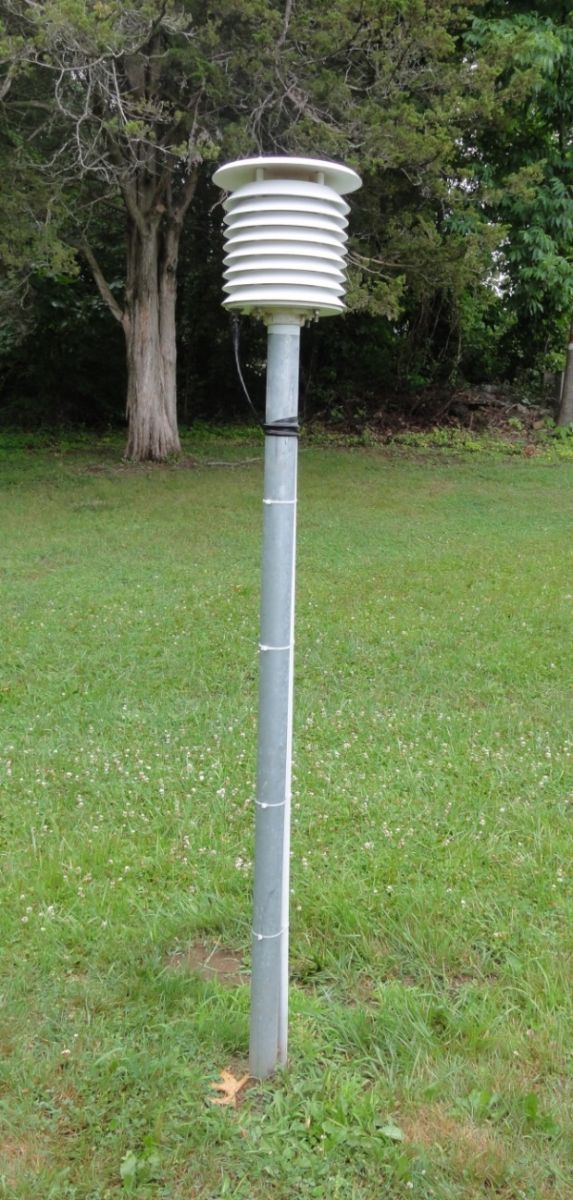
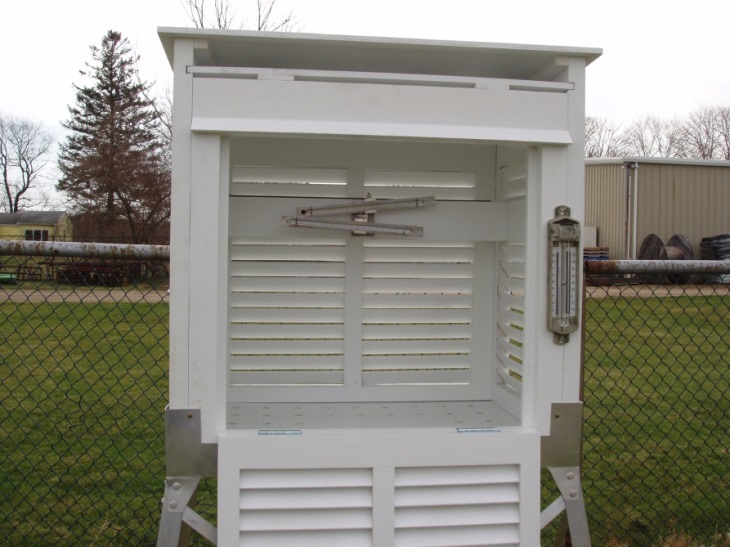
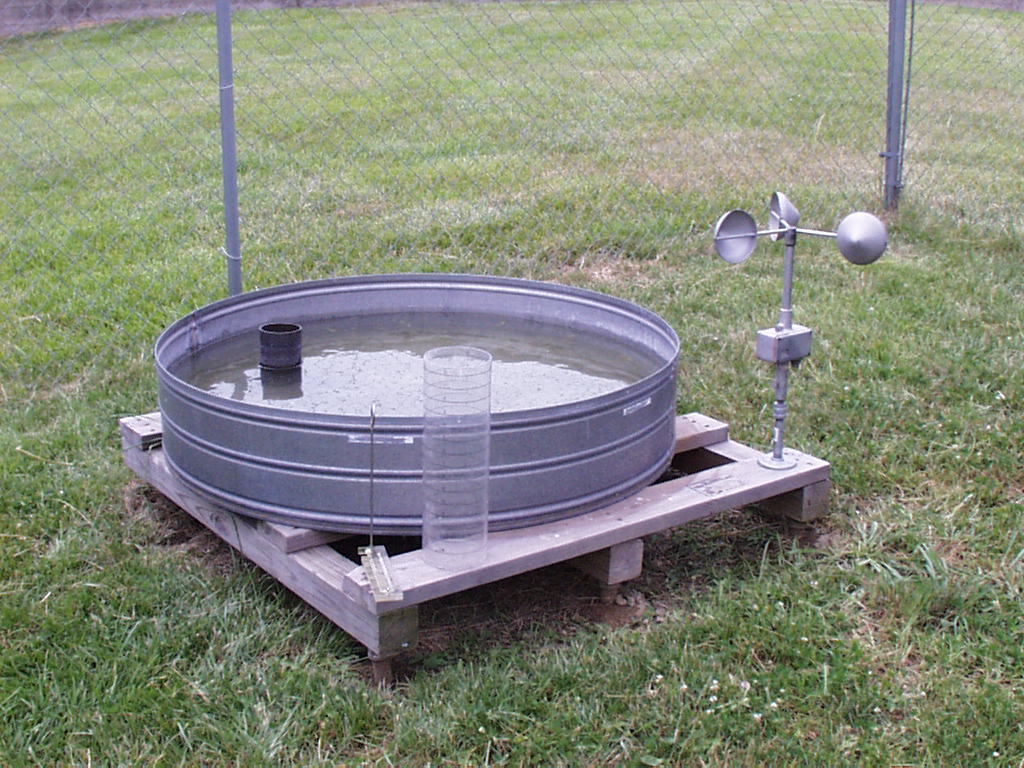
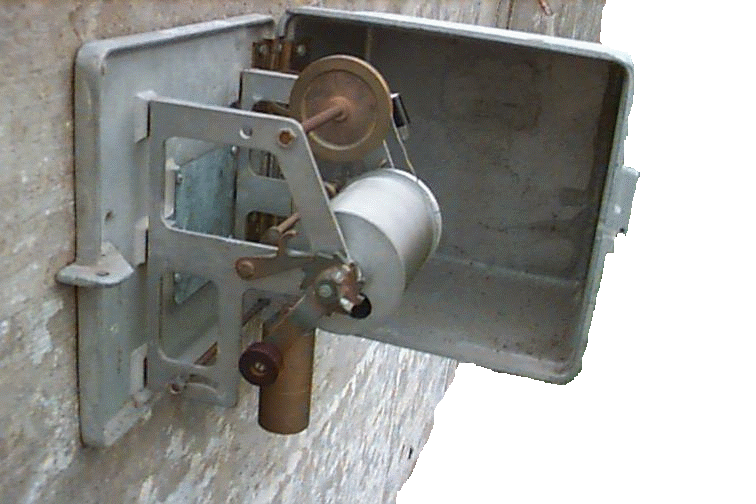
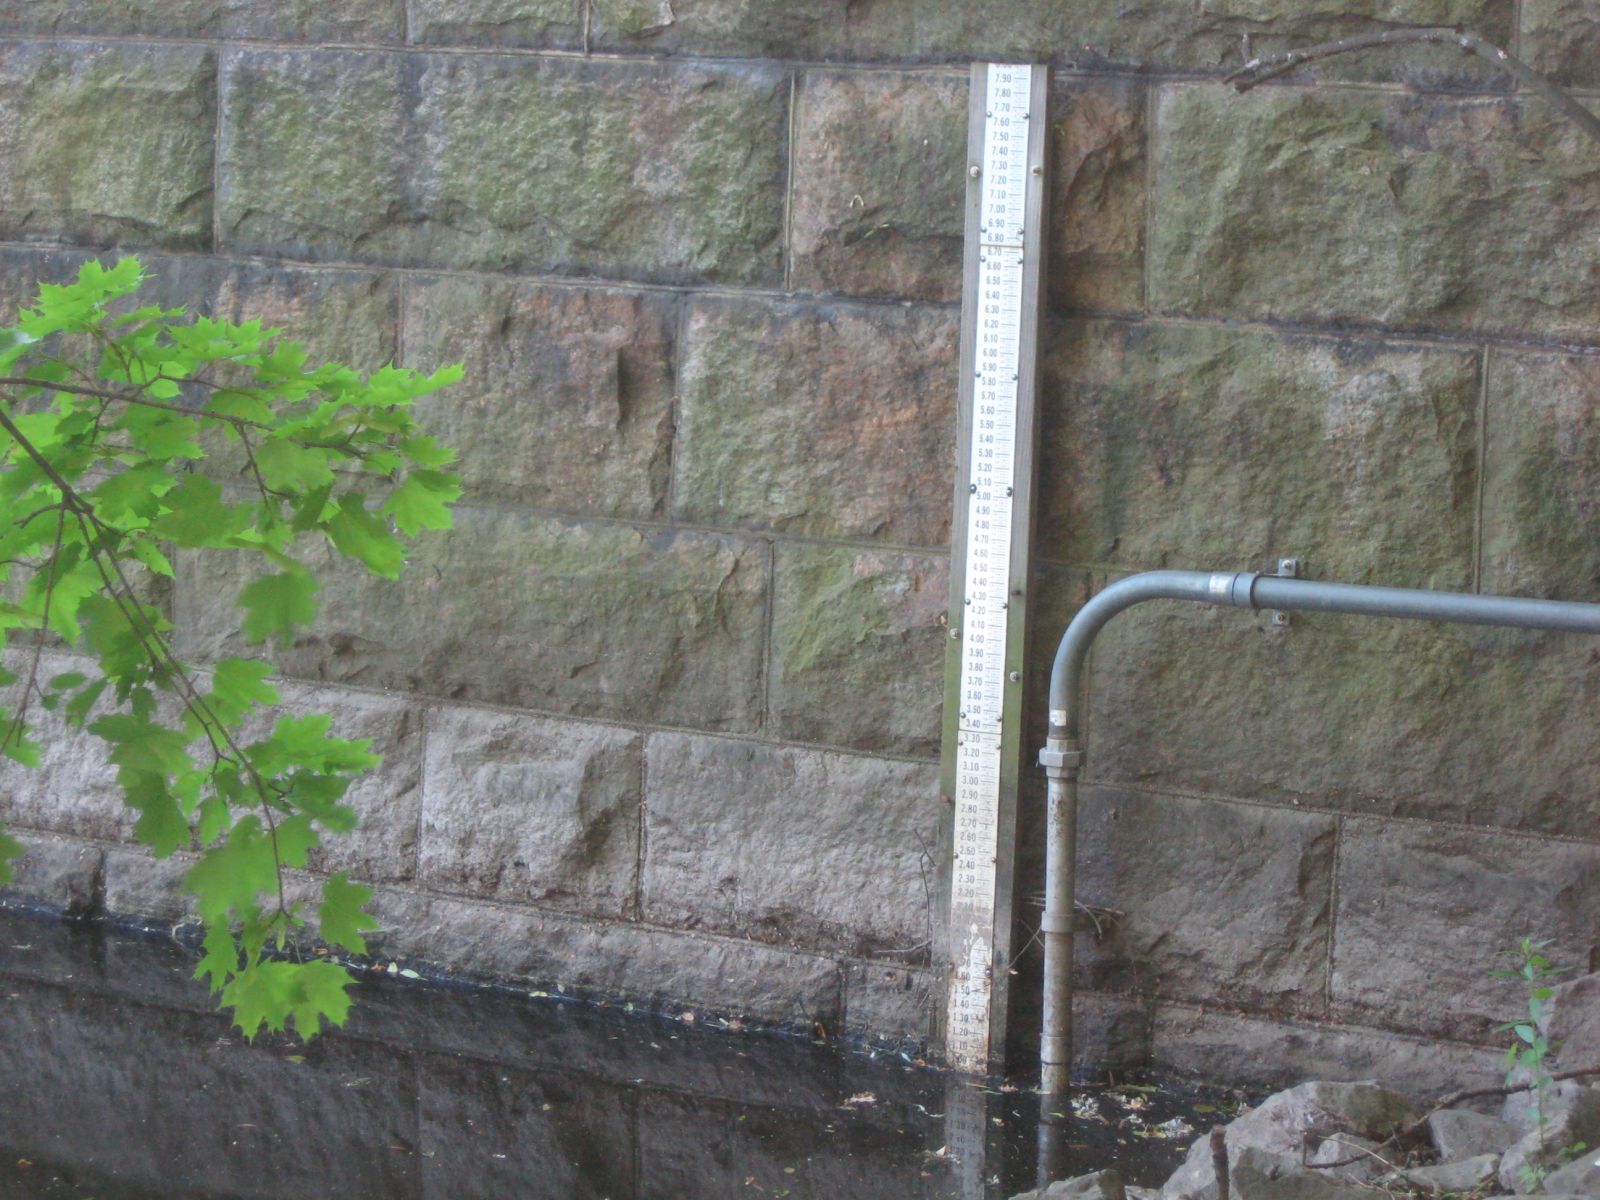
The National Weather Service (NWS) Cooperative Observer Program (COOP Program) is truly the Nation's weather and climate observing network of, by and for the people. Nearly 10,000 volunteers take observations on farms, in urban and suburban areas, National Parks, seashores, and mountaintops. The data are truly representative of where people live, work and play.
The COOP Program was formally created in 1890 under the Organic Act. Its mission is two-fold:
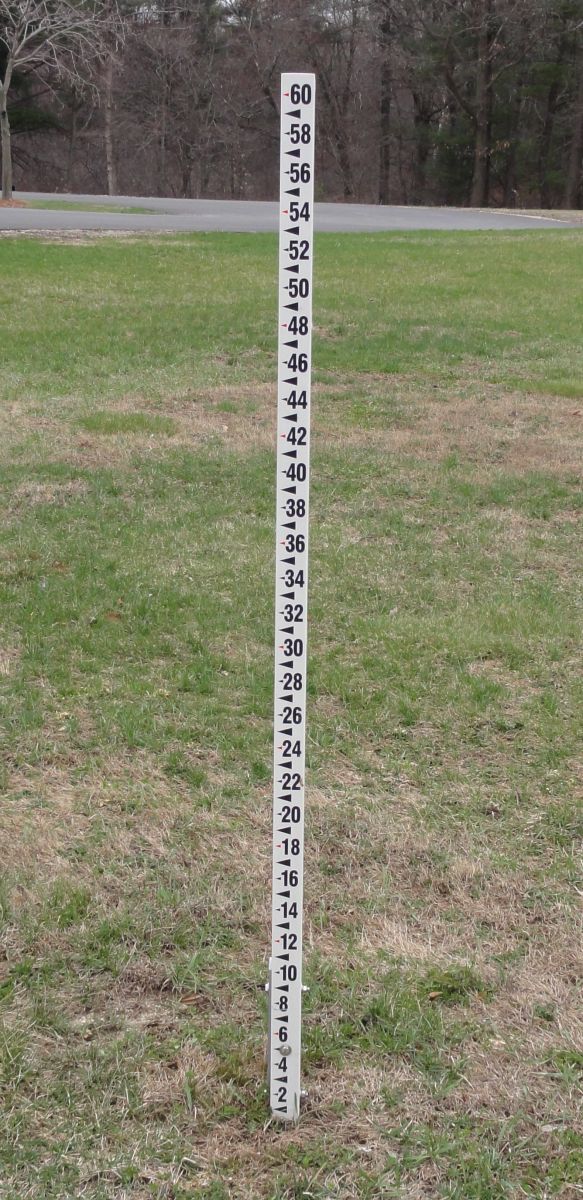
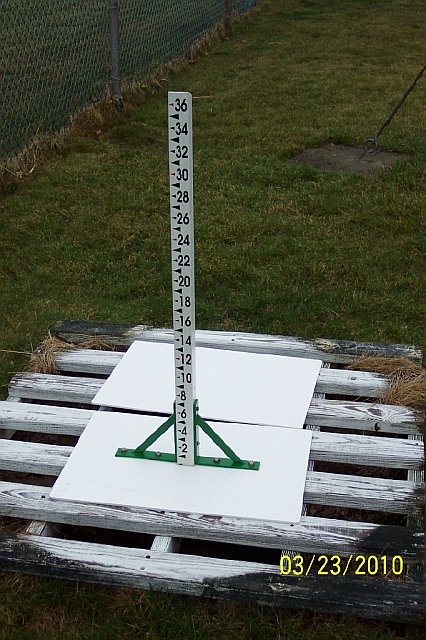
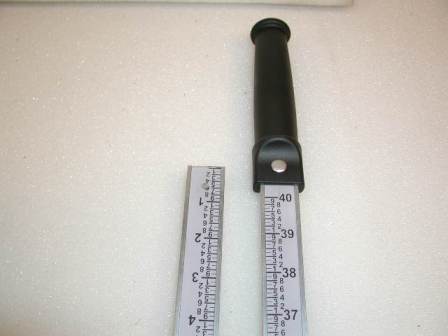
- To provide observational meteorological data, usually consisting of daily maximum and minimum temperatures, snowfall, and 24-hour precipitation totals, required to define the climate of the United States and to help measure long-term climate changes.
- To provide observational meteorological data in near real-time to support forecast, warning and other public service programs of the NWS.
Coop observational data supports the NWS climate program and field operations. The program responsibilities include:
- Selecting data sites.
- Recruiting, appointing and training of observers.
- Installing and maintaining equipment.
- Keeping station documentation.
- Collecting data and its delivery to users.
- Maintaining data quality control.
- Managing human resources required to accomplish program objectives.
Volunteer weather observers conscientiously contribute their time so that their observations can provide the vital information needed. These data are invaluable in learning more about the floods, droughts, heat and cold waves affecting us all. The data are also used in agricultural planning and assessment, engineering, environmental-impact assessment, utilities planning, and litigation. COOP data plays a critical role in efforts to recognize and evaluate the extent of human impacts on climate from local to global scales.
A quick fact sheet can be found here:
https://www.weather.gov/media/owlie/Coop_factsheet2Finalx.pdfA COOP station is a site where accurate and complete observations are taken or other services rendered by volunteers or contractors, 7 days a week, 365 days a year. This does not mean that someone has to be monitoring the weather all the time; instruments are provided to monitor temperature and precipitation. Yet someone should be available to record the daily maximum and minimum temperature, the precipitation, and snowfall. This generally is done around 7 am daily. Observations are reported and recorded either through the internet via computer or phone menu system which are then monitored daily by the local NWS office for quality assurance before forwarding to the National Centers of Environmental Information (NCEI) in Asheville, NC.
Automatic observing stations are considered COOP stations if their observed data are used for services which otherwise would be provided by COOP observers. A COOP station may be collocated with other types of observing stations such as standard observations stations, Flight Service Stations, etc. In these cases, that portion of the station observing program supporting the COOP Program's mission is treated and documented independently of the other observational and service programs.
Consistency of the measurements is an attribute of the network, and it has been maintained by rare and/or gradual change, and established standards for exposure, of instruments over the life of the network. In order to preserve the integrity of the network, NWS has established standards for equipment, siting, and exposure.
Temperature sensor siting:
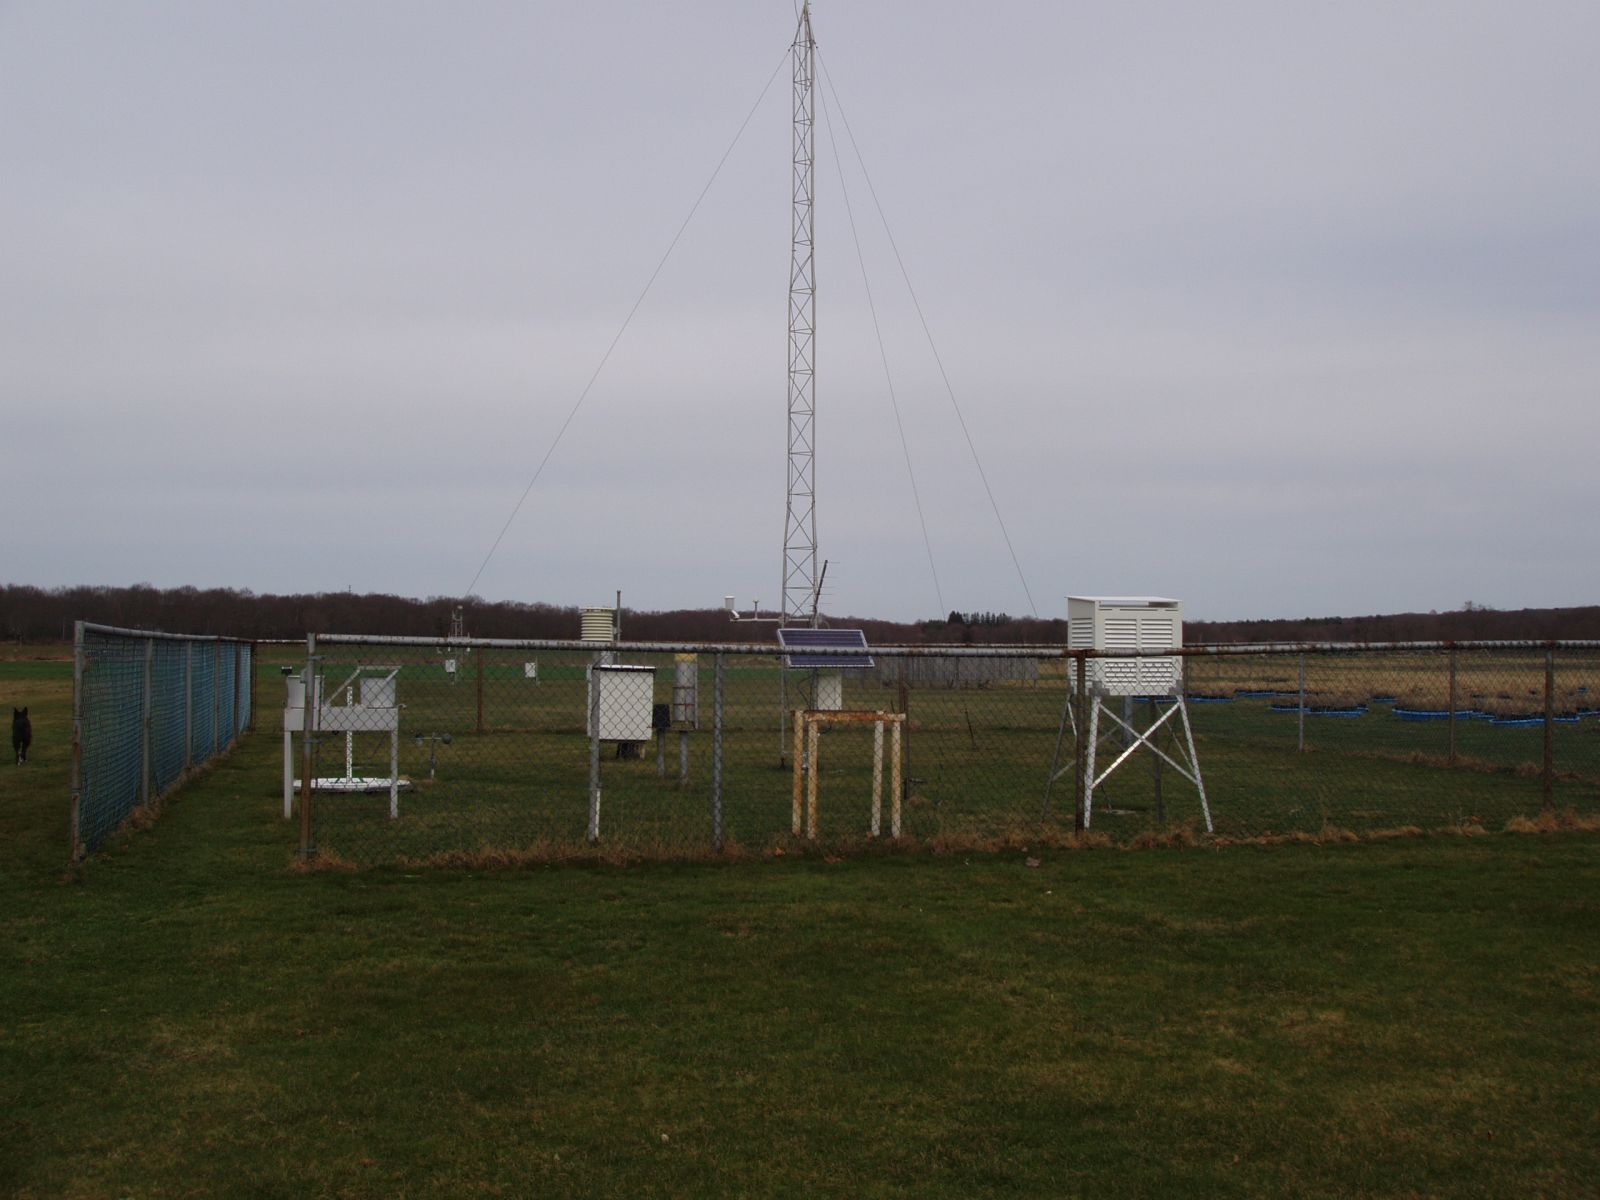
- The sensor should be mounted 5 feet +/- 1 foot above the ground.
- The ground over which the shelter [radiation] is located should be typical of the surrounding area.
- A level, open clearing is desirable so the thermometers are freely ventilated by air flow.
- Sensors are not to be installed on a steep slope or in a sheltered hollow unless it is typical of the area or unless data from that type of site are desired.
- When possible, the shelter should be no closer than four times the height of any obstruction (tree, fence, building, etc.).
- The sensor should be at least 100 feet from any paved or concrete surface.
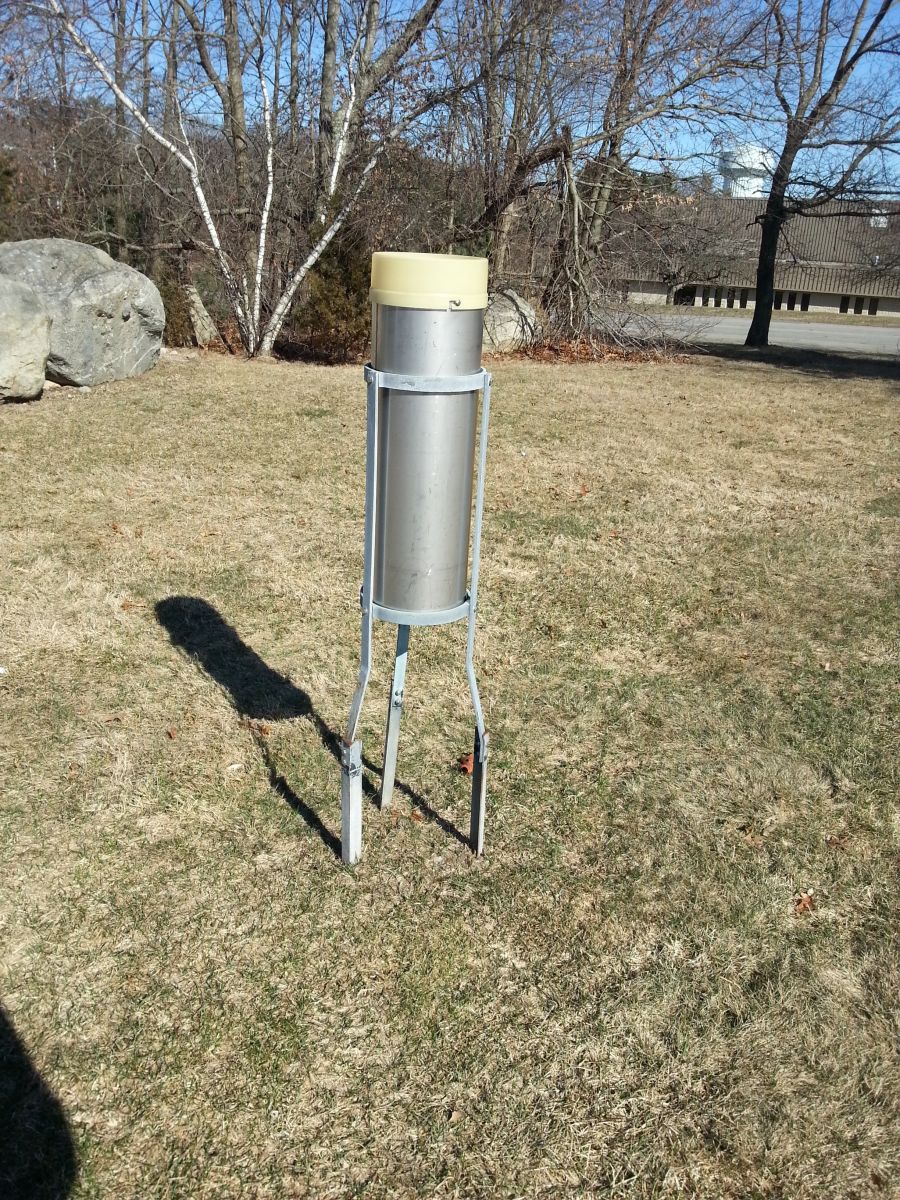
Precipitation gauge siting:
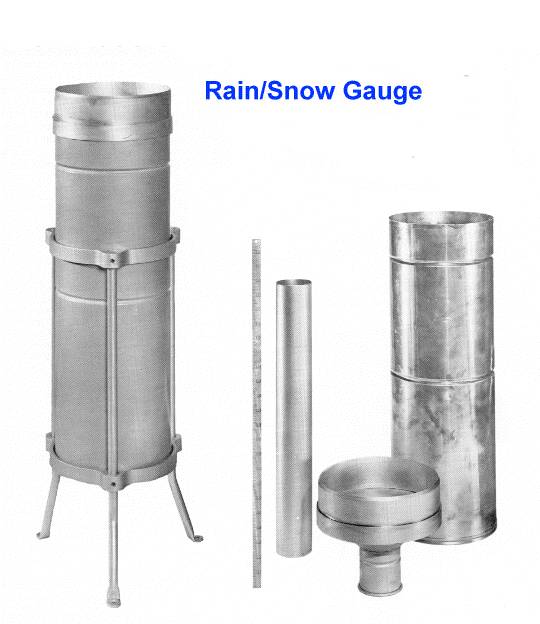
- The exposure of a rain gauge is very important for obtaining accurate measurements.
- Gauges should not be located close to isolated obstructions such as trees and buildings, which may deflect precipitation due to erratic turbulence.
- To avoid wind and resulting turbulence problems, do not locate gauges in wide-open spaces or on elevated sites, such as the tops of buildings.
- The best site for a gauge is one in which it is protected in all directions, such as in an opening in a grove of trees.
- The height of the protection should not exceed twice its distance from the gauge.
- As a general rule, the windier the gauge location is, the greater the precipitation error will be.
Though NWS Weather Forecast Offices (WFOs) recruit Cooperative Observers, the distribution of Cooperative Weather Stations is a function of need. Needs are defined by NWS WFOs and data users, while considered within the context of constraints of limited federal resources.
The basic distribution of Cooperative stations in the network are governed by an 1953 Iowa State University study, which determined that a spacing of about one station every 25 miles (one per 625 square miles) was sufficient to adequately define the climate of the United States in areas of homogeneous terrain. Greater densities are allowed in areas with large differences in elevation, urban heat islands, steep land-sea-lake interfaces, etc. Because the network is over 100 years old (established in 1890), many areas already have the necessary stations operating; however, about 200 observers resign each year, about 4 per state. Additionally, changing requirements can expand the need for observers.
Becoming a NWS Cooperative observer volunteer requires the following:
- Dedication to public service.
- Attention to detail.
- Ability to learn and perform daily duties.
- Willingness to allow NWS to place measuring instruments on your property.
- Willingness to allow at least one visit per year from a NWS representative.
Additionally, the following capabilities are useful but are not mandatory:
- Ownership of a personal computer and familiarity with its basic uses.
- Established internet access.
If you are selected to become an official NWS Cooperative station, NWS will provide you with the equipment, training and supervision you will need to perform your duties. Depending on your station's instrumentation, your site will be visited once or twice every 12 months, more if unscheduled maintenance or training updates are required.
Observers receive no pay.
If you are interested in becoming an NWS Cooperative observer, contact our webmaster.
Observers are not required to take any tests. Training consists of on site, hands on instruction with the designated Cooperative Observer and their backup. This usually is done the same day as the equipment is installed and takes about one hour. If necessary, additional training may be provided upon request. Basic equipment maintenance is discussed and the Cooperative Observer is provided with a name ("point of contact") and a number should additional questions or problems arise. A reference binder is also provided.
Observers generally record temperature and precipitation daily and electronically send those reports daily to the NWS and the National Centers of Environmental Information (NCEI). Many cooperative observers provide additional hydrological or meteorological data, such as evaporation and/or soil temperatures. Data is transmitted via telephone, computer or, in special cases, by mail. Equipment used at NWS cooperative stations may be owned by the NWS, the observer, or by a company or other government agency, as long as it meets NWS equipment standards.
Data is immediately transmitted to the local NWS office where it is used to support the day-to-day operations of the NWS in its forecast and warning decisions. While the data is checked and preliminary published, with the conclusion of each month it is quality-controlled against forms and charts sent in each month by Cooperative Observers. Either flagged for error or accepted as-is through a series of checks and comparisons of the individual station data with surrounding stations to ensure the data is within set tolerances, the data is then archived at the National Centers of Environmental Information (NCEI) in Asheville, NC and formally published as official for public review, as well as certifiable.
This process has been deemed the best practice to keep the data as unbiased as possible. Human error and equipment problems are generally the culprit for erroneous data.
Long term records of COOP observations are the backbone of climate monitoring across the United States. Many COOP sites have periods of record that range from 50 to 100 years, or even longer. These records are used to compute means and trends, and to examine monthly, seasonal and annual variations in our climate.
Over the years, droughts have had tremendous negative impacts on the economy of the U.S. and the quality of life for its residents. At any give time, a significant percentage of the U.S. can be affected by drought. COOP observations are used to compute a number of drought indices, including the Palmer Drought Index. By carefully monitoring drought conditions, we are better able to prepare and properly respond to droughts.
COOP observations from sites with a long period of record, a low percentage of missing data, and few station moves are included in the U.S. Historical Climatology Network (USHCN, Karl et al., 1990). This is a high-quality moderate sized data set of monthly averaged maximum, minimum, and mean temperature and total monthly precipitation developed to assist in the detection of regional climate change. The USHCN is comprised of 1221 high-quality stations from the U.S. Cooperative Observing Network within the 48 contiguous United States.
The USHCN was developed and is maintained at the National Centers of Environmental Information (NCEI) and the Carbon Dioxide Information and Analysis Center (CDIAC) of Oak Ridge National Laboratory through a cooperative agreement between NCEI and the U.S. Department of Energy.
When you are out of or short on supplies, you may either request supplies by including a note with your form at the end of the month or by emailing btv.webmaster@noaa.gov. Either which way, when requesting supplies, be sure to include the following:
- Station Location
- Station ID
- Supply Request (i.e., stamps, B-91 Forms, B-92 Forms, B-83 Forms, B-91/B-92/B-83 Envelopes, Fischer-Porter Envelopes)
Does your equipment require attention? Here's the place to contact us for any repairs that need to be made to your equipment. For equipment problems, email btv.webmaster@noaa.gov with your 1) Station Name, 2) ID and 3) station issues.
