Hot and Dry Summer of 2012
Continuing the trend seen in the Spring (March's warm temperatures), the beginning of Summer saw much above normal temperatures. In addition, very dry conditions developed across central Indiana. The hot and dry conditions continued through July, but temperatures cooled and rain returned for August. Read below for monthly highlights
Temperature Information (precipitation information is farther down the page)
By the end of June, Indianapolis had set a new record for the highest temperature in June. Temperatures topped the 100 degree mark twice in June, the most since 1934.The month of June was also the driest June on record at Indianapolis and was the second driest month overall.
Below are some facts for the heat wave and its impact on records in June:
The earliest the temperature has ever reached 100 degrees at Indianapolis was June 2, 1934. The all time record high for Indianapolis for any month is 106 degrees. The last occurrence of 105 and 106 degree readings was on July 14, 1936.
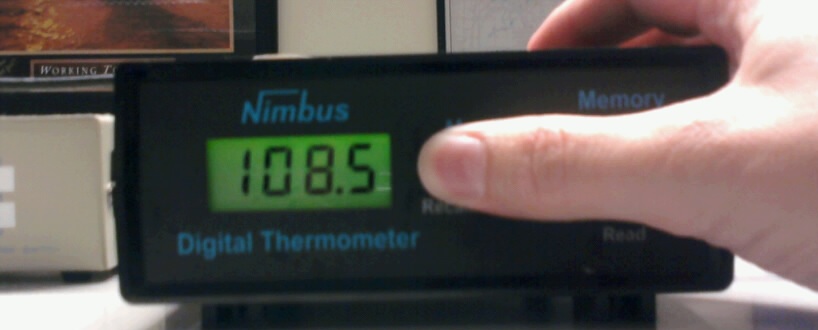
High temperature at the Indianapolis NWS Forecast Office on June 28.
The official high temperature of 104 degrees was recorded at the Indianapolis International Airport.
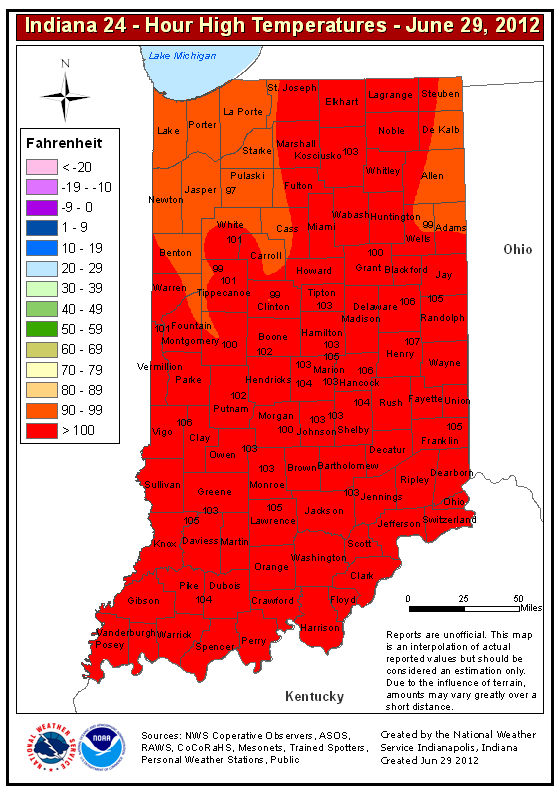
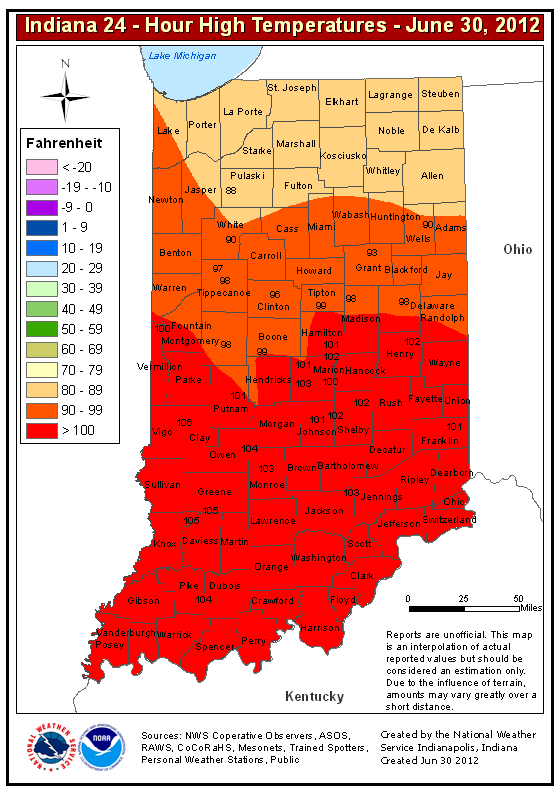
Below are high temperatures for June 28 and June. Click to enlarge.
 |
 |
|
High Temperature Map for June 28 (Note: Map was made early on June 29 and includes data for the previous 24 hours) |
High Temperature Map for June 29 (Note: Map was made early on June 30 and includes data for the previous 24 hours) |
July
Hot temperatures continued into July. At Indianapolis, July 2012 became the warmest month on record for the city. In addition, a record was set regarding high temperatures. For the 23 day period beginning June 27, the average high temperature at Indianapolis was 97.3 degrees. This breaks the previous record from 1936 by 1 degree. Also, the low temperature at Indianapolis remained at 70 or above for 22 consecutive days, setting a new record.
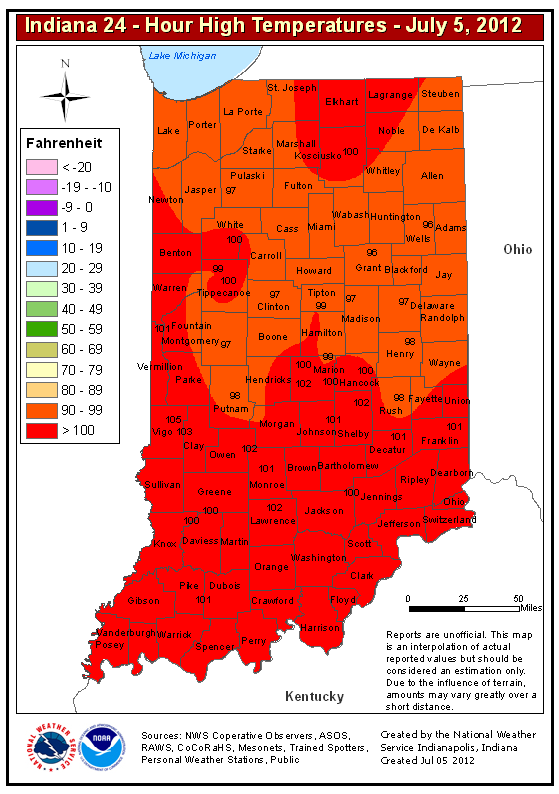
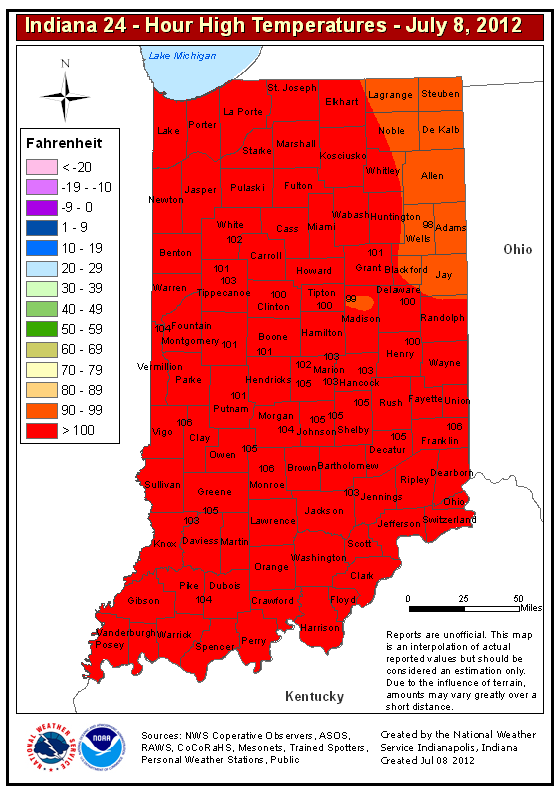
The 4th of July at Indianapolis was the second warmest 4th of July on record, topping out at 102 degrees. The record for Indianapolis for Independence Day is 103 degrees. Just a few days later, temperatures came within one degree of tying the all time record high for Indianapolis. On July 7 the high was 105 degrees. Below are maps of high temperatures for Indiana for July 4 and 7, click to enlarge.
 |
 |
|
High Temperature Map for July 4 (Note: Map was made early on July 5 and includes data for the previous 24 hours) |
High Temperature Map for July 7 (Note: Map was made early on July 8 and includes data for the previous 24 hours) |
August
August started out warm with some locations reaching 100 degrees, but big changes came after the first third of the month. The middle third of the month averaged below normal, before near or above average temperatures returned for the last third of the month.
The string of consecutive 80 degree or higher maximum temperatures at Indianapolis was broken on August 10, when the high only reached 77 degrees. The string of 64 days that began on June 7 is the second longest stretch of consecutive 80 degree or higher maximum temperatures for Indianapolis, second only to the 86 day stretch in 2002.
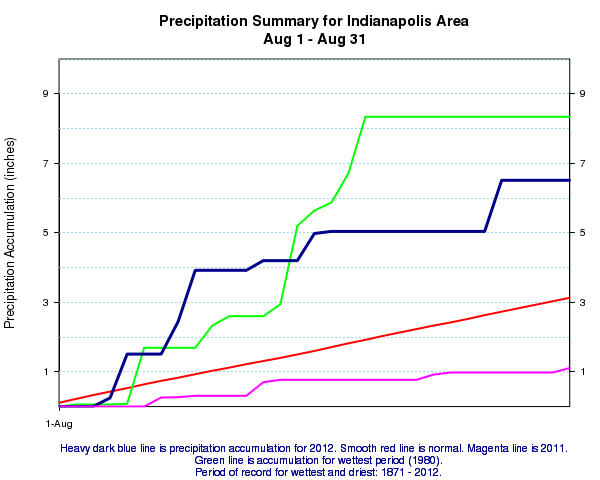
August's temperature and precipitation graphs are below:
June
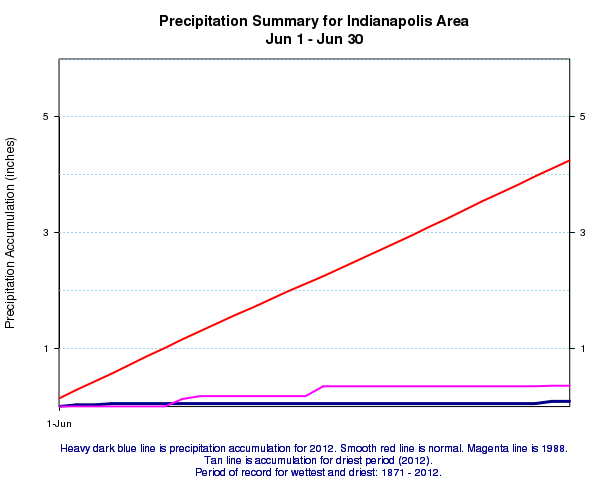
June 2012 is the driest June on record for the Indianapolis area. The total precipitation for the month at the Indianapolis International Airport was 0.09 inches. The average precipitation for June is 4.25 inches. The old record was 0.36 inches in June 1988. June 2012 is also the second driest month on record for the Indianapolis area. The driest month on record is March 1910, with 0.07 inches.
Through June 28, there were 24 consecutive days without measurable precipitation at Indianapolis. This is a record for June and is the longest period without measurable precipitation since the 25 day stretch ending March 4, 1983. This is a relatively rare phenomenon for the Indianapolis area, occurring only 10 other times since records began in 1871. The record number of consecutive days without measurable precipitation is 39 days, set from August 14 -September 21, 1908.
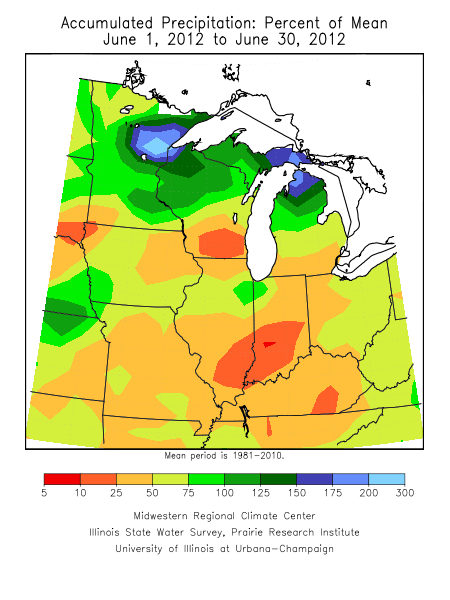
By the end of June, much of central Indiana was classified as in a severe drought,with parts of the area in an extreme drought.
Below is a graph of June rainfall, showing average, 2012, and 1988's rainfall. Below that is a plot of June's precipitation for the Midwest in terms of percent of normal (image courtesy of the Midwest Climate Center). July's information follows the images:
July
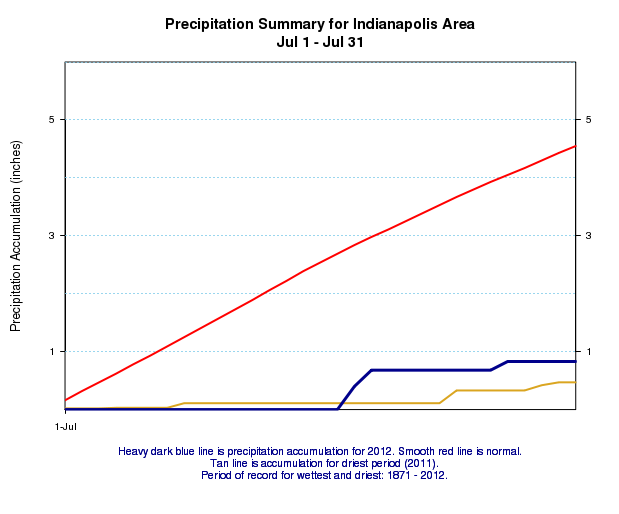
Indianapolis set a record for longest dry spell. For the period of June 1 to July 17, Indianapolis received only 0.09 inches of precipitation. This broke the record of 45 days set in 1908. Also, no measurable precipitation fell at Indianapolis for the first 17 days of July, This was the driest start to any July on record. After some rain fell later in the month, July 2012 tied for the 6th driest July on record for the Indianapolis area.
Below is a plot of July rainfall at Indianapolis, showing average, 2012, and 2011's rainfall. (July 2011 was the driest July on record).
August
August saw the return of abundant rainfall to parts of central Indiana, including Indianapolis. August 2012 is the 8th wettest August on record at Indianapolis.
Below is a plot of August rainfall at Indianapolis, showing average, 2012, 2011, and 1980's rainfall. (August 1980 was the wettest August on record).