Indianapolis, IN
Weather Forecast Office
The record for earliest snowfall at Indianapolis was set on October 18, 1989 with 0.2 inch. (The average date of the first measurable snowfall at Indianapolis is November 19). This was the first of 3 consecutive days of measurable snowfall from a potent storm system. The total for the storm at Indianapolis was 9.3 inches, with an even higher total at Kokomo with 10.5 inches from the storm. Below is an excerpt about the storm from the National Climatic Data Center's Storm Data publication:
"An intense upper-level low pressure system was anchored over the Missouri bootheel which allowed warmer, southerly winds to override colder surface air over Indiana. Snowfall began to accumulate on grassy and exposed areas as the air temperature hovered near freezing. By 0700 EST, accumulations of five to six inches were recorded from across central Indiana, and elevated roadways and bridges were becoming ice covered. The ice conditions became only wet by late morning as the temperatures rose to the middle thirties and road crews had spread salt on affected areas. Another problem was the wet, heavy snow was the large accumulation on power lines, and especially on trees, since many trees still had a substantial number of leaves. Scattered power outages were reported from across central Indiana..."
"The axis of maximum snowfall was from South Bend to Indianapolis to Bedford (Lawrence County). The maximum snowfall was 10.5 inches at Kokomo in Howard County."
Below is a plot of storm total snowfall from selected sites around central Indiana. Click the image to enlarge.

Below is a NCEP Reanalysis of the storm valid at 7:00 AM EST October 19, 1989. Click the image to enlarge.

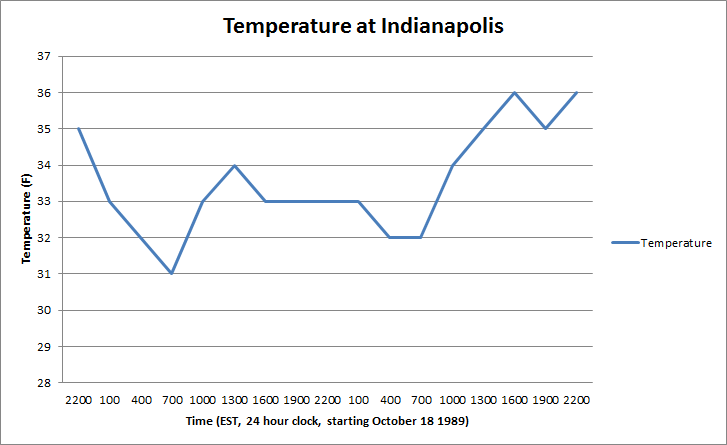
The high temperature of 35 degrees at Indianapolis on October 19 set the record for lowest high temperature for the date. Below are plots of the temperature and visibility at Indianapolis during the event, starting at 10:00 PM EST on October 18 and ending at 10:00 PM EST on October 20.

Hazards
Hazardous Weather Outlook
Drought Information
NOAA All Hazards Radio
Graphical Hazards Outlook
Spotter Information
Outdoor Event Watcher
Local forecasts
Local Area
Aviation
Computer Model Forecasts
Fire Weather
Graphical
Precipitation
Air Quality
Text River Forecasts
Area Forecast Discussion
Central Indiana Weather Brief
US Dept of Commerce
National Oceanic and Atmospheric Administration
National Weather Service
Indianapolis, IN
6900 West Hanna Avenue
Indianapolis, IN 46241-9526
317-856-0664
Comments? Questions? Please Contact Us.

