Overview
|
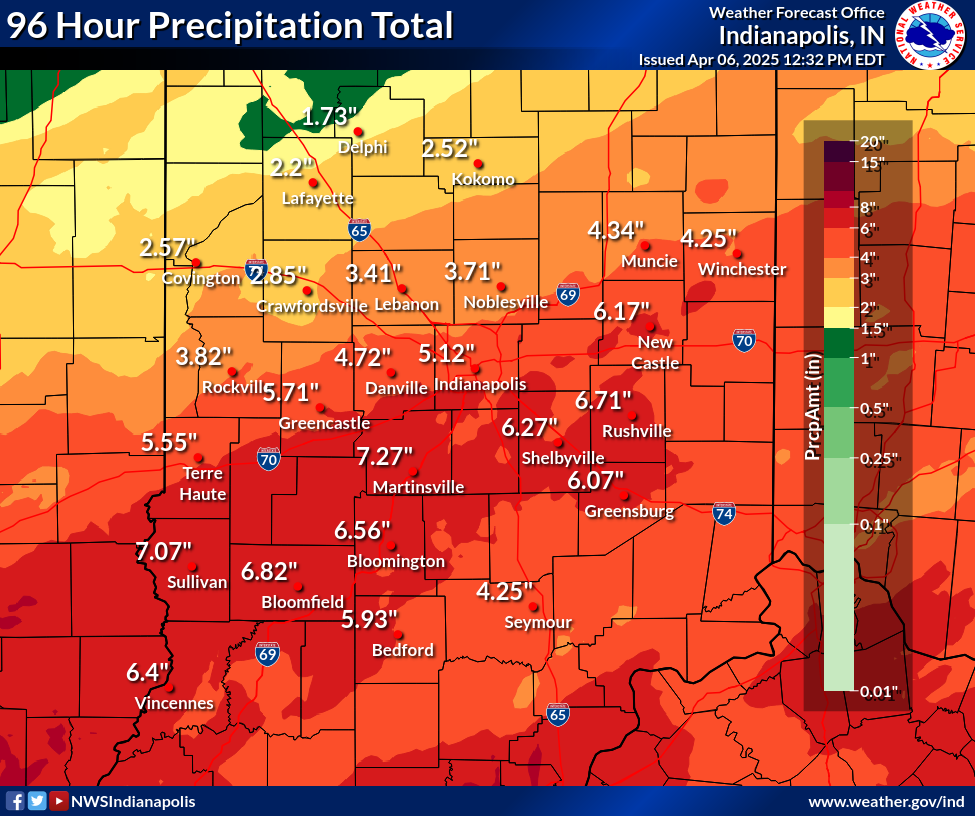
A meandering surface front with waves of low pressure along it generated periods of heavy rain across central Indiana from April 2 to April 5. Rain totals in a 96-hour period reached over 7 inches in some areas, with weekly totals over 8 inches. The heavy rain falling in short time periods caused flash flooding. Extensive river flooding followed, with some areas seeing the highest river levels since 2008. The Big Blue River at Shelbyville had its highest crest since 1913. Image to the right shows before and during flooding satellite pictures from April 1 and April 8. The image is modified Copernicus Sentinel data 2025. |
 Before/After Flooding for Central Indiana Courtesy of Copernicus/ESA |
Rain Reports
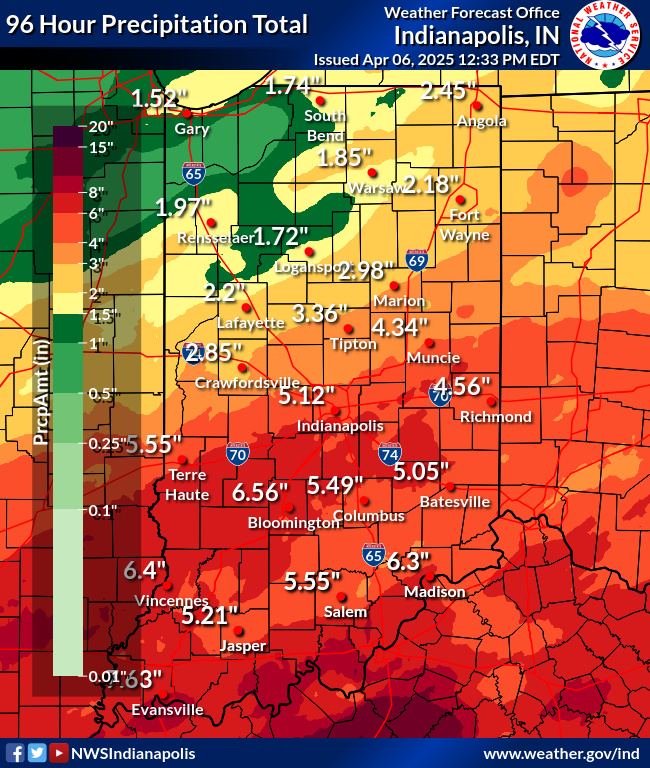
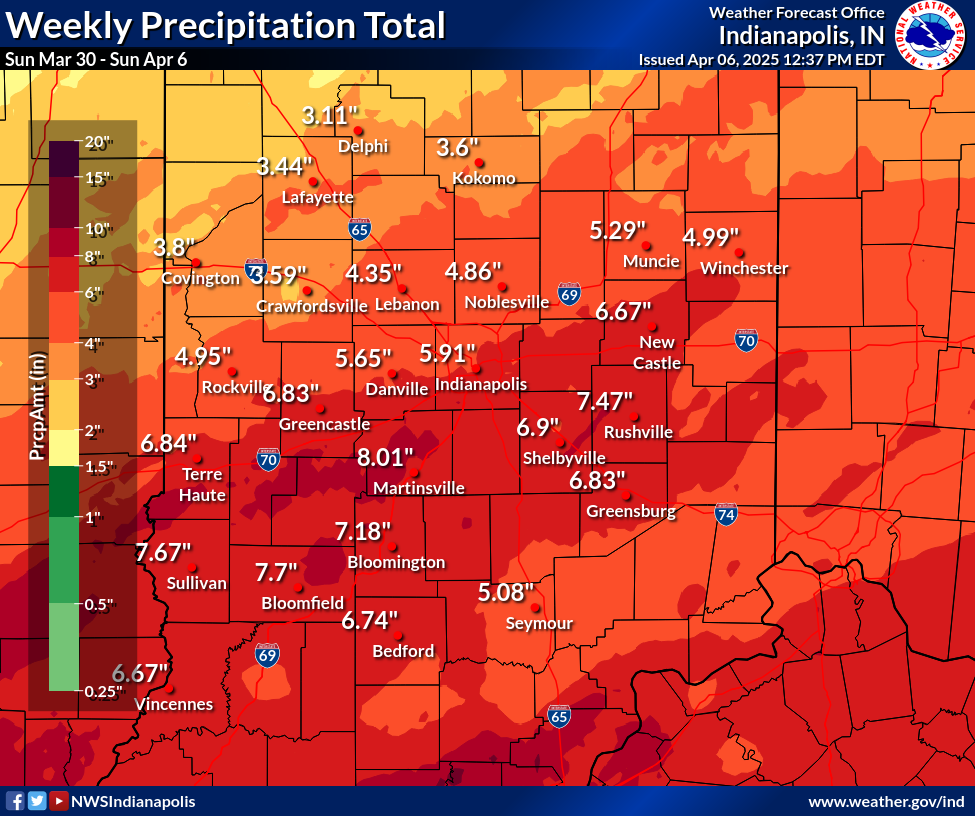
Below are plots of rainfall totals for 96 hour and weekly time periods.
 |
 |
 |
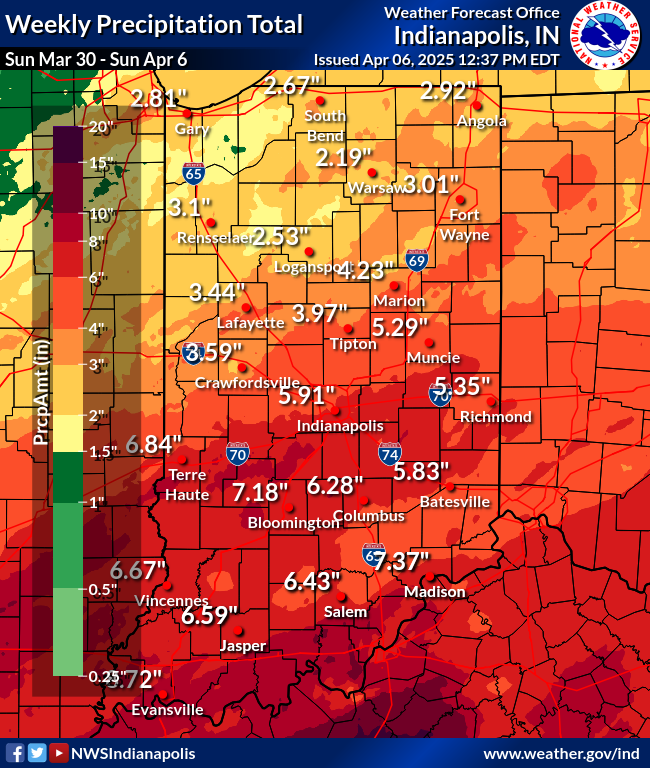 |
| 96 Hour Central Indiana Totals | 96 Hour Indiana Totals | 1 Week Central Indiana Totals | 1 Week Indiana Totals |
Flooding
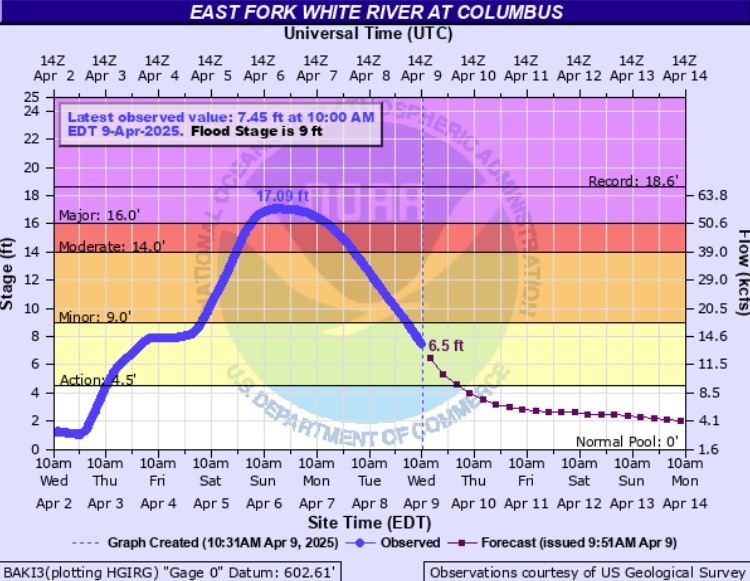
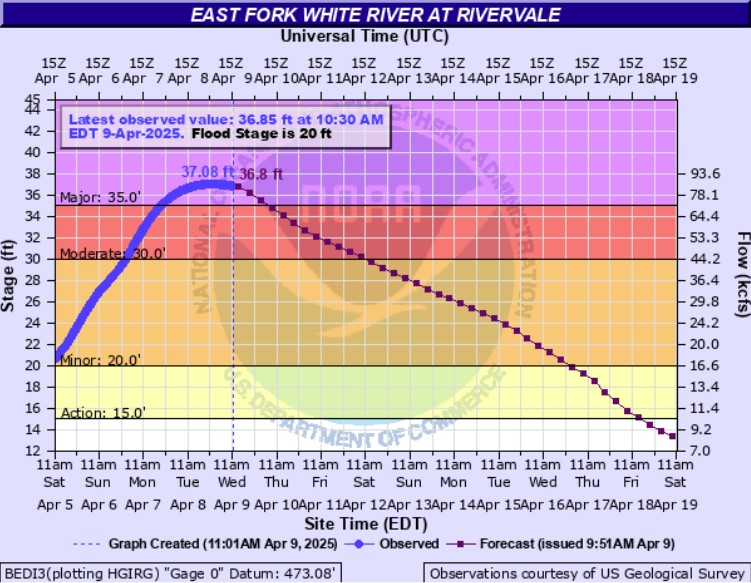
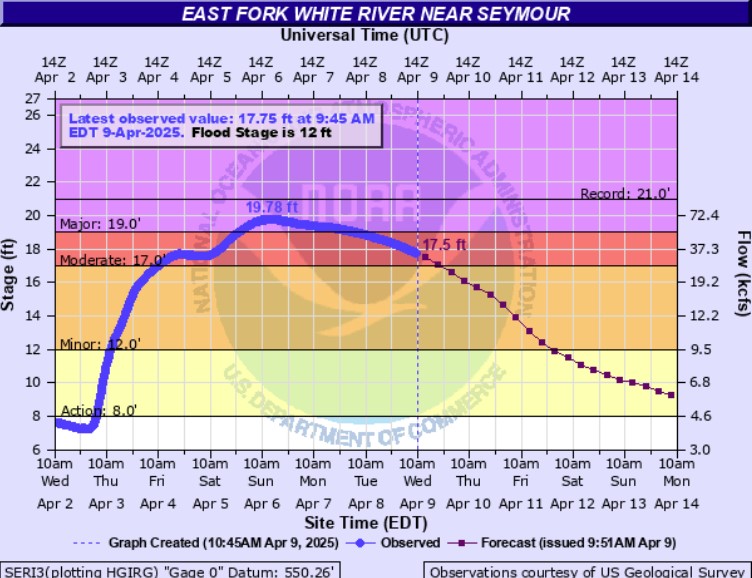
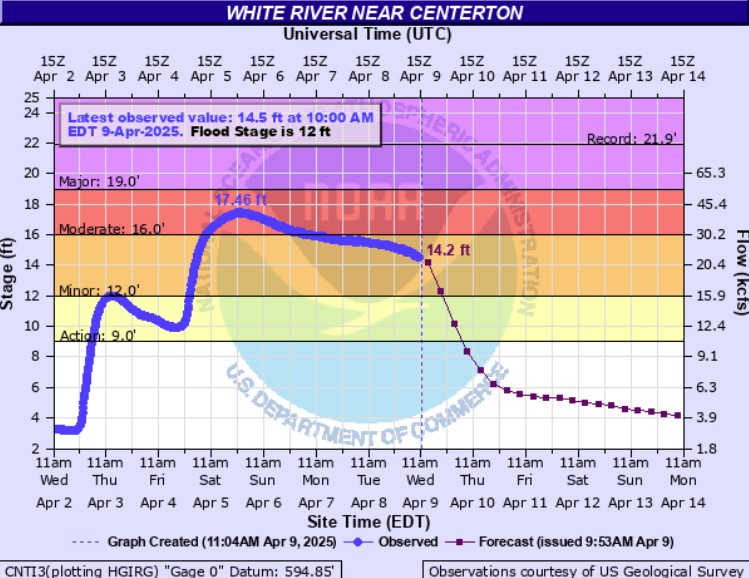
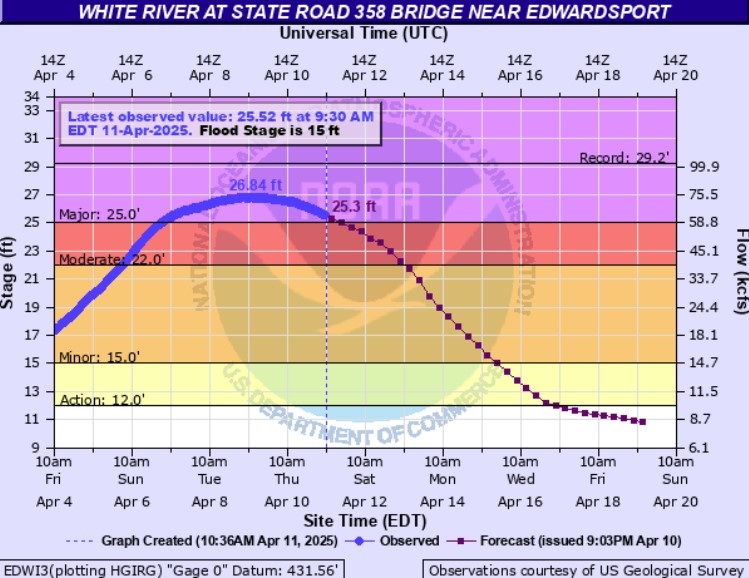
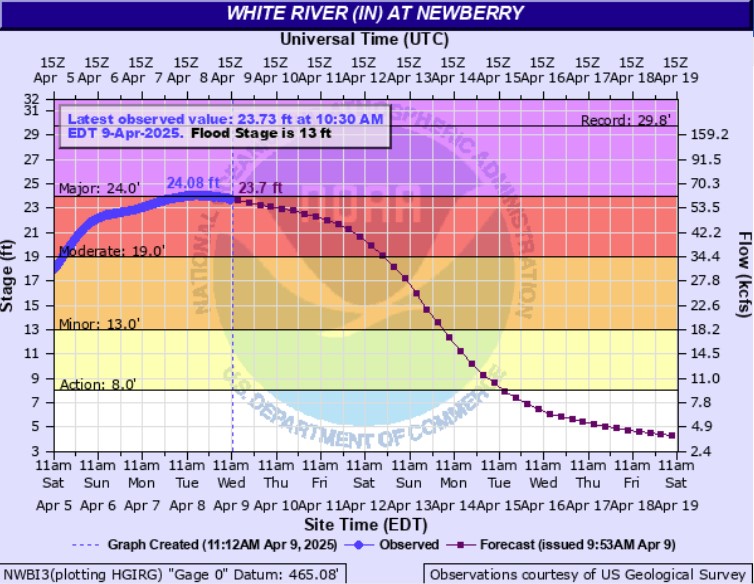
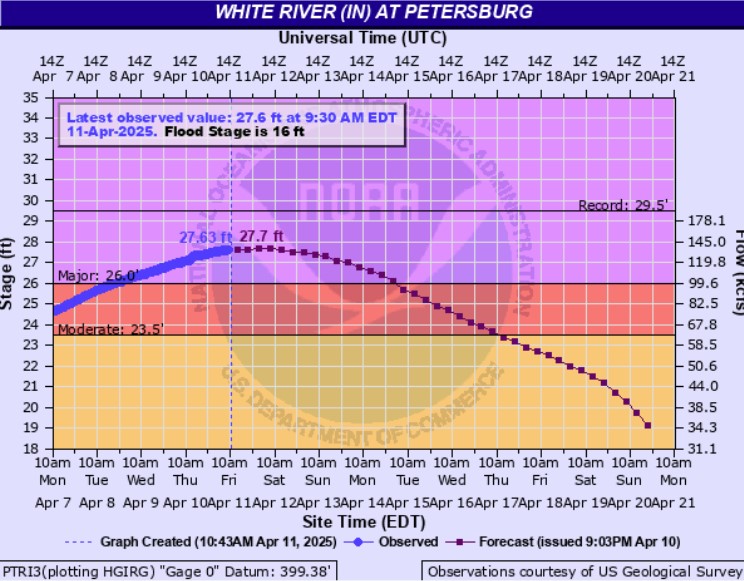
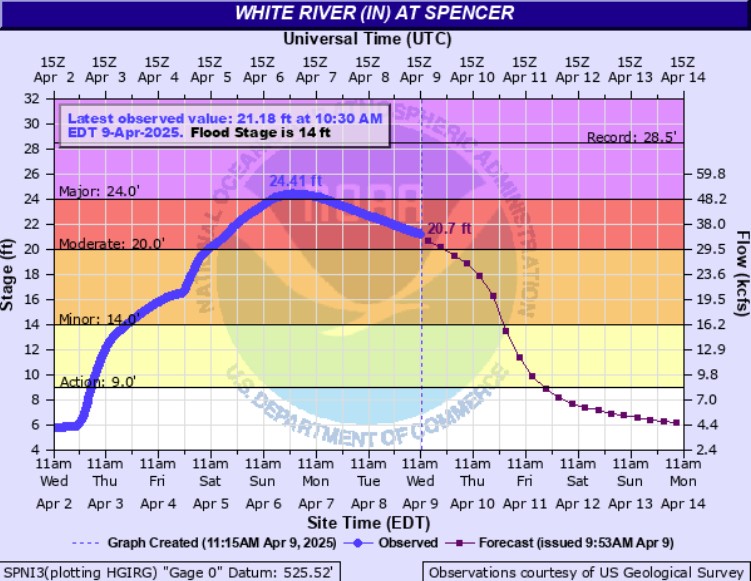
River flooding occurred along many central Indiana rivers. Some rivers reached Major stage, with some reaching top 5 crests (see Top 5 Tab).
Hydrographs
 |
 |
 |
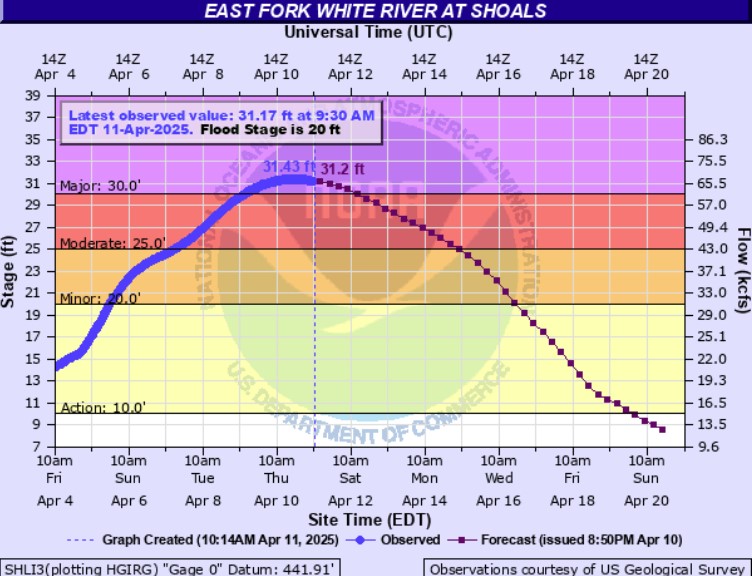 |
| East Fork White at Columbus | East Fork White at Rivervale | East Fork White at Seymour | East Fork White at Shoals |
 |
 |
 |
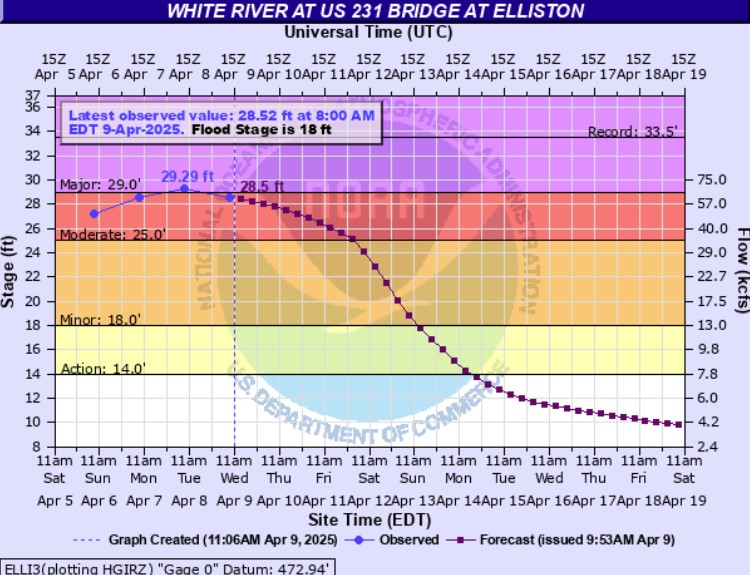 |
| White River at Anderson | White River at Centerton | White River at Edwardsport | White River at Elliston |
 |
 |
 |
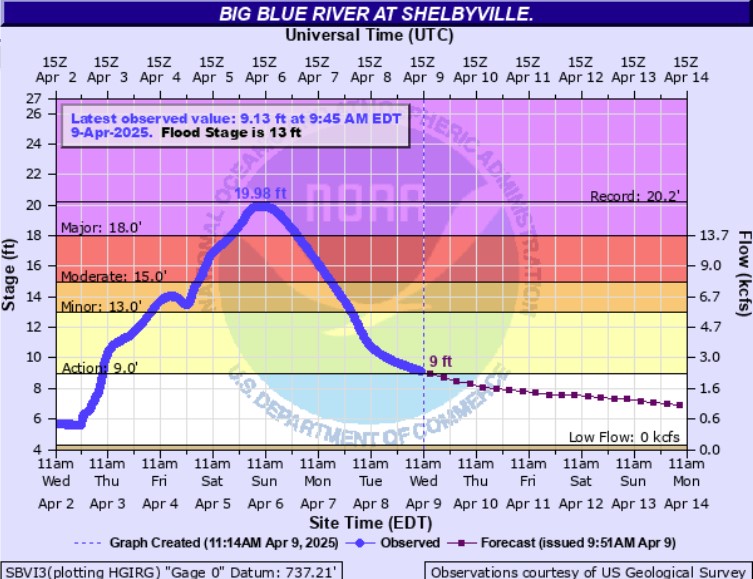 |
| White River at Newberry | White River at Petersburg | White River at Spencer | Big Blue River at Shelbyville |
Top 5 Crests
Some areas had crests that reached the top 5 of all time crests (data through April 8, 2025):
|
1 |
20.20 ft |
on 03-28-1913 |
|
2 |
19.98 ft |
on 04-06-2025 |
|
3 |
18.43 ft |
on 01-06-2005 |
|
1 |
18.61 ft |
on 06-08-2008 |
|
2 |
17.90 ft |
on 03-27-1913 |
|
3 |
17.09 |
On 04-06-2025 |
|
4 |
17.05 ft |
on 01-07-2005 |
|
1 |
21.00 ft |
on 03-26-1913 |
|
2 |
20.91 ft |
on 06-08-2008 |
|
3 |
19.78 ft |
on 04-06-2025 |
|
4 |
19.67 ft |
on 01-05-1949 |
|
1 |
47.60 ft |
on 03-29-1913 |
|
2 |
38.00 ft |
on 01-24-1937 |
|
3 |
37.84 ft |
on 01-09-2005 |
|
4 |
37.08 ft |
on 04-09-2025 |
|
5 |
36.32 ft |
on 05-01-1996 |
|
1 |
28.50 ft |
on 03-26-1913 |
|
2 |
26.84 ft |
on 06-08-2008 |
|
3 |
25.08 ft |
on 01-07-2005 |
|
4 |
24.41 |
on 04-07-2025 |
|
5 |
23.95 ft |
on 01-01-1991 |
Environment
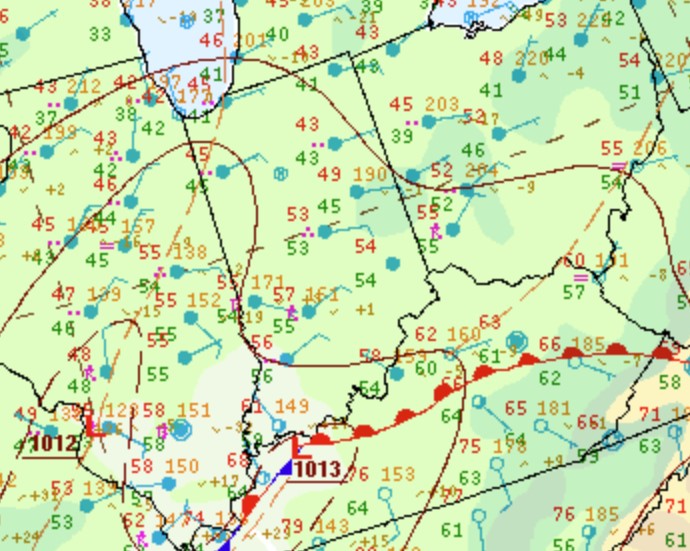
A surface front repeatedly moved north and south across central Indiana as waves of low pressure moved along it. This, along with very high moisture levels for early April led to the heavy rain and subsequent flooding.
 |
 |
 |
| Figure 1: Zoomed in Surface Map at 11pm EDT April 4 | Figure 2: Precipitable Water and 850mb Moisture Transport at Midnight EDT April 5 | Figure 3: 925-850mb Moisture Transport at Midnight EDT April 5 |
Nearby Soundings:
 |
 |
| Figure 4: Central Illinois (ILX) Sounding from 8pm EDT April 4. Precipitable Water value was near the record high amount for the date. | Figure 5: Wilmington, OH (ILN) Sounding from 8pm EDT April 4. Precipitable Water value was near the record high amount for the date. |
 |
Media use of NWS Web News Stories is encouraged! Please acknowledge the NWS as the source of any news information accessed from this site. |
|

