March 7-10, 2016
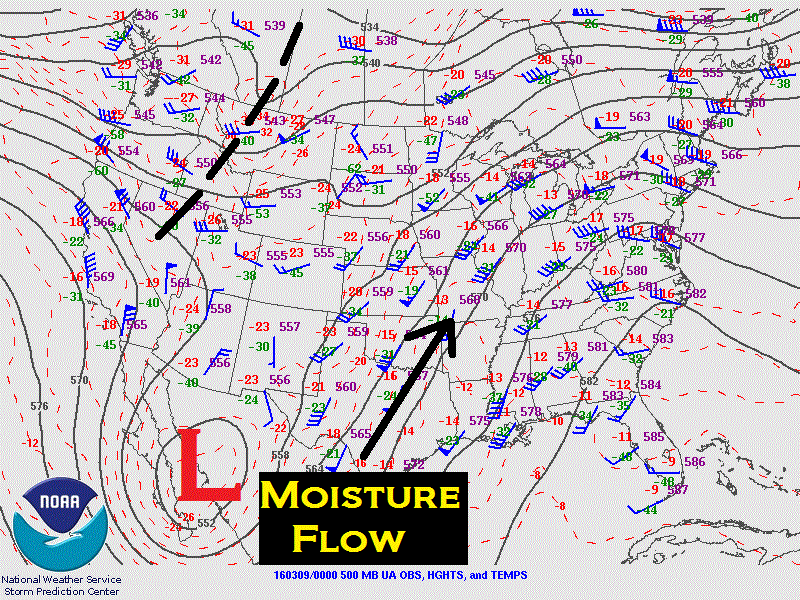
The heavy rain that was expected across much of central and southeast Illinois during the week of March 7-10, 2016 never materialized. So what exactly went wrong with the forecast? Where did the rain end up falling? As it turns out, two processes that were not well handled by the computer models acted in tandem to prevent heavy rain across the area. The basic upper air set-up featured a deep low pressure over northwest Mexico, which was expected to produce a significant flow of deep-layer moisture northeastward into the Midwest and Ohio Valley. The map below shows the upper pattern during the evening of Tuesday, March 8th. Note the low over northwest Mexico, with moisture flowing northeastward across Texas into the Ozarks. Also note a weaker disturbance (dashed black line) over the Northern Rockies. This feature would play a key role in the evolution of the heavy rain producing system over the following days.
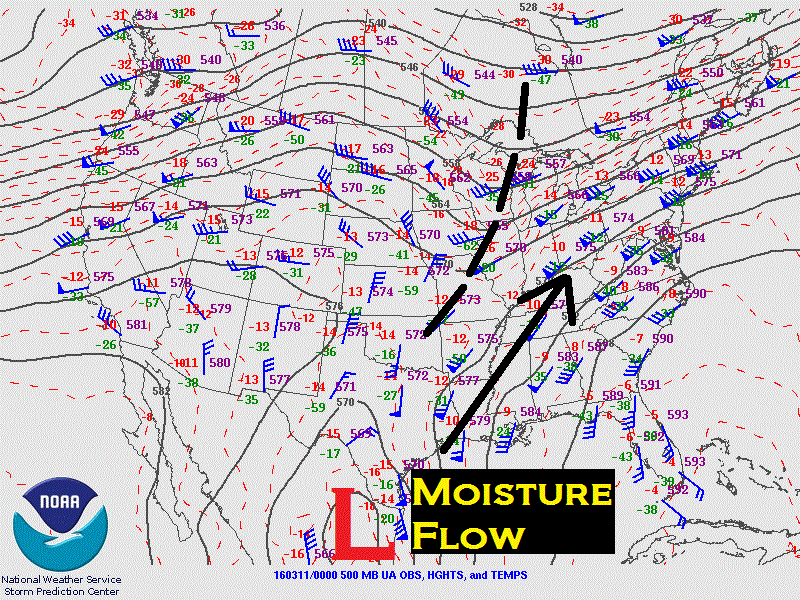
So with this favorable set-up why was the rainfall on the light side across much of central Illinois? First of all, the upper low ended up digging further south than initially thought. In the days prior to the system's arrival, computer models had consistently tracked it across the Southern Plains into south Texas. This kept central Illinois further displaced from the strongest forcing associated with the low. Secondly, the disturbance over the Northern Rockies was poorly handled by the models. This feature tracked eastward across the Northern Plains and Upper Midwest, pushing a nearly stationary frontal boundary further east and south than expected. This essentially shunted the moisture flow into the Ohio River Valley rather than central Illinois. The map below shows the upper pattern by the evening of Thursday, March 10th. The upper low has tracked eastward across northern Mexico, while the weaker disturbance has now moved into the Midwest. Note the main moisture flow has been pushed further southeast into the Ohio River Valley.
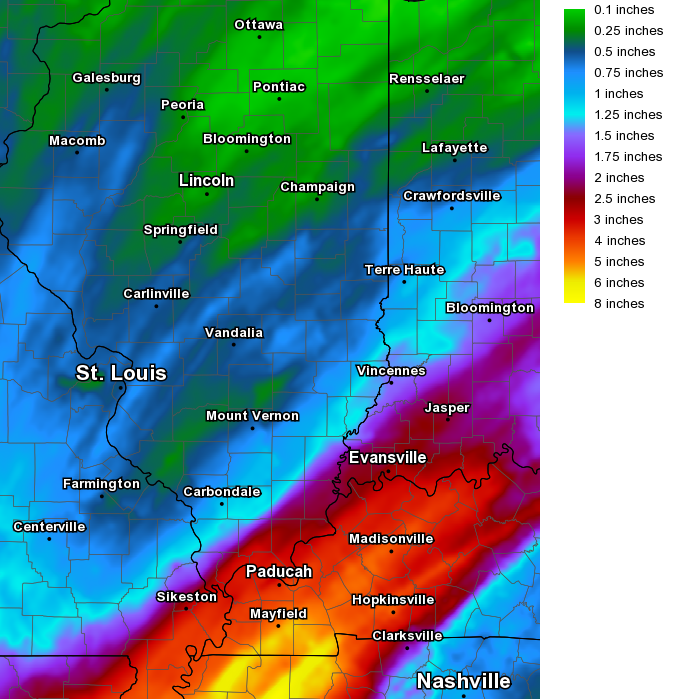
While rain did indeed fall across all of central and southeast Illinois, the axis of heaviest rainfall developed further southeast from the Ozarks into the Ohio River Valley. Widespread amounts of 3 to 5 inches were reported in this area, with as much as 6 inches across western sections of Tennessee and Kentucky. Further north across the Lincoln NWS County Warning Area (CWA), much lighter amounts of one quarter to three quarters of an inch were common. The highest totals in our area were focused southeast of the I-70 corridor, with Lawrenceville coming in as the big winner at 1.37. Below is a map of the rainfall measured from March 7th through March 10th.