2025 Spring Flood Outlook for Central and Southeast Illinois
Probabilistic Hydrologic Outlook
National Weather Service Lincoln IL
352 PM CDT Thu Mar 13 2025
...2025 Spring Flood and Water Resources Outlook Number 3...
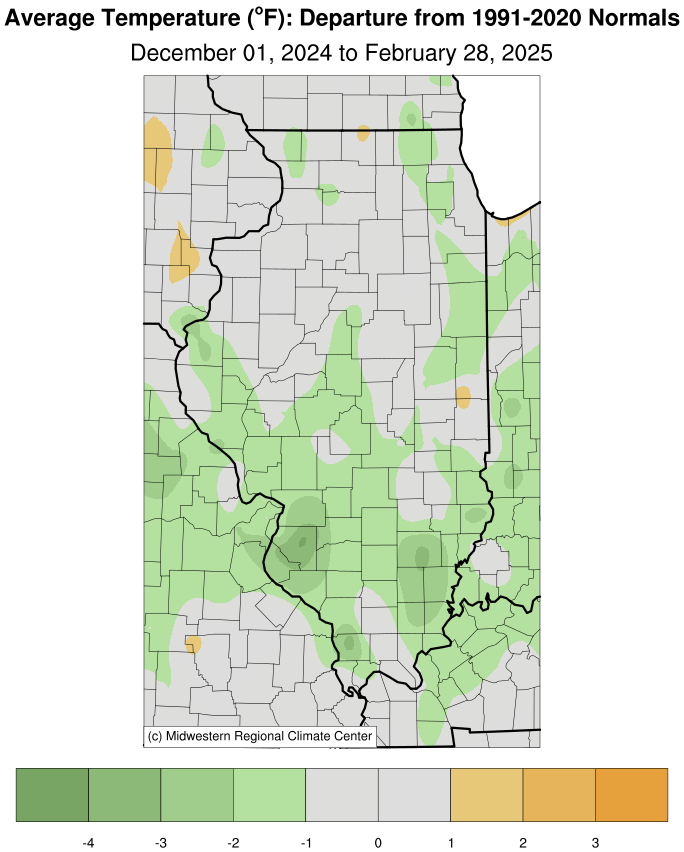
...Near normal to below normal likelihood for springtime flooding
across central and southeast Illinois...

This flood outlook covers the Lincoln Hydrologic Service Area (HSA)
which encompasses 35 counties in central and southeast Illinois. It
includes the following rivers...

- Illinois River from Henry to Beardstown
- Spoon River from London Mills to Seville
- Mackinaw River at Congerville
- Sangamon River from Monticello to Chandlerville
- Salt Creek at Greenview
- Little Wabash River near Clay City
- Embarras River from Ste. Marie to Lawrenceville

These flood outlooks are issued in late winter and early spring, in
addition to the 7 day river forecasts that are issued when river forecast
locations are in flood or are forecast to rise above flood stage. They
are based on multi-season scenarios from more than 30 years of
climatological data, current streamflows, soil conditions, snow pack, as
well as short/long range weather forecasts.


FLOOD OUTLOOK HIGHLIGHTS...
- Risk of flooding this spring is near normal to below normal across central and southeast Illinois. - Factors limiting flood potential this spring include: near normal to below normal streamflows, no local or upstream snowpack, thawed soils, deep layer soil moisture deficits. - Springtime rains will be the primary driver for flooding. WINTER WEATHER REVIEW... --December-- Statewide Temperatures/Precipitation:
Information, courtesy of the Illinois State Climatologist, shows that
the preliminary statewide average temperature in December was 33.4
degrees. This was 1.8 degrees below normal and tied for 36th warmest
on record going back to 1895.
Day to day temperature variability in Illinois is highest in
climatological winter, and December followed suit with regular dips
and jumps in daily temperature. Daily average temperatures were 10 to
20 degrees below normal in the first week of the month, were 15 to 25
degrees above normal in the final week of the month, and jumped
around in between.
When taken altogether, December average temperatures ranged from high
20s in northern Illinois to the low 40s in southern Illinois, between
1 and 5 degrees above normal. The warmest place in the state was
Olmstead in Pulaski County with an average December temperature of
41.4 degrees. The coolest place in the state was Stockton in Jo
Daviess County with an average December temperature of 26.6 degrees.
The milder days in December broke 3 daily high maximum temperature
records and 54 daily high minimum temperature records. Meanwhile the
cooler days broke 23 daily low maximum temperature records and 6
daily low minimum temperature records in Illinois.
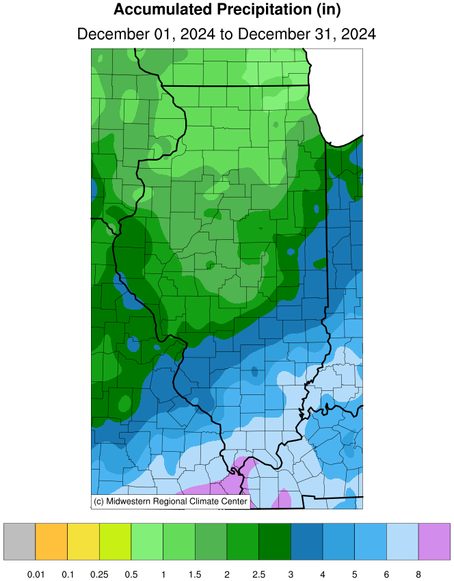
The preliminary statewide average total December precipitation was
2.90 inches, 0.47 inches above normal and tied for 31st wettest on
record statewide.
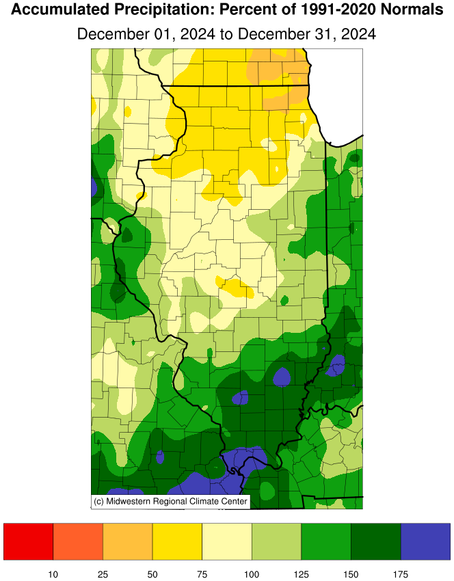
December wasnt a washout anywhere but brought enough precipitation
to continue improving water conditions from peak fall drought.
December total precipitation ranged from over 6 inches in far
southern Illinois to around 1.5 inches in northern Illinois. Most
areas of the state south of Interstate 64 were 1 to 3 inches wetter
than normal last month, while parts of northern Illinois were around
1 inch drier than normal.
The wettest part of the state was, again, Olmstead in Pulaski County,
which picked up just over 10 inches in the final month of the year.
The driest place in the state in December was Freeport, with only
0.89 inches for the month.
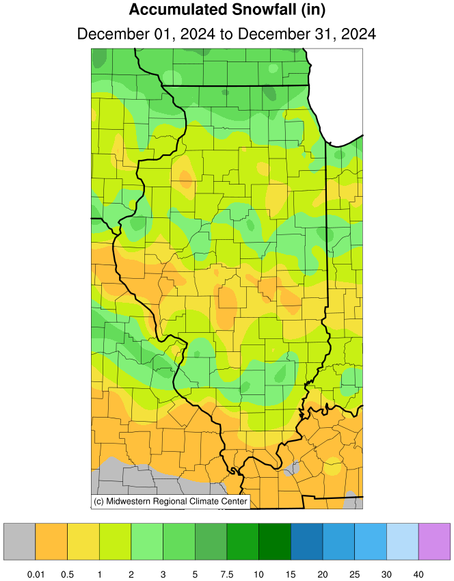
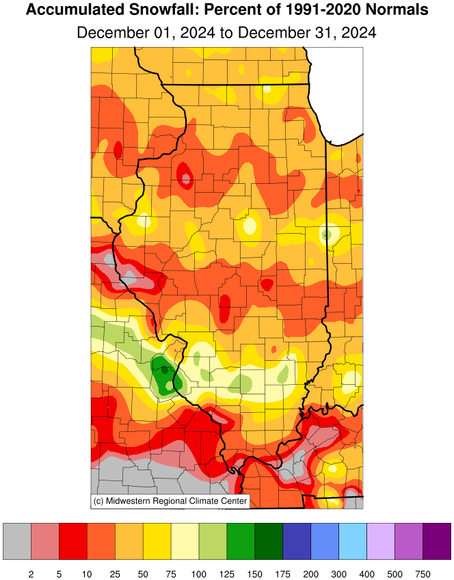
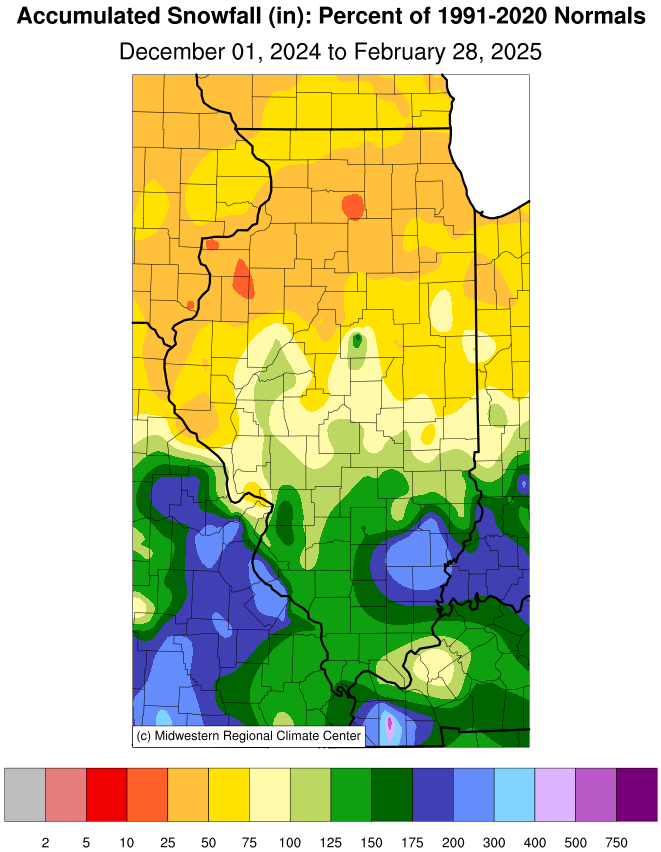
As is often the case in milder Decembers, snowfall was a little
harder to come by across Illinois. December total snowfall ranged
from around 5 inches in far northern Illinois to less than a tenth of
an inch in far southern Illinois, between 1 and 6 inches below
normal. Snowfall so far this season has also been below normal across
Illinois, to the tune of 1 to 10 inches.
Local Temperatures/Precipitation/River Conditions:
Temperature averages for December were well above normal across the
ILX Hydrologic Service Area (HSA). Temperatures generally ranged from
2 to 4 degrees above normal. Daily high temperatures ranged from the
teens to the low 60s. Normal highs for December typically range from
the low 30s to the mid 40s. Low temperatures across the area ranged
from the single digits to the upper 40s. They typically range from
the teens to the upper 20s.
Rainfall totals across the ILX HSA were a mixed bag in December.
Southern sections of our HSA were well above normal for the month,
while other areas were below normal. Monthly precipitation generally
ranged from 1.53 inches in Lacon to 4.82 inches in Lawrenceville.
These totals ranged from 0.64 inches below normal to 2.16 inches
above normal, respectively. This equates to roughly 70 to 180 percent
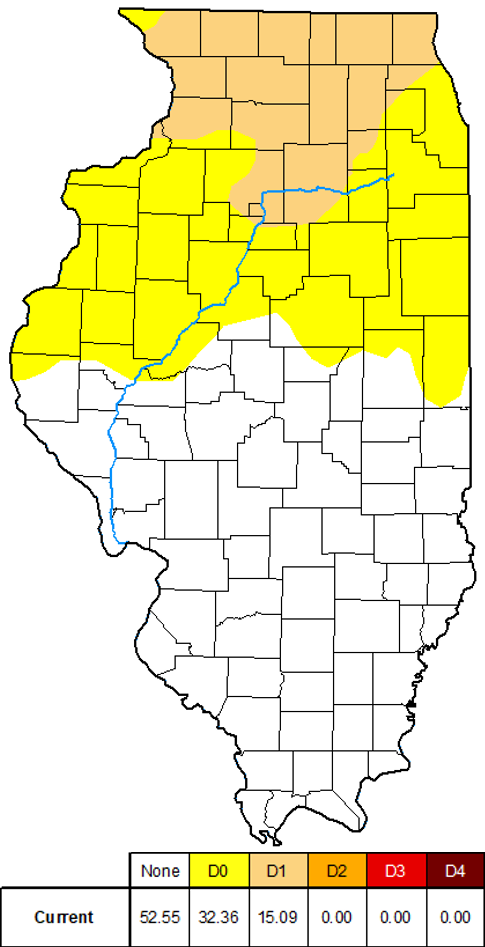
of normal precipitation for the month. Although drought conditions
saw slight improvement across the state, nearly 60 percent of
Illinois remained in some form of drought. Nearly 40 percent were in
D0 conditions (Abnormally Dry), while 30 percent were in D1 (Moderate
Drought).
Flooding was observed, albeit brief, along the Little Wabash River
below Clay City in our southeast HSA. This was in conjunction with
the heaviest rains in our area. However, the flooding was minor and
only lasted a couple of days into the new year.
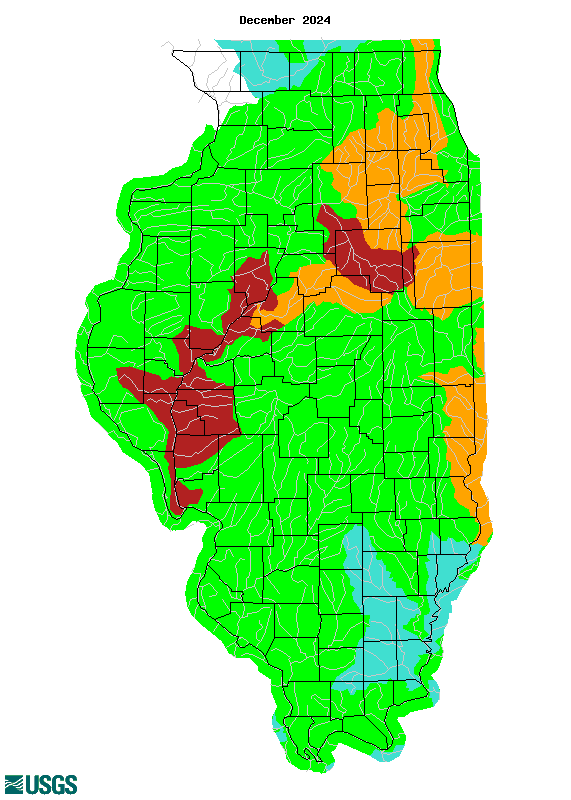
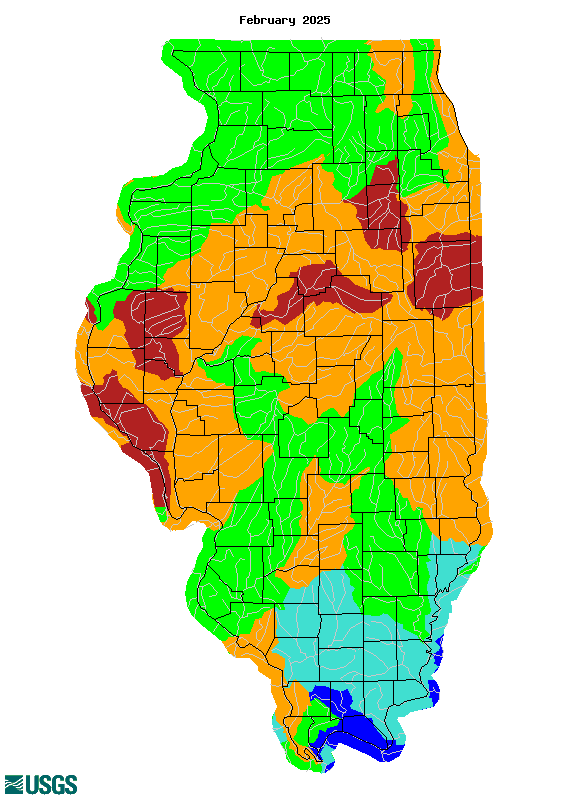
U.S. Geological Survey (USGS) monthly average streamflow values for
December show that most of the state was in the normal range. There
were outliers, however. The most notable was the Illinois River
basin, with streamflows that were well below normal for the month.
--January--

Statewide Temperatures/Precipitation:
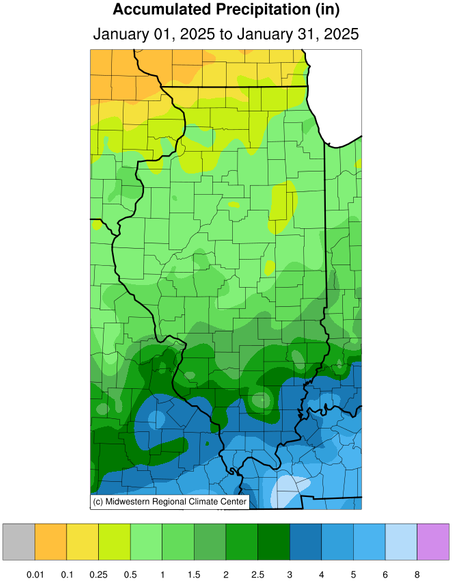
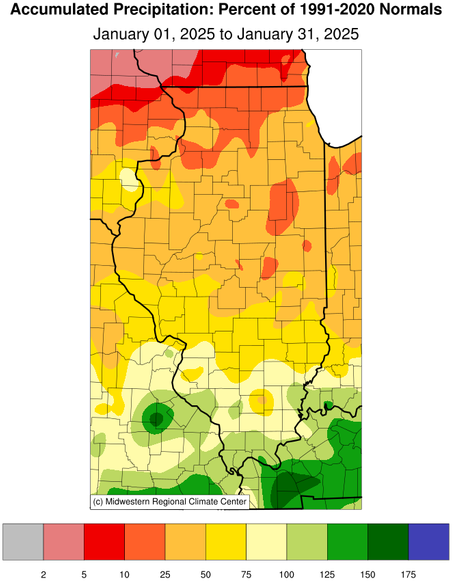
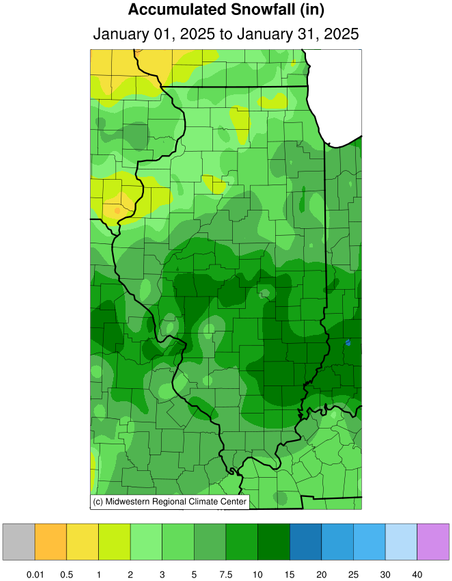
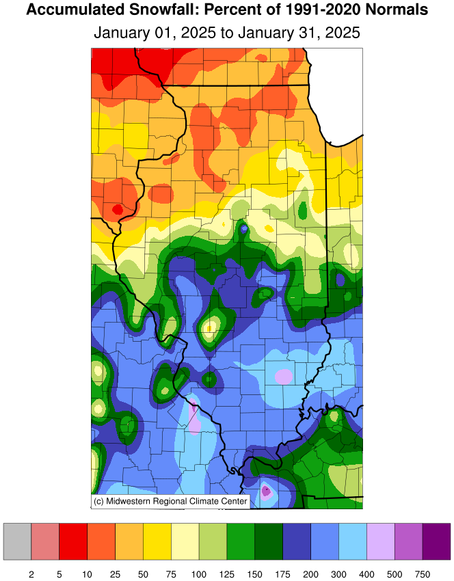
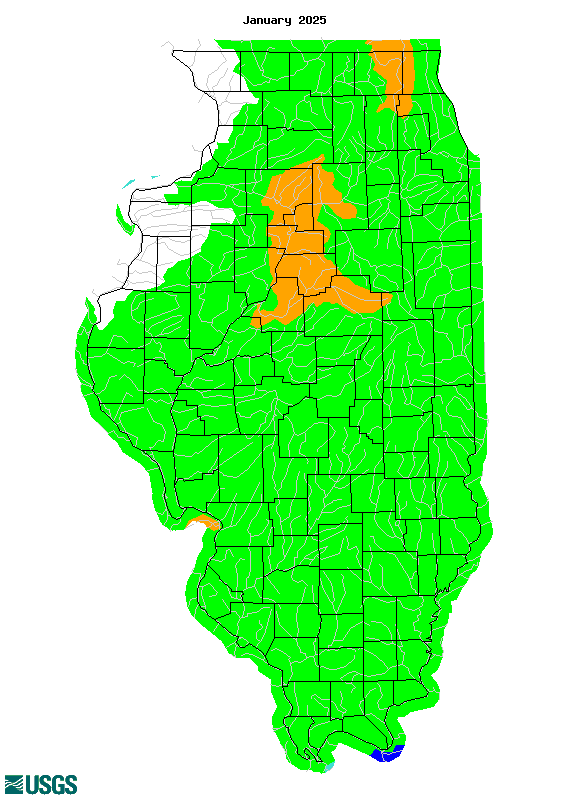
The Illinois State Climatologist notes that the preliminary statewide
average temperature in January was 22.3 degrees. This was 4.4 degrees
below normal and tied for the 34th coldest on record going back to
1895.

All four of Illinois distinct seasons are getting warmer. However,
winter is warming far faster than the other seasons. As a result, we
have experienced many more mild winters in recent decades. This trend
made Januarys persistently cold weather seem particularly extreme.
Daily temperatures and departures from normal show much of the first
and third weeks of the month had temperatures that were consistently
5 to 30 degrees below normal.

January average temperatures ranged from the high teens in northwest
Illinois to the low 30s in southern Illinois, between 2 and 8 degrees
below normal. Persistent snowpack in southern Illinois helped depress
temperatures farther below normal than in relatively snowless
northern Illinois. The warmest point in the state last month was Du
Quoin at 31.7 degrees, and the coldest point in the state was
Stockton at 16.9 degrees. The few warm spells in January broke 10
daily high maximum temperature records. The extreme cold in the
middle of the month broke 23 daily low maximum temperature records
and 15 daily low minimum temperature records, including -20 degrees
in Springfield.

The preliminary statewide average total January precipitation was
1.25 inches, 1.06 inches below normal and tied for the 32nd driest on
record statewide.

Depending on who you talk to, January was either a very active winter
weather month or quite a boring one. An active storm track setup
across the southern half of the state in the first week of January,
pushing multiple winter storms through the state, which produced
multiple rounds of heavy snow mostly along and south of Interstate
70. The result was a strong gradient of snowfall opposite of what is
typical for this time of the year, with more in southern Illinois
than northern Illinois.

January total snowfall ranged from over 12 inches in south-central
Illinois to less than 1 inch in northwest Illinois. Much of the
southern half of the state had 1 to 8 inches more snowfall than
normal in January, while northern Illinois racked up snowfall
deficits of 1 to 8 inches. This was the fifth snowiest January on
record in Fairfield with 15.6 inches and the snowiest since 1996.
Meanwhile, Moline had only 2.3 inches of snow in January, the lowest
amount since 2018 and fourth lowest there since 1989.

Other than a couple of noteworthy snow and ice events, January was
otherwise mostly dry across Illinois. Total January precipitation
ranged from just over 5 inches in far southern Illinois to less than
a quarter of an inch in far northwest Illinois. Most of northern and
central parts of the state were around 1 to 2 inches drier than
normal last month and only the southern seven counties were wetter
than normal.

Local Temperatures/Precipitation/River Conditions:

Temperature averages for January were well below normal across the
ILX HSA. Temperatures generally ranged from 3 to 7 degrees below
normal. Daily high temperatures ranged from the single digits to the
low 50s. Normal highs for January typically range into the low to mid
30s. Low temperatures across the area ranged from the single digits
below zero to the upper 30s. They typically range into the teens.

Liquid precipitation totals across the ILX HSA were overall below
normal for January, with a few exceptions. Monthly precipitation
generally ranged from 0.44 inches in Hoopeston to 2.59 inches in
Mackinaw. These totals ranged from 1.68 inches below normal to 0.42
inches above normal, respectively. This equates to roughly 20 to 120
percent of normal precipitation for the month. Drought conditions
continued to improve, mainly across portions of central Illinois.
D0-D1 conditions went from 60 percent coverage, down to 35% in
January. By the of the month, drought conditions were largely
confined to the northern third of Illinois.

The only river flooding in the HSA was a carryover from December.
Minor flooding was briefly seen along the Little Wabash River below
Clay City. However, it quickly came to an end in early January.

The persistently cold temperatures in January caused appreciable ice
development on area rivers. Thankfully, temperatures in the last week
of January and into February allowed for considerable melting. There
were many instances of the ice melting in place along the smaller
creeks and streams. However, we did observe ice flowing down many of
the larger rivers in our HSA. Thankfully, there was not much in the
way ice jam development.

USGS monthly streamflow for January shows that most of the state was
in the normal range. Outside of that, there were a couple of basins
in the below normal range across portions of central and northern
Illinois.
--February--

Statewide Temperatures/Precipitation:
Information, courtesy of the Illinois State Climatologist, shows that
the statewide average February temperature was 28.4 degrees, 2.7
degrees below normal and the 52nd coldest on record going back to
1895. The preliminary statewide average total February precipitation
was 1.25 inches, 0.85 inches below normal and the 29th driest on
record statewide.
February often brings some of the largest day-to-day temperature
swings in Illinois. As an example, the first week in Decatur was
consistently 5 to 20 degrees warmer than normal, followed by more
than two weeks of average temperatures that were 10 to 25 degrees
below normal. The last week of the month brought some milder weather
to gently guide us into spring.
February average temperatures ranged from the high 30s in southern
Illinois to the low 20s in northern Illinois, between 1 and 6 degrees
below normal. During the peak of extreme cold in mid-February,
several stations saw nighttime temperatures that were well below
zero, including -15 degrees in McHenry and -12 in Freeport. The
warmest place in the state in February was Crab Orchard in Williamson
County with an average of 38 degrees, and the coldest place in the
state was Mount Carroll in Carroll County with an average temperature
of 19.9 degrees.
The milder weather in the first and last weeks of the month broke 24
daily high maximum temperature records and 15 daily high minimum
temperature records. Meanwhile, the extreme cold in mid-February
broke 53 daily low maximum temperature records and 32 daily low
minimum temperature records. While last month was cold, it was not
close to a top 10 or 15 coldest February on record anywhere in
Illinois.
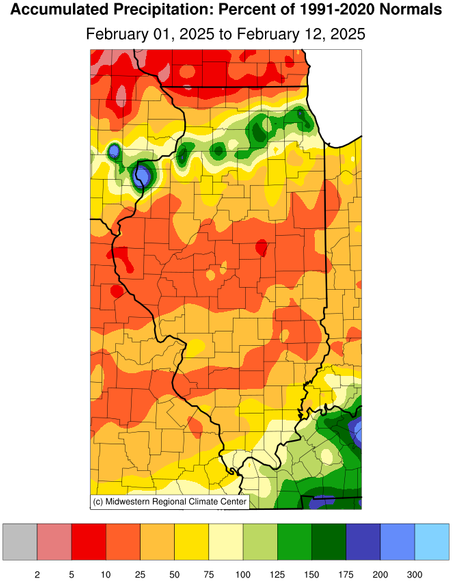
February is normally one of the driest months of the year. That held
true this year, at least in the northern two-thirds of the state.
Total February precipitation ranged from less than a quarter of an
inch in parts of far western Illinois to just over 7 inches in far
southern Illinois. Most of the state north of Interstate 64 was 1 to
3 inches drier than normal last month, while most of southern
Illinois was 1 to 3 inches wetter than normal.
This was the 4th driest February in Normal (0.21 inches), Quincy
(0.10 inches), and Galesburg (0.17 inches), the 7th driest in Peoria
(0.40 inches). Combined with a very dry January in central and
northern Illinois, 2025 to date has been the driest start to any year
on record in Bloomington-Normal and the 2nd driest start on record in
Champaign-Urbana.
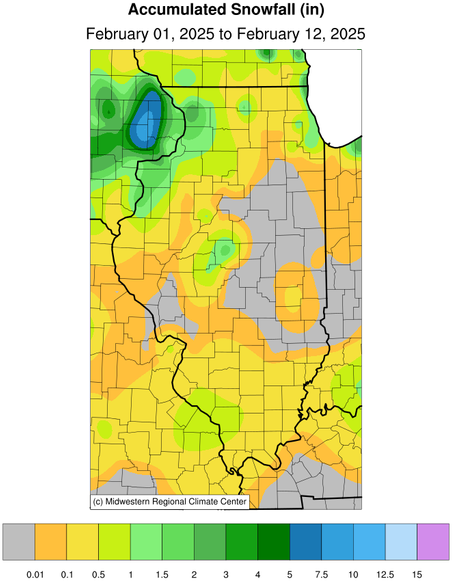
February total snowfall ranged from less than 2 inches in east-
central Illinois to over 12 inches in far northwest Illinois. Most of
the state south of Interstate 70 had 1 to 4 inches above normal
snowfall, while the rest of the state racked up snowfall deficits of
1 to 5 inches.
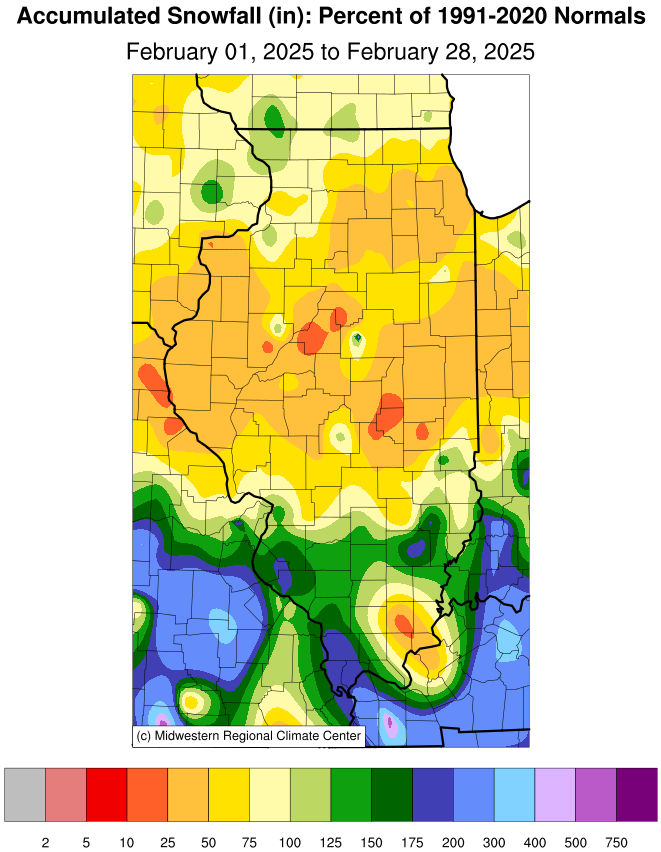
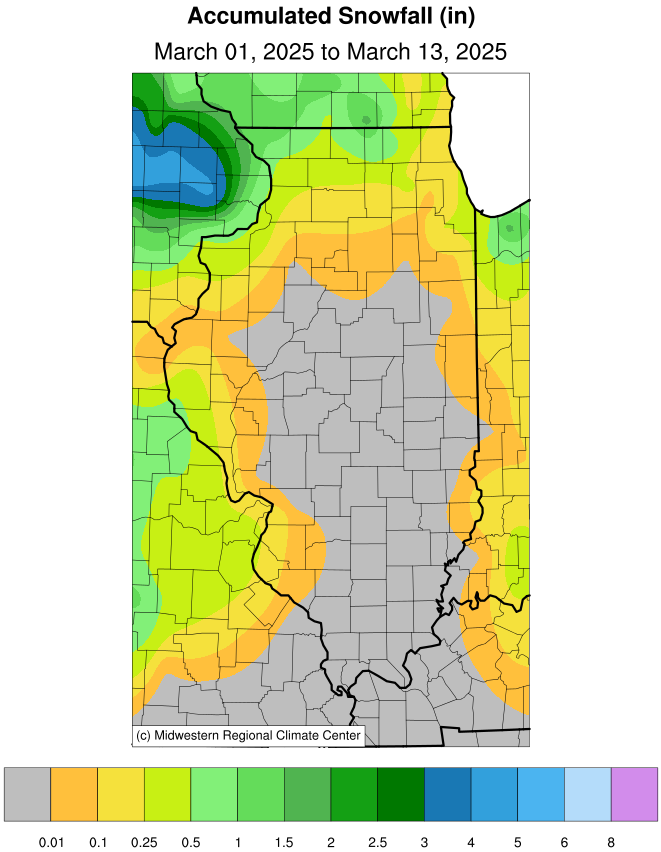
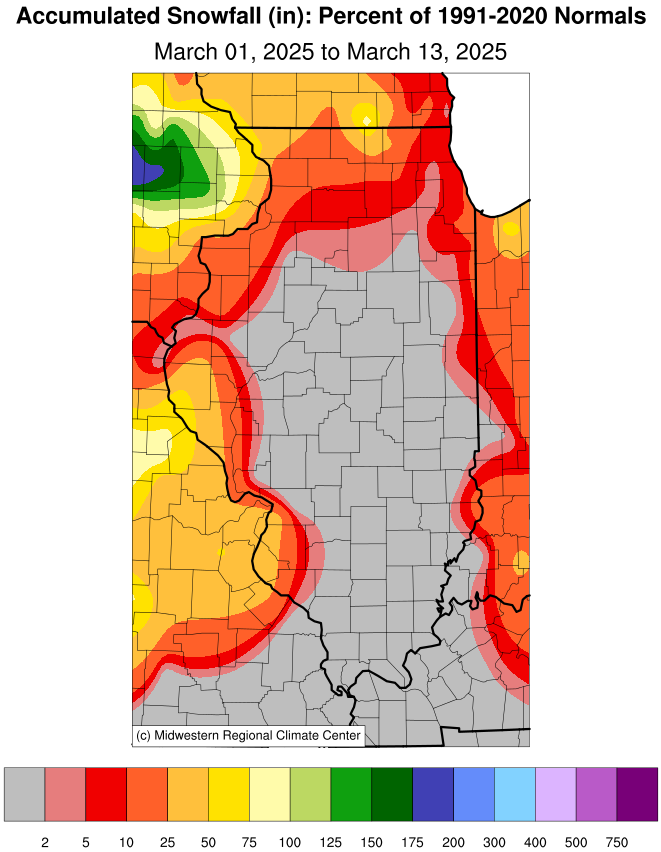
The snowfall season so far has set up an unusual pattern across
Illinois and the broader Midwest, with much of the southern half of
the region having slightly to significantly more snowfall than the
parts of the northern half. Southern Illinois has had 5 to 12 inches
above average snowfall so far this season, while northern Illinois
has experienced a 10 to 20 inch snowfall deficit so far.
Local Temperatures/Precipitation/River Conditions: Temperatures across the ILX HSA generally ranged from 1 to 2 degrees Liquid precipitation totals were overall below normal for February, The only river flooding in February occurred on the Little Wabash USGS monthly streamflows for February show that much of central
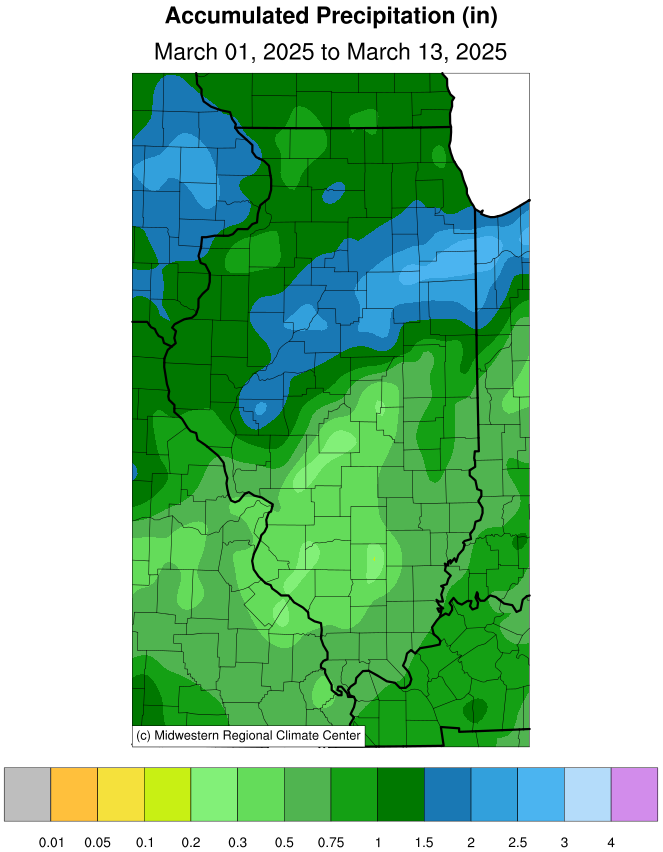
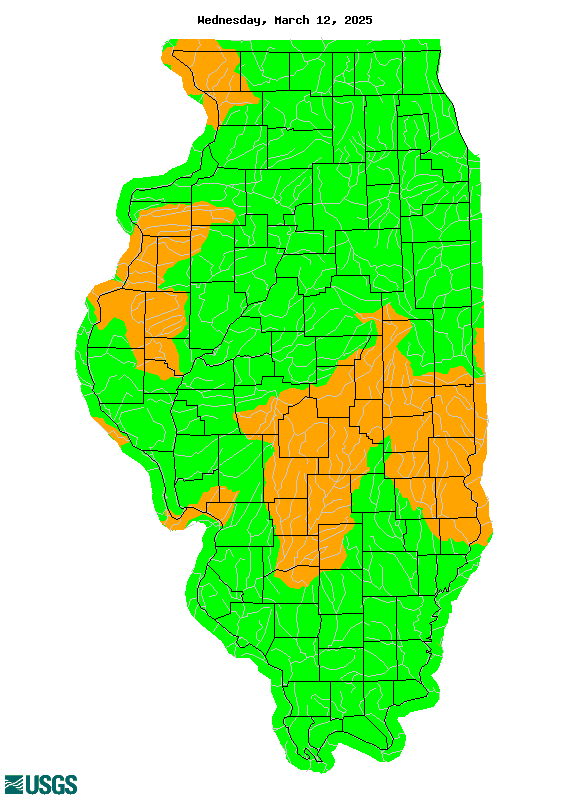
--March-- Local Temperatures/Precipitation/River Conditions: The month of March, to this point, has seen above normal daily USGS 7-day streamflows are in the normal to below normal categories
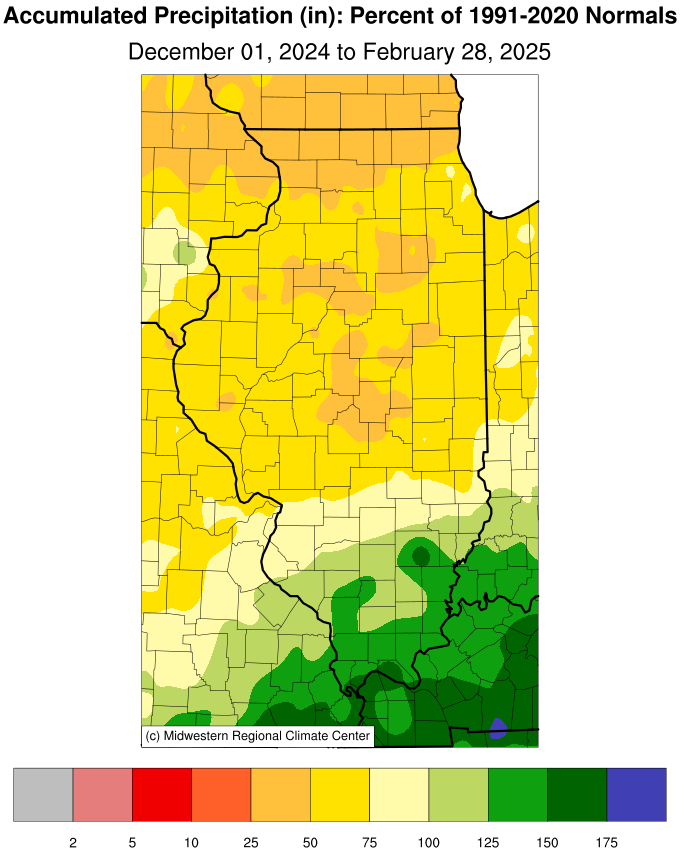
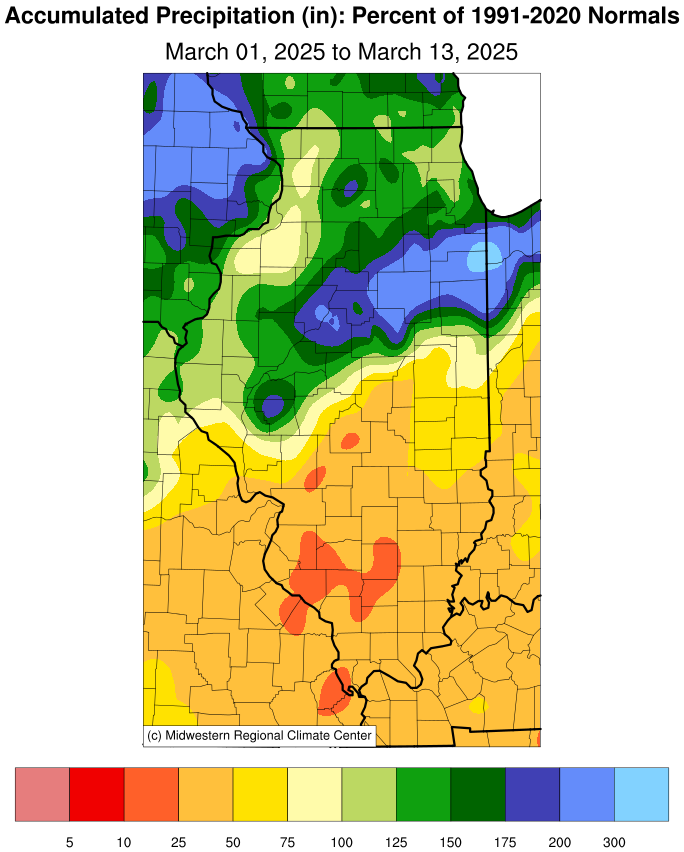
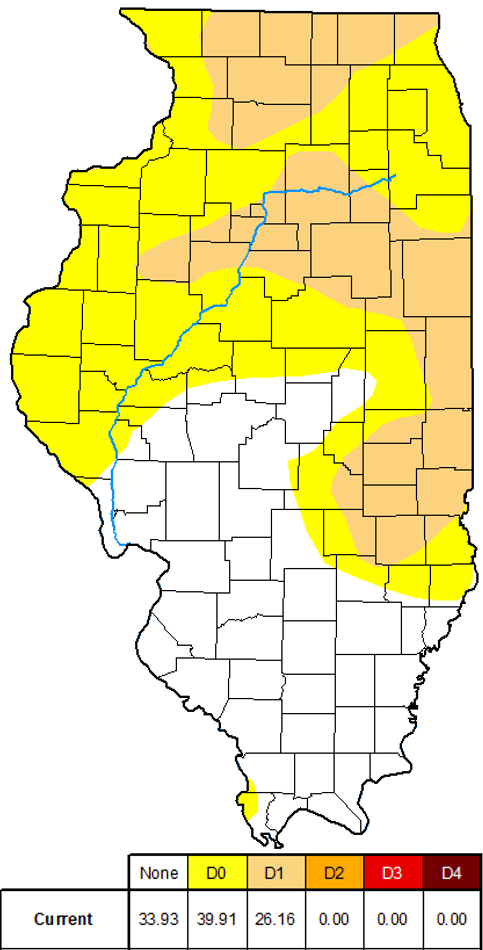
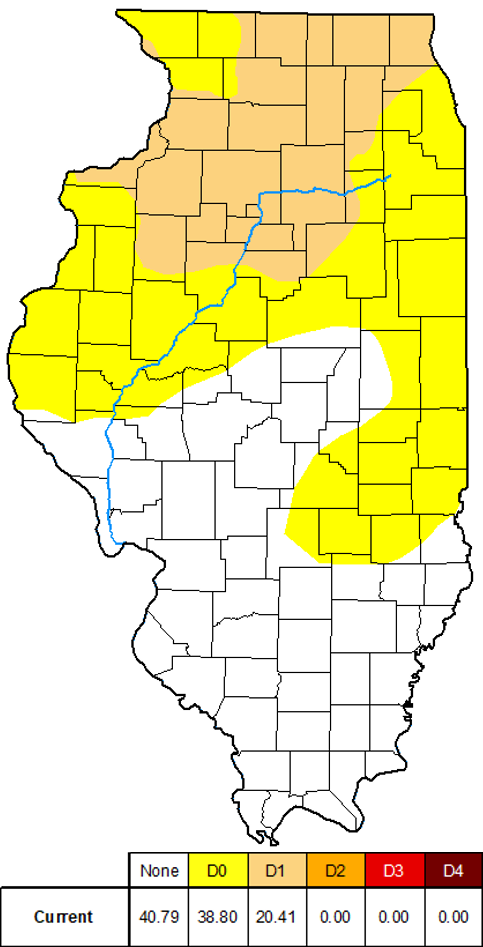
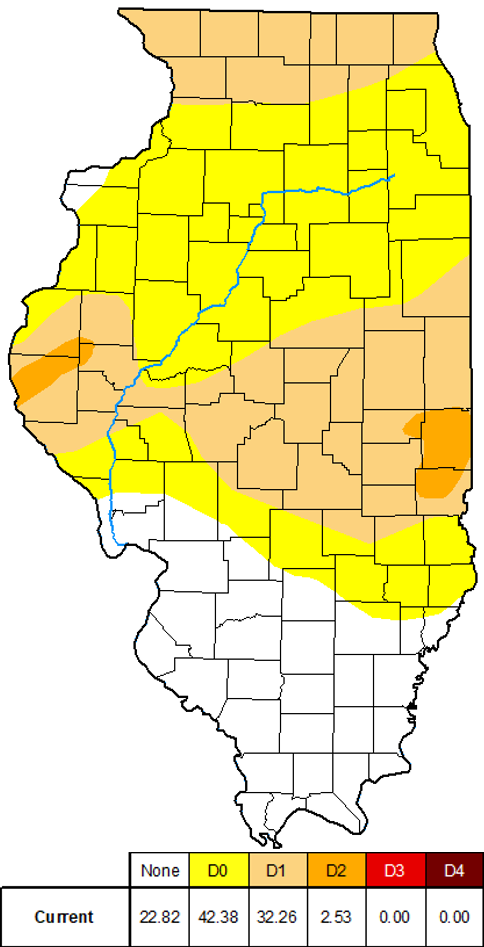
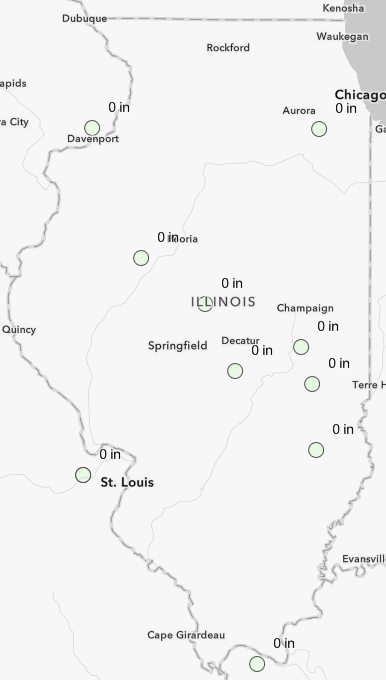
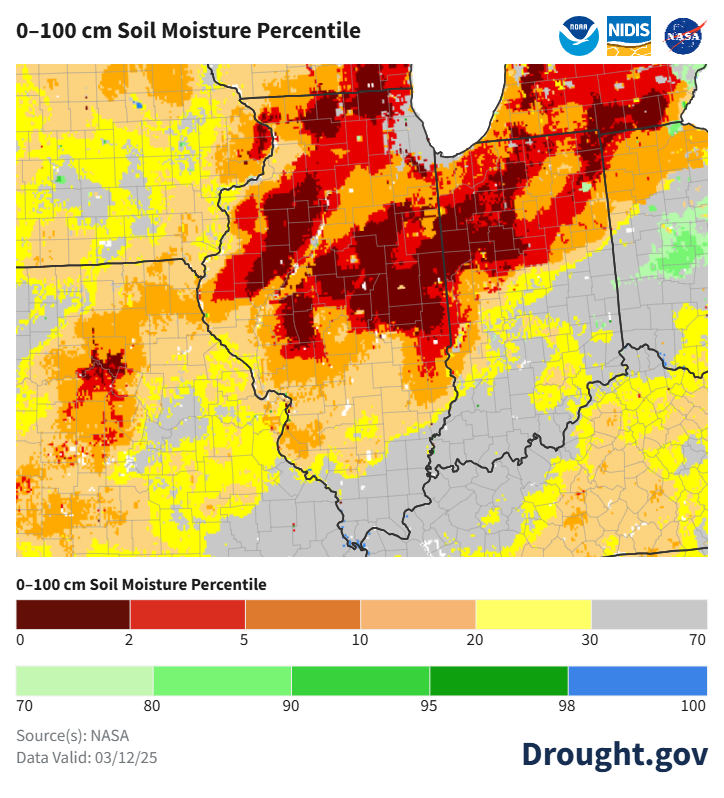
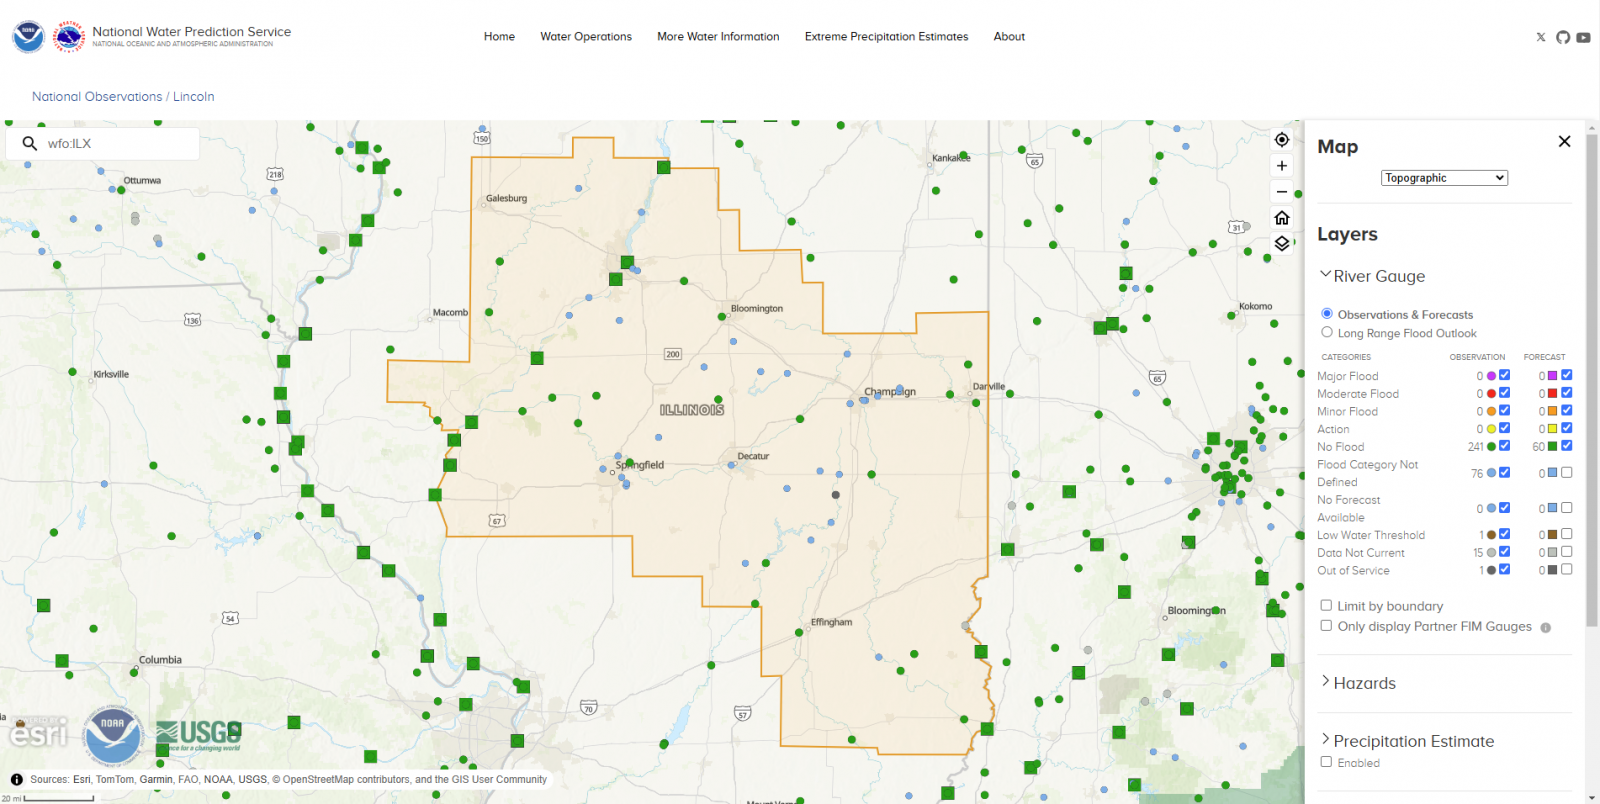
SOIL MOISTURE AND FROST DEPTH CONDITIONS...

Deep layer soil moisture conditions (down to 39 inches) across
central Illinois are well below normal for this time of year. As you
move toward our far southeastern areas, soils are trending closer to
normal levels.

Drought conditions in Illinois saw some fluctuations through the
winter season. At the end of November, 45 percent of the state was
experiencing D0 (Abnormally Dry) conditions with about 20 percent in
the D1 (Moderate Drought) category. Drought conditions were largely
confined to the northern two-thirds of Illinois at that time. By
early March, over 75 percent of Illinois was in some form of drought.
Approximately, 42 percent of the state was experiencing D0
(Abnormally Dry) conditions and about 32 percent was in the D1
(Moderate Drought) category. We have also recently seen the
introduction of small areas of D2 (Severe Drought) in portions of
central Illinois. These cover less than 3 percent of the state, but
signify a worsening of conditions. Only locations in the southern
quarter of the state have remained drought-free as of the latest
Drought Monitor issuance.

Frost had not been much of a concern for the first half of winter. It
was only with the very cold temperatures in later January that we
started seeing frost depths down to around a foot across portions of
central Illinois. A significant erosion of the frost occurred with
the warmer temperatures heading into February. That quickly turned
around after a mid-month blast of artic air across the region. At the
current time, Illinois is frost-free. That will likely not change as
we head further into March.

These soil conditions give us confidence that we have good
infiltration capability and storage capacity of rainwater which will
help to stifle flood potential in the near-term.


RIVER CONDITIONS...

River flooding through the winter season thus far has been minimal.
Only a few of the basins have pushed into minor flood. Those have
largely been short-lived and minimally impactful. As of this
issuance, there is no flooding occurring or currently forecast for
central and southeast Illinois.

Information, courtesy of the U.S. Geological Survey (USGS), shows
that streamflow conditions across the ILX Hydrologic Service Area are
overall near normal to below normal for this time of year. This gives
confidence that we have some capacity for handling rainfall runoff in
the near-term. However, with the recent rains, streamflow conditions
are not quite as favorable as they were a couple weeks ago.

Thanks to recent weeks of warm temperatures, river ice has not been a
concern for some time. As we head further into March, we see no
concern for ice jam flood potential.


WEATHER OUTLOOKS...
The weather pattern turns more progressive as we continue into next
week...with the potential for some severe weather as well. The above
normal temperatures will continue with highs largely in the 60s and
70s.
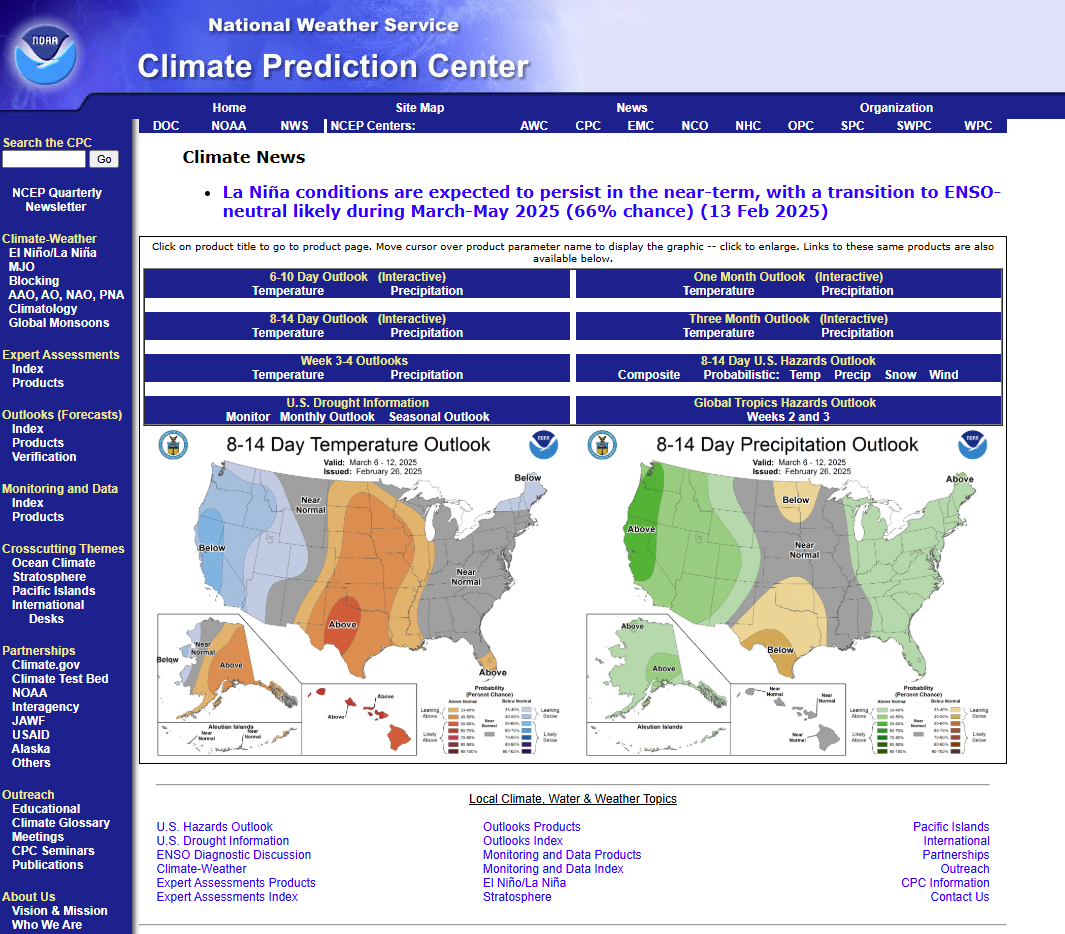
The 8 to 14 day outlook (Mar 21 to 27) favors above normal
temperatures across Illinois. Above normal precipitation is also
slightly favored during the period.
The most recent outlook for this spring (March / April / May) does
not favor any dominant trends for temperature across Illinois. In
contrast, most of Illinois is favored for above normal precipitation.
FLOOD OUTLOOK SUMMARY...
The risk of flooding this spring is near normal to below normal
across central and southeast Illinois. Its important to keep in mind
that it is possible for any high impact event to cause flooding.
Overall, minor flooding would be most likely with the possibility for
isolated moderate flooding.
Currently, there is no river flooding across our HSA. Streamflows are
in the normal to below normal range for this time of year. Deep layer
soil moisture is largely in deficit across the area with no frost
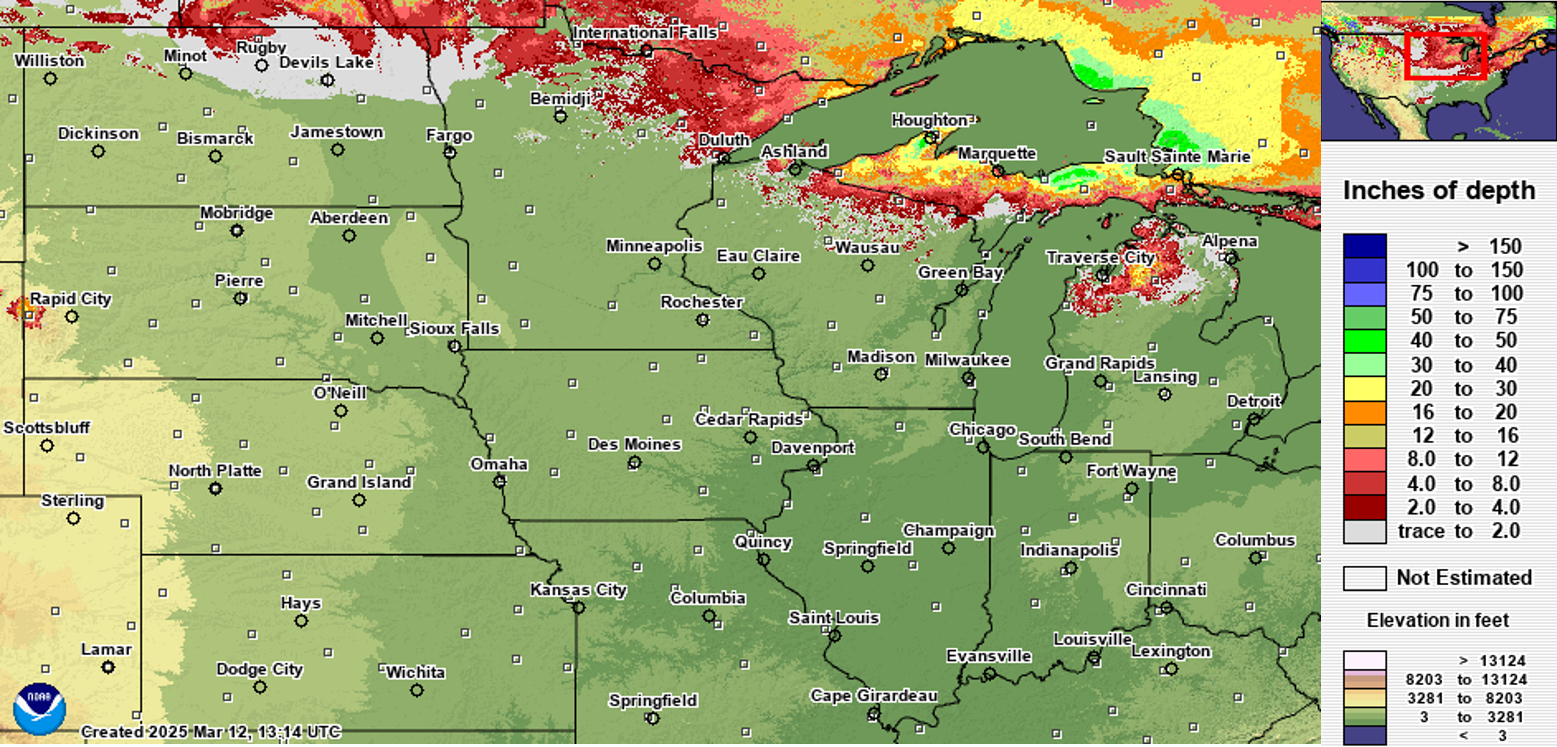
throughout Illinois. In addition, we have no lingering snowpack as we
head into spring. Taken altogether, these hydrologic conditions do
not contribute toward enhanced flood potential.
The weather pattern is expected to be more progressive over the next
couple of weeks with weather systems rolling through the region every
couple of days. Our next chance for rainfall comes Friday evening
with another opportunity mid next week. At this time, rainfall
amounts through next Thursday could reach up to 1.50 inches in some
areas...especially in eastern sections of the state. Thankfully,
current soil and streamflow conditions will allow for appreciable
storage of near-term rainfall. However, increasing soil moisture with
time will impact runoff potential with subsequent storm systems.
Keeping all of these things in mind, springtime rains will be the
primary driver of flooding this year. Current hydrologic conditions
are not significant contributing factors for longer term flood potential.
--------------------------------------------------------------------
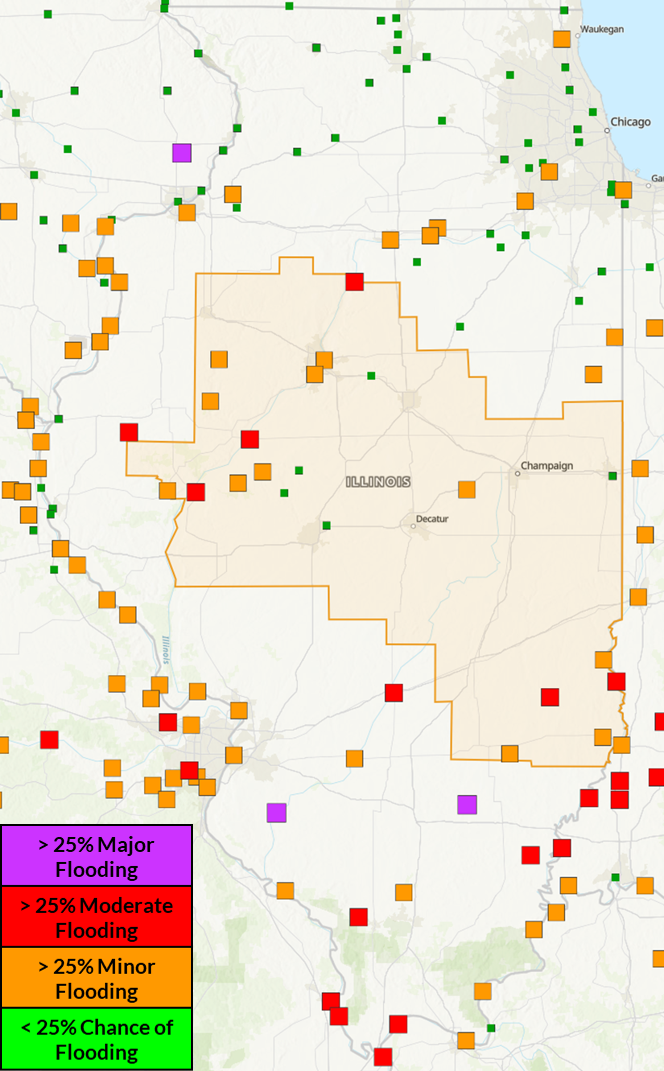
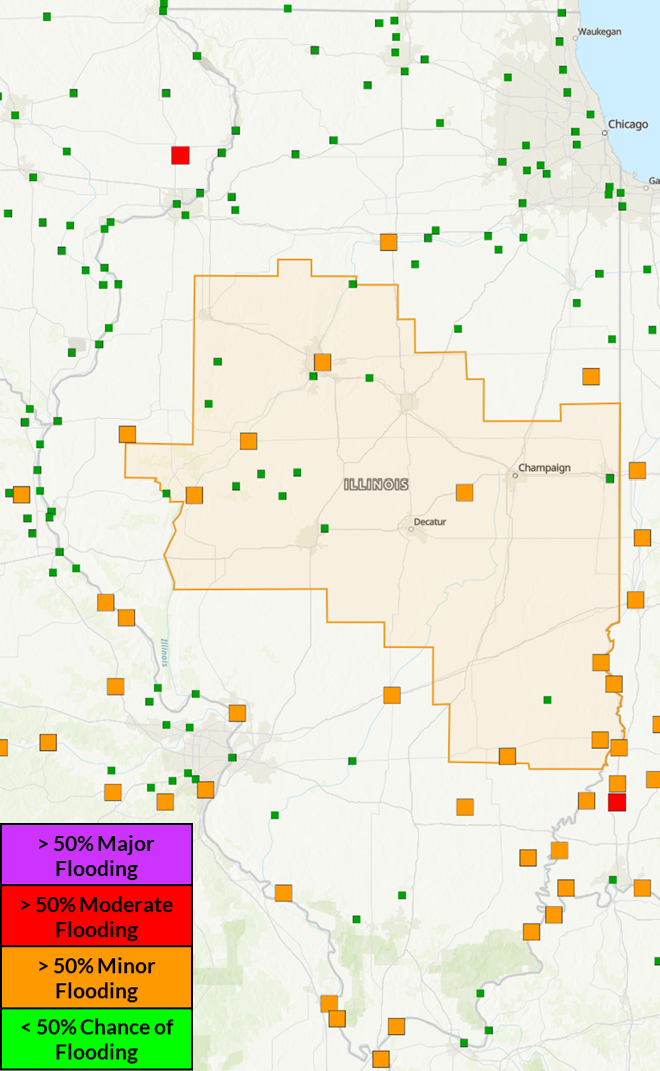
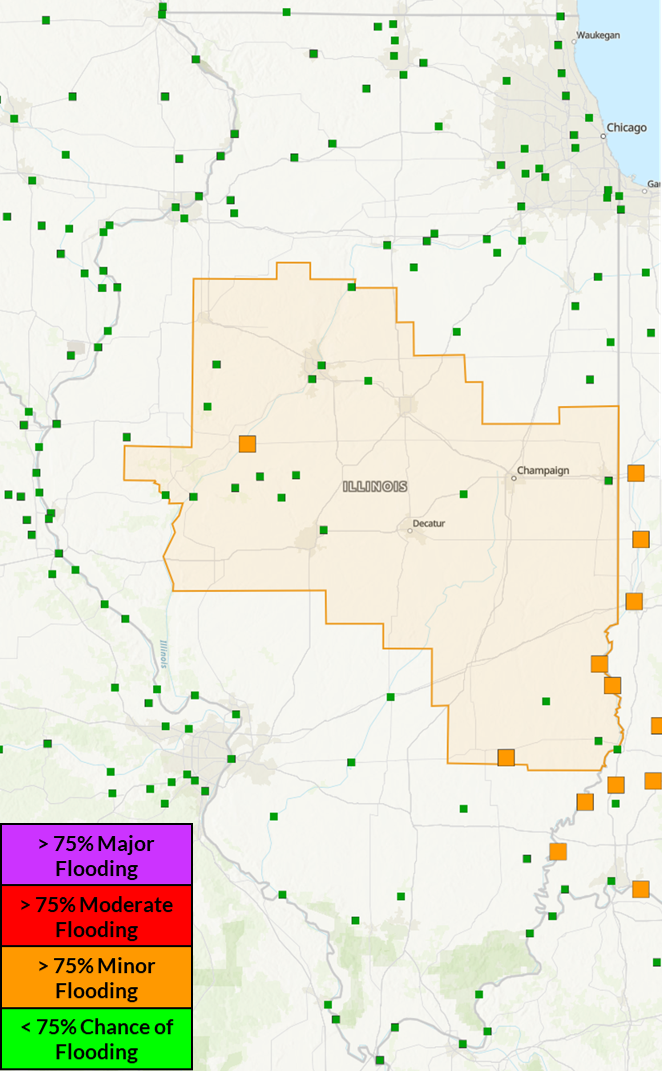
In Table 1 below...the current (CS) and historical (HS) or normal probabilities of exceeding minor...moderate...and major flood stages are listed for the valid time period. CS values indicate the probability of reaching a flood category based on current conditions. HS values indicate the probability of reaching a flood category based on historical or normal conditions. When the value of CS is more than HS...the probability of exceeding that level is higher than normal. When the value of CS is less than HS...the probability of exceeding that level is lower than normal. ...Table 1--Probabilities for minor...moderate and major flooding... Valid Period: 03/17/2025 - 06/15/2025 : Current and Historical : Chances of Exceeding : Flood Categories : as a Percentage (%) Categorical : Flood Stages (FT) : Minor Moderate Major Location Minor Mod Major : CS HS CS HS CS HS -------- ----- ----- ----- : --- --- --- --- --- --- :Illinois River Henry 23.0 24.0 31.0 : 36 55 30 49 <5 <5 Peoria 18.0 22.0 28.0 : 55 64 18 32 <5 <5 Peoria L/D 447.0 449.0 455.0 : 36 56 23 34 <5 <5 Havana 14.0 17.0 23.0 : 81 84 48 61 7 17 Beardstown 14.0 18.0 28.0 : 72 81 40 55 <5 5 :Mackinaw River Congerville 13.0 14.0 20.0 : 17 20 14 16 <5 <5 :Spoon River London Mills 15.0 21.0 24.0 : 43 47 6 <5 <5 <5 Seville 22.0 25.0 30.0 : 33 40 17 16 <5 <5 :Sangamon River Monticello 13.0 17.0 20.0 : 56 69 6 6 <5 <5 Riverton 23.0 26.0 29.0 : 10 11 <5 <5 <5 <5 Petersburg 23.0 24.0 33.0 : 20 25 12 17 <5 <5 :Salt Creek Greenview 16.0 17.0 20.0 : 16 17 10 11 <5 <5 :Sangamon River Oakford 471.0 472.9 478.5 : 26 35 16 20 <5 <5 Chandlerville 456.6 459.0 462.0 : 35 46 20 21 <5 <5 :Embarras River Lawrenceville 30.0 37.0 41.0 : 69 74 20 17 <5 <5 Ste. Marie 19.0 20.0 27.0 : 34 31 29 23 <5 <5 :Little Wabash River Clay City 18.0 22.0 25.0 : 84 83 21 20 <5 <5 :Vermilion River Danville 18.0 22.0 28.0 : 26 26 14 12 <5 <5 Legend CS = Conditional Simulation (Current Outlook) HS = Historical Simulation FT = Feet In Table 2 below...the 95 through 5 percent columns indicate the probability of exceeding the listed stage levels (FT) for the valid time period. ...Table 2--Exceedance Probabilities... Chance of Exceeding Stages at Specific Locations Valid Period: 03/17/2025 - 06/15/2025 Location 95% 90% 75% 50% 25% 10% 5% -------- ------ ------ ------ ------ ------ ------ ------ :Illinois River Henry 16.2 16.8 18.9 22.0 24.5 26.4 27.1 Peoria 12.9 13.2 13.9 18.2 21.2 22.8 23.6 Peoria L/D 435.9 436.5 441.8 445.7 448.8 450.1 451.0 Havana 10.3 11.9 14.4 16.9 19.9 22.0 24.6 Beardstown 11.0 11.9 13.3 16.6 21.6 25.1 26.4 :Mackinaw River Congerville 2.9 4.3 5.6 7.7 10.9 15.0 16.2 :Spoon River London Mills 5.6 6.9 9.0 12.7 17.5 19.9 22.0 Seville 10.0 11.0 13.8 17.4 23.9 25.9 27.6 :Sangamon River Monticello 8.8 9.5 12.1 13.3 14.8 15.9 17.4 Riverton 9.1 12.1 14.3 17.3 20.8 23.1 25.4 Petersburg 8.3 9.8 11.8 14.7 20.9 25.1 26.9 :Salt Creek Greenview 4.0 4.8 7.6 9.8 12.1 17.1 19.8 :Sangamon River Oakford 460.0 462.1 464.1 466.8 471.5 473.7 475.4 Chandlerville 447.3 449.6 451.7 454.6 458.4 460.4 461.7 :Embarras River Lawrenceville 24.7 27.5 29.1 32.7 35.8 39.6 40.7 Ste. Marie 7.9 8.7 12.1 16.1 20.7 22.3 23.7 :Little Wabash River Clay City 15.5 16.9 19.4 20.5 21.7 22.9 23.5 :Vermilion River Danville 7.8 8.3 10.2 14.0 18.2 23.3 25.9 In Table 3 below...the 95 through 5 percent columns indicate the probability of falling below the listed stage levels (FT) for the valid time period. ...Table 3--Nonexceedance Probabilities... Chance of Falling Below Stages at Specific Locations Valid Period: 03/17/2025 - 06/15/2025 Location 95% 90% 75% 50% 25% 10% 5% -------- ------ ------ ------ ------ ------ ------ ------ :Illinois River Henry 6.7 6.2 5.5 4.6 3.6 2.5 2.0 Peoria 7.0 6.4 5.7 4.8 3.8 2.7 2.1 Peoria L/D 7.3 6.6 5.9 4.9 3.9 2.8 2.2 Havana 8.9 8.4 7.1 5.9 4.7 3.3 2.5 Beardstown 12.2 10.9 9.4 7.4 6.1 4.3 3.3 :Mackinaw River Congerville 0.2 0.2 0.2 0.1 0.1 0.0 0.0 :Spoon River London Mills 0.3 0.3 0.2 0.2 0.1 0.1 0.0 Seville 0.6 0.5 0.4 0.3 0.2 0.1 0.1 :Sangamon River Monticello 0.2 0.2 0.1 0.1 0.1 0.0 0.0 Riverton 0.8 0.8 0.7 0.5 0.4 0.3 0.3 Petersburg 1.1 1.0 0.8 0.7 0.5 0.4 0.4 :Salt Creek Greenview 0.6 0.6 0.5 0.3 0.3 0.1 0.1 :Sangamon River Oakford 2.1 1.8 1.4 1.1 0.8 0.6 0.5 Chandlerville 2.2 1.8 1.5 1.2 0.9 0.6 0.6 :Embarras River Lawrenceville 18.5 18.2 17.6 17.2 16.9 16.8 16.6 Ste. Marie 2.4 2.0 1.7 1.4 1.1 0.9 0.8 :Little Wabash River Clay City 6.5 5.8 5.4 5.0 4.5 4.1 3.9 :Vermilion River Danville 3.5 3.3 3.2 3.0 2.9 2.6 2.5 These long-range probabilistic outlooks contain forecast values that are calculated using multiple season scenarios from 30 or more years of climatological data...including current conditions of the river...soil moisture...snow cover...and 30 to 90 day long-range outlooks of temperature and precipitation. By providing a range of probabilities...the level of risk associated with long-range planning decisions can be determined. These probabilistic forecasts are part of the NWS-National Water Prediction Service (NWPS). -------------------------------------------------------------------- FLOOD TERMINOLOGY... Minor flooding is used to indicate minimal or no property damage. However, some public inconvenience is possible. Moderate flooding is used to indicate some inundation of structures and roads near the river. Transfer of property to a higher elevation or another location may be necessary. Some evacuations may also be required. Major flooding is used to indicate extensive inundation and property damage, usually characterized by the evacuation of people and livestock and closure of both primary and secondary roads. FOR MORE INFORMATION... Visit our web page at www.weather.gov/ilx for more official NWS river and weather information. To view graphical NWPS information, including forecasts, select Rivers and Lakes from along the top menu bar. Full NWPS graphics are available for all forecast points in the ILX Hydrologic Service Area. For 30 to 90 day temperature and precipitation outlooks, visit the web page of the Climate Prediction Center at www.cpc.ncep.noaa.gov. This is the third and final issuance of the 2025 Spring Flood Outlook for central and southeast Illinois. Look for the NOAA National Spring Flood Outlook to be released on Thursday, March 20th. |
Extended Range Outlooks
|