Overview
|
An unusually strong high pressure area aloft resulted in a widespread dangerous heat wave across the central United States the week of August 20th. Unusually high humidity levels for such extreme temperatures resulted in heat indices rarely experienced across portions of the Midwest, in excess of 120 degrees in many areas. Little relief was afforded at night during the peak of the heat wave, with the heat index only falling into the 80s in some cases. |
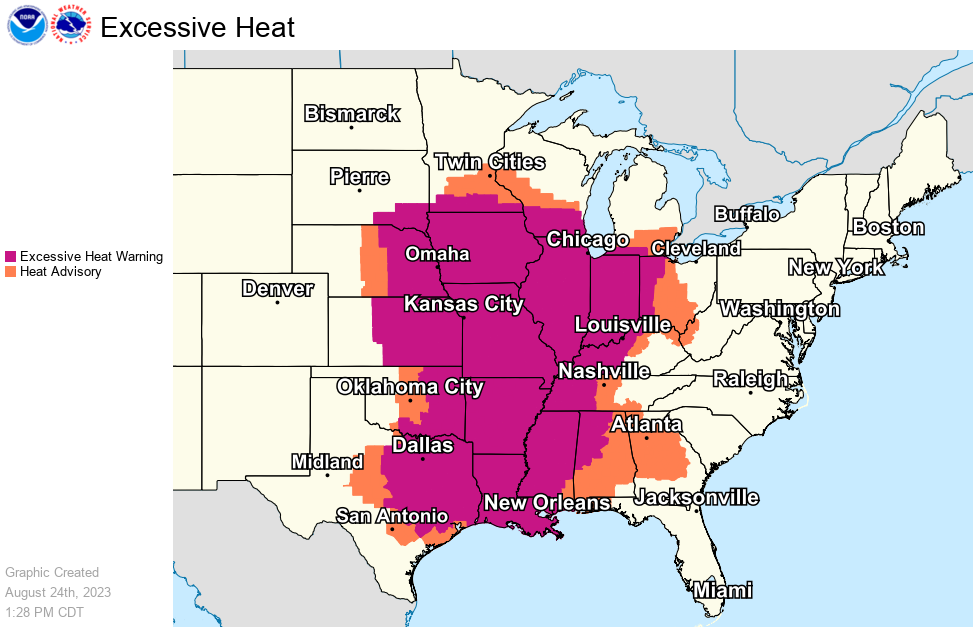 Extent of Excessive Heat Warnings (purple shaded areas) on Thursday, August 24th |
Heat Index
Observed high temperatures / peak heat index values:
| Location | Sun. 8/20 | Mon. 8/21 | Tue. 8/22 | Wed. 8/23 | Thu. 8/24 | Fri. 8/25 |
|---|---|---|---|---|---|---|
| Bloomington | 89 / 109 | 89 / 101 | 90 / 103 | 93 / 116 | 95 / 115 | 90 / 103 |
| Champaign | 89 / 100 | 92 / 106 | 92 / 103 | 94 / 112 | 96 / 116 | 95 / 112 |
| Decatur | 90 / 111 | 92 / 119 | 93 / 114 | 95 / 117 | 99 / 118 | 98 / 117 |
| Lawrenceville | 91 / 108 | 93 / 114 | 95 / 112 | 94 / 111 | 97 / 121 | 101 / 121 |
| Mattoon | 91 / 102 | 92 / 108 | 93 / 105 | 94 / 108 | 99 / 113 | 99 / 112 |
| Peoria | 92 / 111 | 91 / 102 | 92 / 108 | 97 / 121 | 99 / 118 | 95 / 106 |
| Springfield | 92 / 109 | 91 / 108 | 94 / 110 | 95 / 117 | 97 / 115 | 99 / 116 |
Unlike temperature, heat index values are a calculated parameter instead of directly measured. These heat indices are based on the routine hourly observations taken at each site. It is possible they may have gone higher in between observations. Since the heat index is based on shaded conditions, exposure to full sunshine can increase the perceived heat index by as much as 15 degrees.
Environment
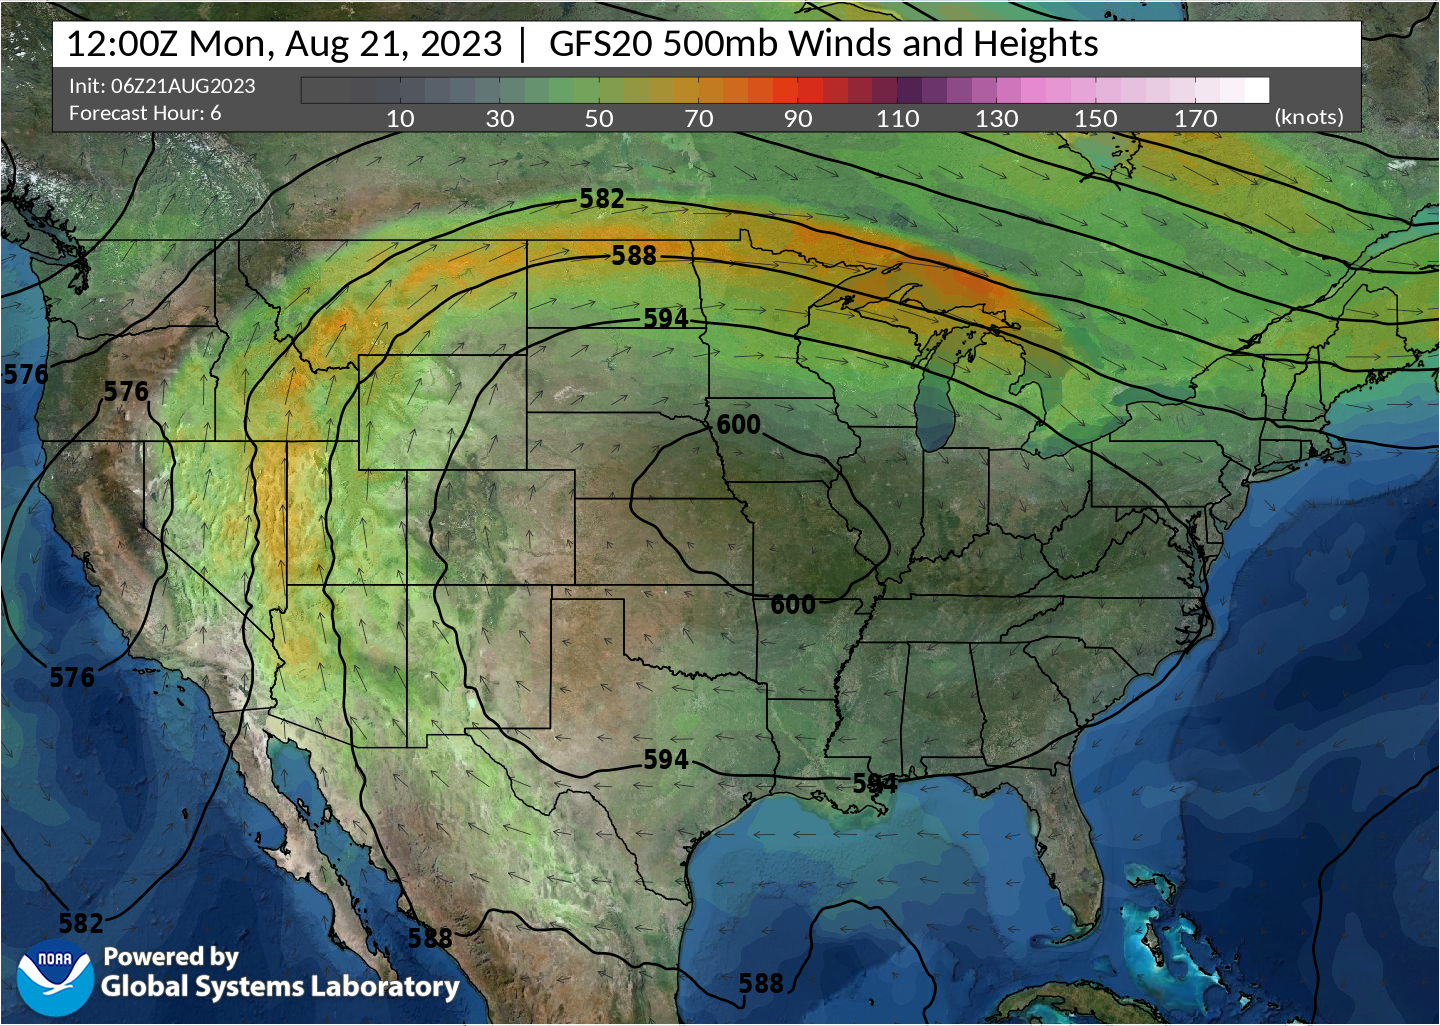
An unusually strong high pressure area aloft was centered over the nation's mid section much of this period (figure 1). In this setup, steering of any storm systems goes up around the top of the high, keeping the area underneath it hot and dry. Temperatures continued to increase each day, as the high pressure serves as a "cap" to allow heat to build at the surface and trap it there.
 |
 |
| Figure 1: 500 mb map for Monday morning, August 21 |
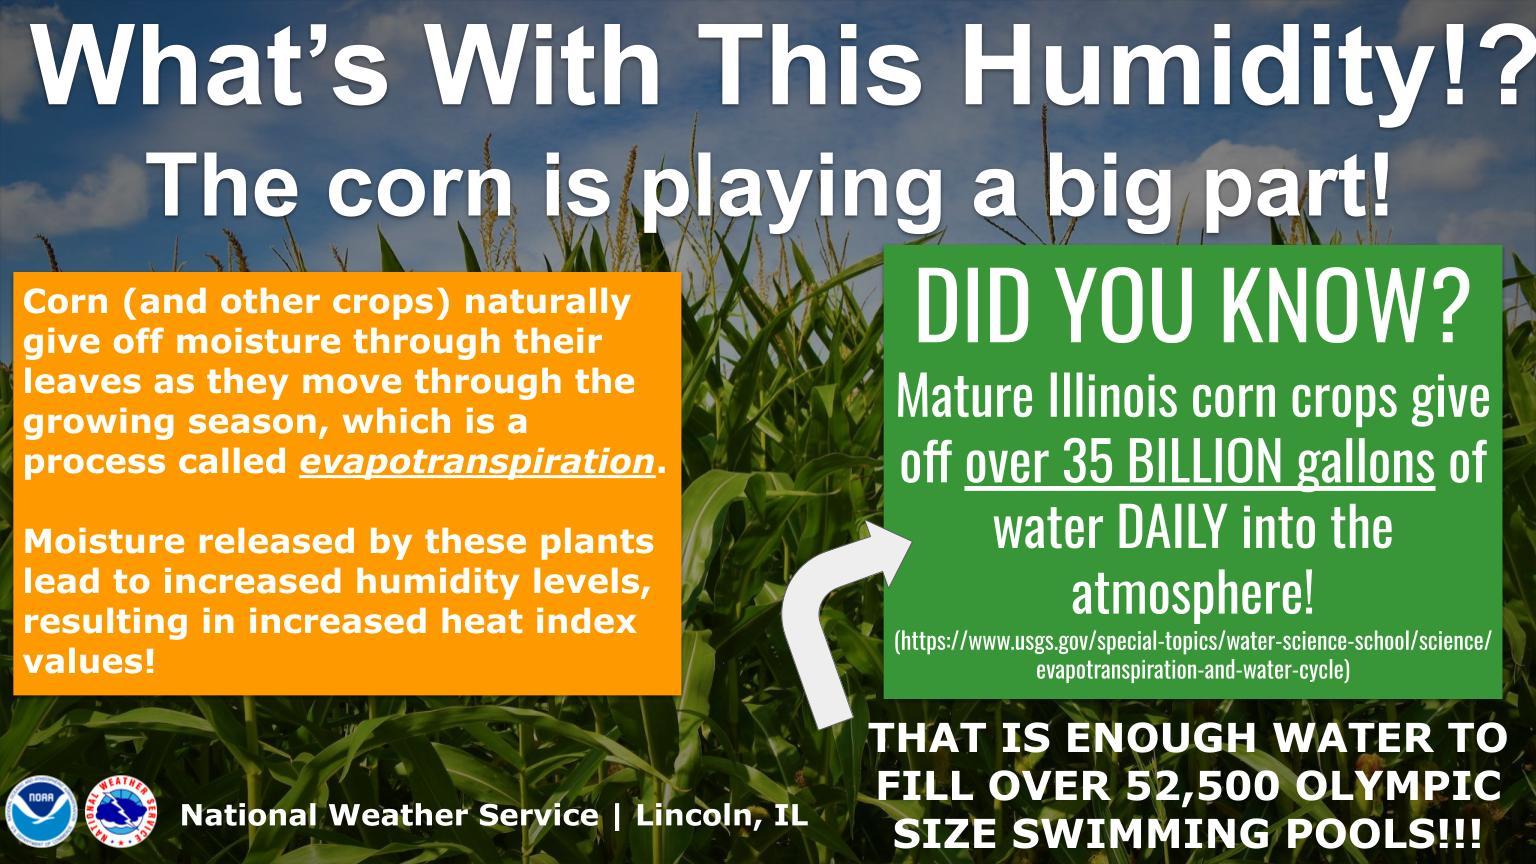
Figure 2: Explanation of evapotranspiration, also known as "corn sweat" |
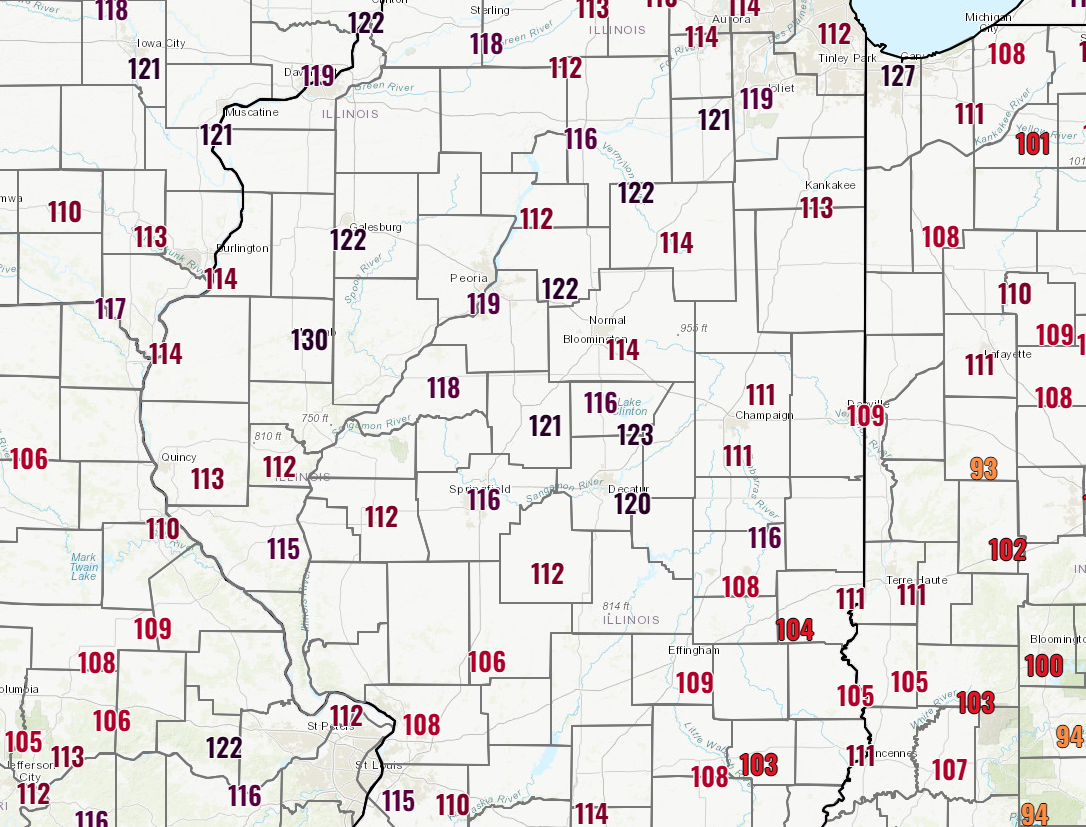
During the peak of the event, widespread dew points in the lower 80s were observed, allowing unusually high humidity levels for such temperatures. Peoria tied its all-time dew point record of 83 degrees on August 23rd. What was with all the humidity? Corn and other crops give off moisture from their leaves, in a process called evapotranspiration (figure 2). The excess moisture contributes to increase humidity levels, making the air feel much worse. In the opposite effect, a lack of moisture (you may have heard of the phrase "it was a dry heat") can make the air actually feel cooler than the observed temperature.
 |
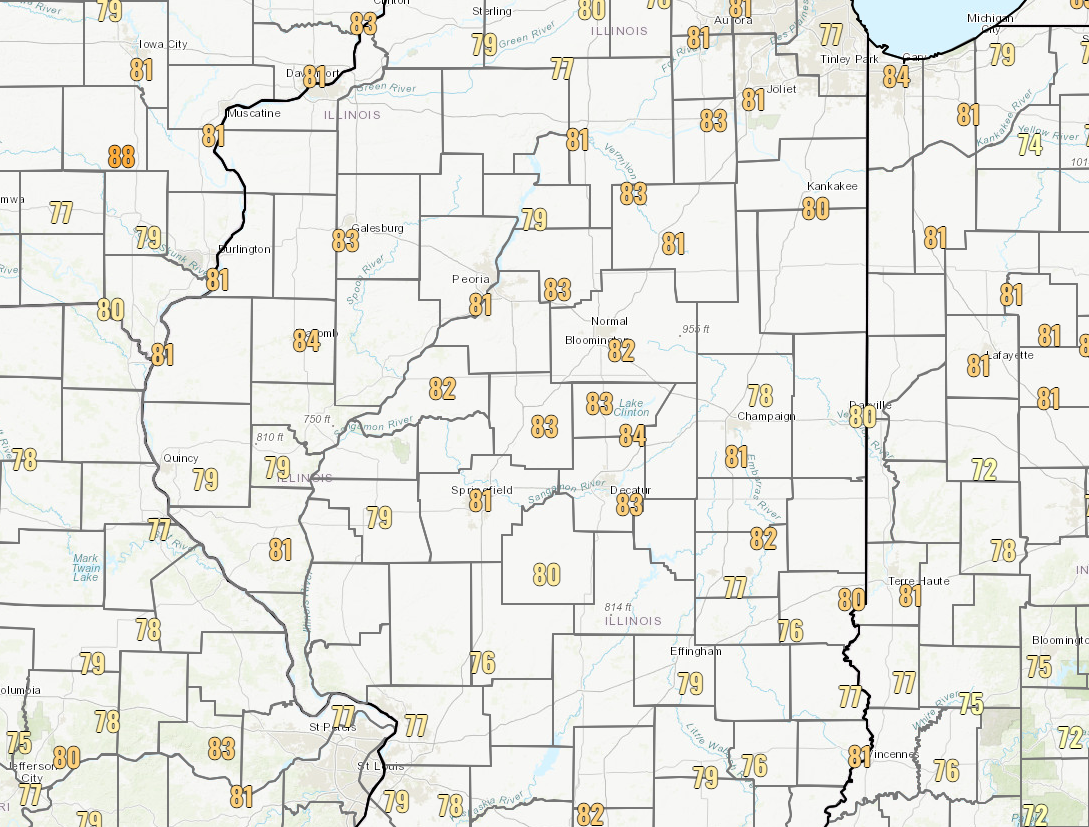 |
| Figure 4: Heat index values at 4 pm on Wednesday, August 23 | Figure 5: Dew point temperatures at 4 pm on Wednesday, August 23 |
At air temperatures below body temperature, radiation and convection are efficient methods of moving heat out of the relatively warmer body and into the relatively cooler air. However, once the air temperature reaches 95°F (35°C), close to the body’s normal average temperature of 98°F (37°C), heat loss by radiation and convection ceases. At this point, heat loss by sweating becomes all-important. But sweating does not remove heat if the sweat can’t evaporate, meaning that high relative humidity slows evaporation and thus prevents an important method of how our bodies cool themselves.
The heat index uses a combination of temperature and relative humidity to come up with an apparent temperature. However, this assumes shady conditions, and exposure to full sunshine can increase the heat index values by up to 15 degrees. Learn more about the heat index at NOAA's JetStream educational page.
 |
Media use of NWS Web News Stories is encouraged! Please acknowledge the NWS as the source of any news information accessed from this site. |
 |