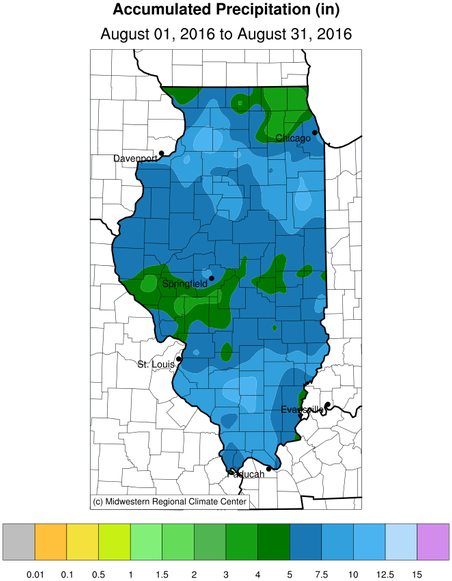
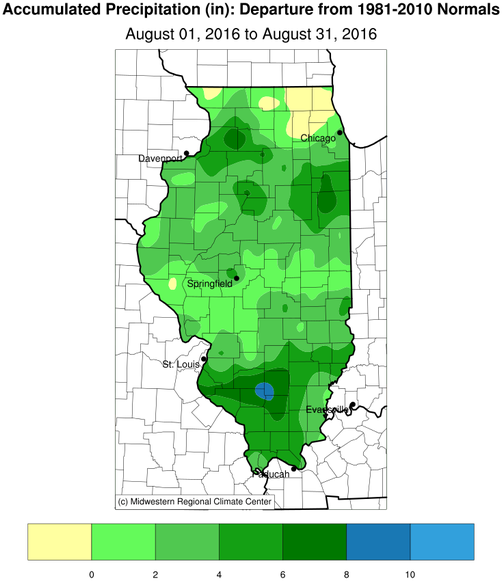
August 2016 will go down as being exceptionally wet across much of central and southeast Illinois, with most of the region seeing rainfall at least 5 inches above normal. Some of the highlights:
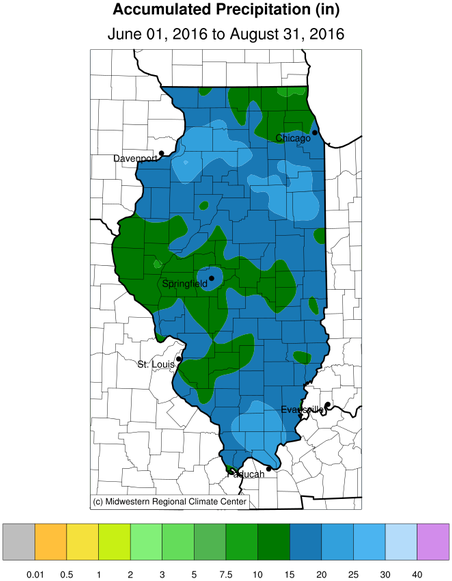
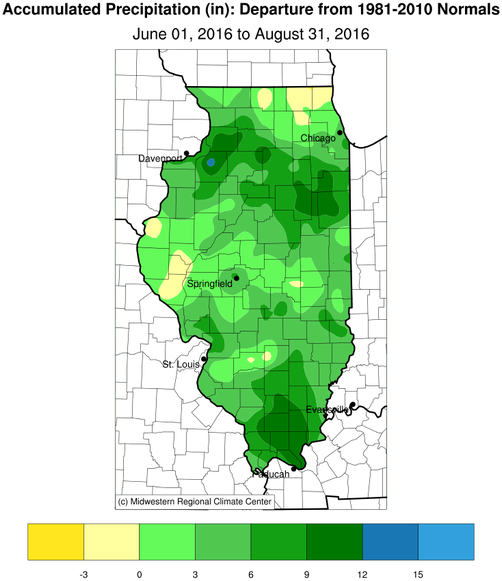
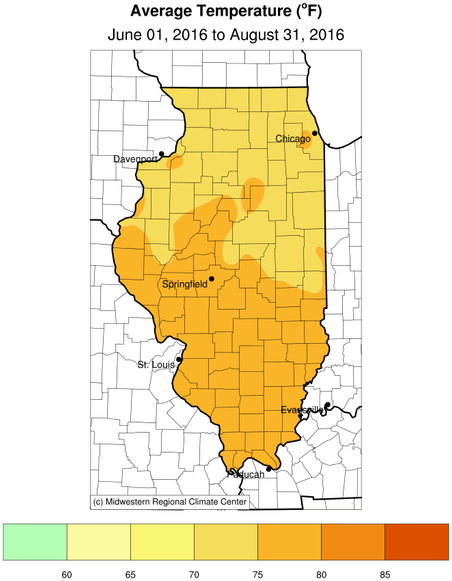
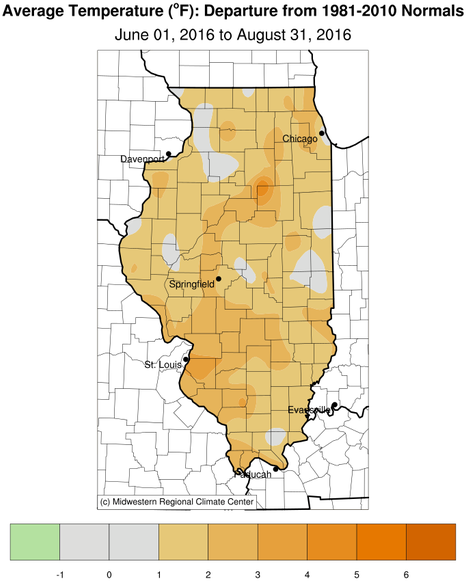
Meteorological summer consists of the period from June 1 to August 31. While the period started off dry, with many areas south of I-74 seeing below normal rainfall, a wetter pattern set up and much of central and southeast Illinois ended up with above normal rainfall for the 3-month period. Springfield finished with its second wettest summer on record, and summer totals in the top 10 wettest amounts were observed at Effingham, Galesburg, Havana, and Normal as well. Temperatures averaged near or above normal over the area.
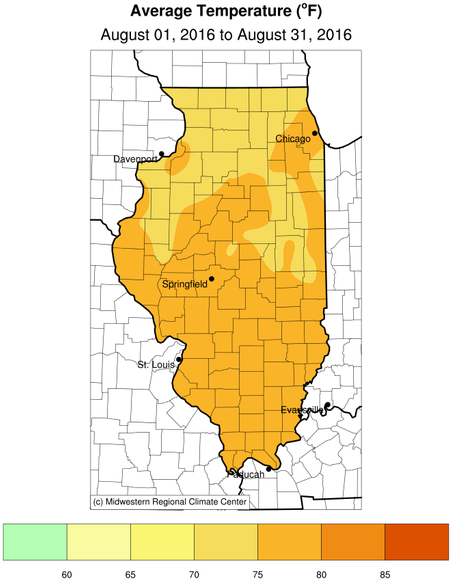
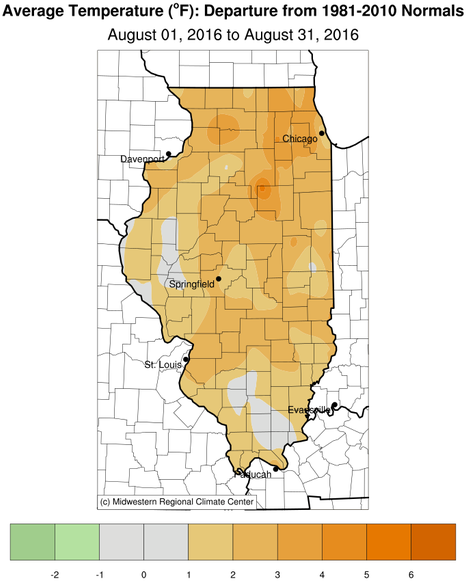
Rainfall and Temperature Maps
 |
 |
 |
 |
Climate Data:
The table below summarizes August rainfall and temperature, and departure from normal for selected cities across central and southeast Illinois.
| Location | Rainfall | vs. Normal |
Average Temp. |
vs. Normal |
Notes |
|---|---|---|---|---|---|
| Charleston | 4.81 | +1.88 | 77.9 | +3.3 | |
| Danville | 5.38 | +1.90 | 76.5 | +3.0 | |
| Decatur | 4.95 | +1.18 | 75.9 | +0.8 | |
| Effingham | 5.67 | N/A | 78.2 | N/A | |
| Flora | 7.86 | +4.72 | 77.8 | +2.7 | |
| Galesburg | 7.07 | +3.10 | 74.4 | +1.7 | 9th wettest August on record |
| Havana | 7.58 | +3.82 | N/A | N/A | 3rd wettest August on record |
| Jacksonville | 3.81 | +0.30 | 76.2 | +0.9 | |
| Lincoln | 6.44 | +2.52 | 74.6 | +1.6 | 9th wettest August on record |
| Normal | 6.00 | +2.20 | 75.3 | +2.8 | |
| Olney | 7.83 | +4.63 | 77.0 | +1.8 | Tied 7th wettest August on record |
| Paris | 5.43 | +1.52 | 75.3 | +1.5 | |
| Peoria | 7.45 | +3.24 | 76.4 | +2.6 | 3rd wettest August on record |
| Springfield | 10.82 | +7.58 | 77.4 | +3.2 | Wettest August on record 7th wettest month all time Wettest calendar day on record (5.59 inches on 12th) |
| Tuscola | 5.35 | +2.09 | 75.5 | +1.8 | |
| Urbana | 4.15 | +0.22 | 76.0 | +2.6 |
The following links are to the monthly climate summaries for area cities. Only the summaries for Peoria, Springfield, and Lincoln are considered "official", meaning they are the station of record for their respective locations. The other summaries are "supplemental", meaning another location in the area is the official climate station for the city.
Climate data for other cities is available at https://www.weather.gov/climate/xmacis.php?wfo=ilx
Rainfall and Temperature Maps
 |
 |
 |
 |
Climate Data:
The table below summarizes seasonal rainfall and temperature, and departure from normal for selected cities across central and southeast Illinois.
| Location | Rainfall | vs. Normal |
Average Temp. |
vs. Normal |
Notes |
|---|---|---|---|---|---|
| Charleston | 12.18 | +0.43 | 77.3 | +2.7 | |
| Danville | 17.75 | +5.05 | 75.5 | +1.9 | |
| Decatur | 12.63 | +0.38 | 75.4 | +0.4 | |
| Effingham | 15.44 | N/A | 77.7 | N/A | 9th warmest summer on record |
| Flora | 18.78 | +7.35 | 78.0 | +2.6 | |
| Galesburg | 19.37 | +6.72 | 74.0 | +1.2 | 6th wettest summer on record |
| Havana | 18.62 | +6.46 | N/A | N/A | 9th wettest summer on record |
| Jacksonville | 14.35 | N/A | 76.3 | N/A | |
| Lincoln | 17.49 | +4.19 | 74.4 | +1.0 | |
| Normal | 17.18 | +5.31 | 74.8 | +2.0 | 9th wettest summer on record |
| Olney | 14.36 | +2.64 | 76.5 | +1.5 | |
| Paris | 15.66 | +2.97 | 74.6 | +0.7 | |
| Peoria | 15.90 | +5.28 | 76.1 | +2.4 | |
| Springfield | 22.26 | +10.62 | 77.3 | +3.1 | 2nd wettest summer on record 5th wettest of any season on record |
| Tuscola | 12.57 | +0.11 | 75.0 | +1.0 | |
| Urbana | 15.71 | +2.74 | 75.0 | +1.5 |
The following links are to the seasonal climate summaries for area cities. Only the summaries for Peoria, Springfield, and Lincoln are considered "official", meaning they are the station of record for their respective locations. The other summaries are "supplemental", meaning another location in the area is the official climate station for the city.
Climate data for other cities is available at https://www.weather.gov/climate/xmacis.php?wfo=ilx